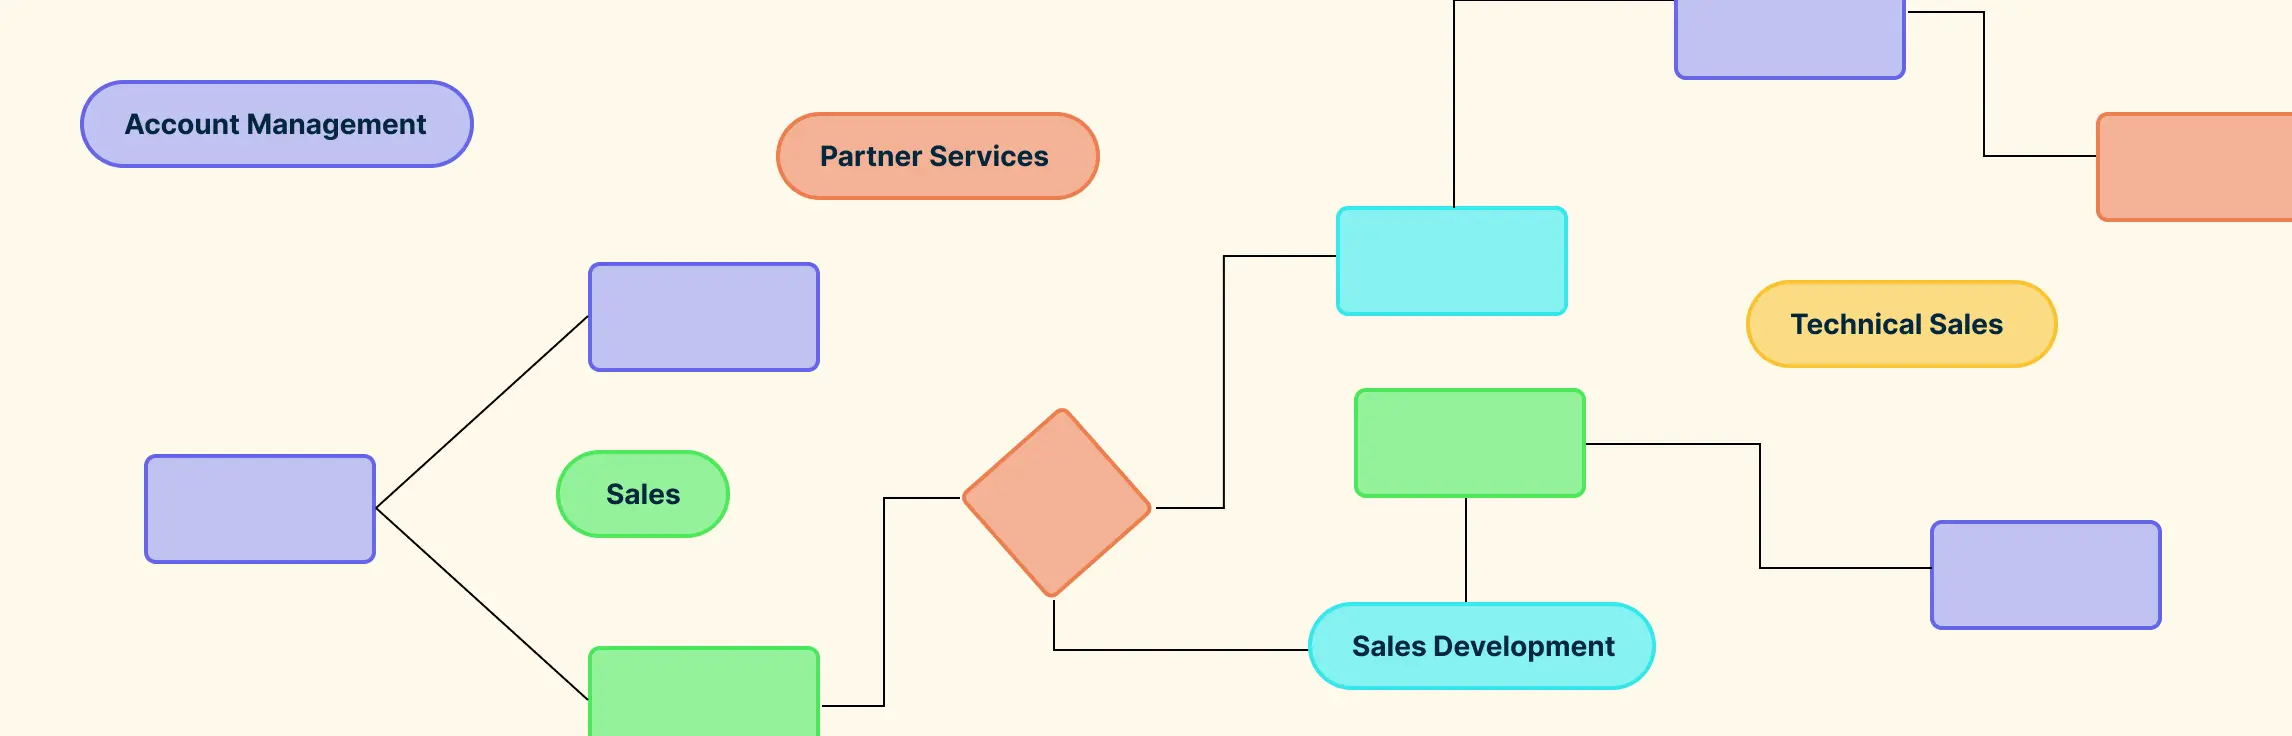
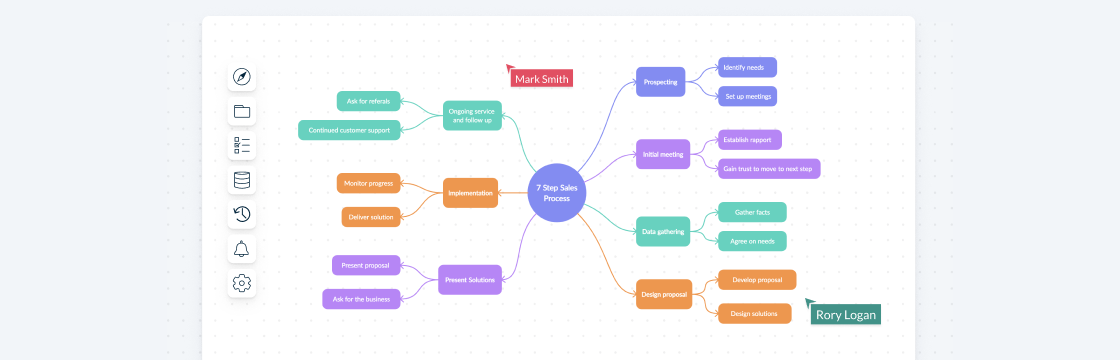
When sales stages, responsibilities, and handoffs are unclear, leads can stall and teams may apply the process inconsistently. Sales process mapping makes the workflow visible from lead generation through closing, including the decisions, roles, systems, and customer touchpoints involved. This guide explains what a sales process map is, how to create one, which mapping methods to use, and how to keep the map useful as your sales process evolves.
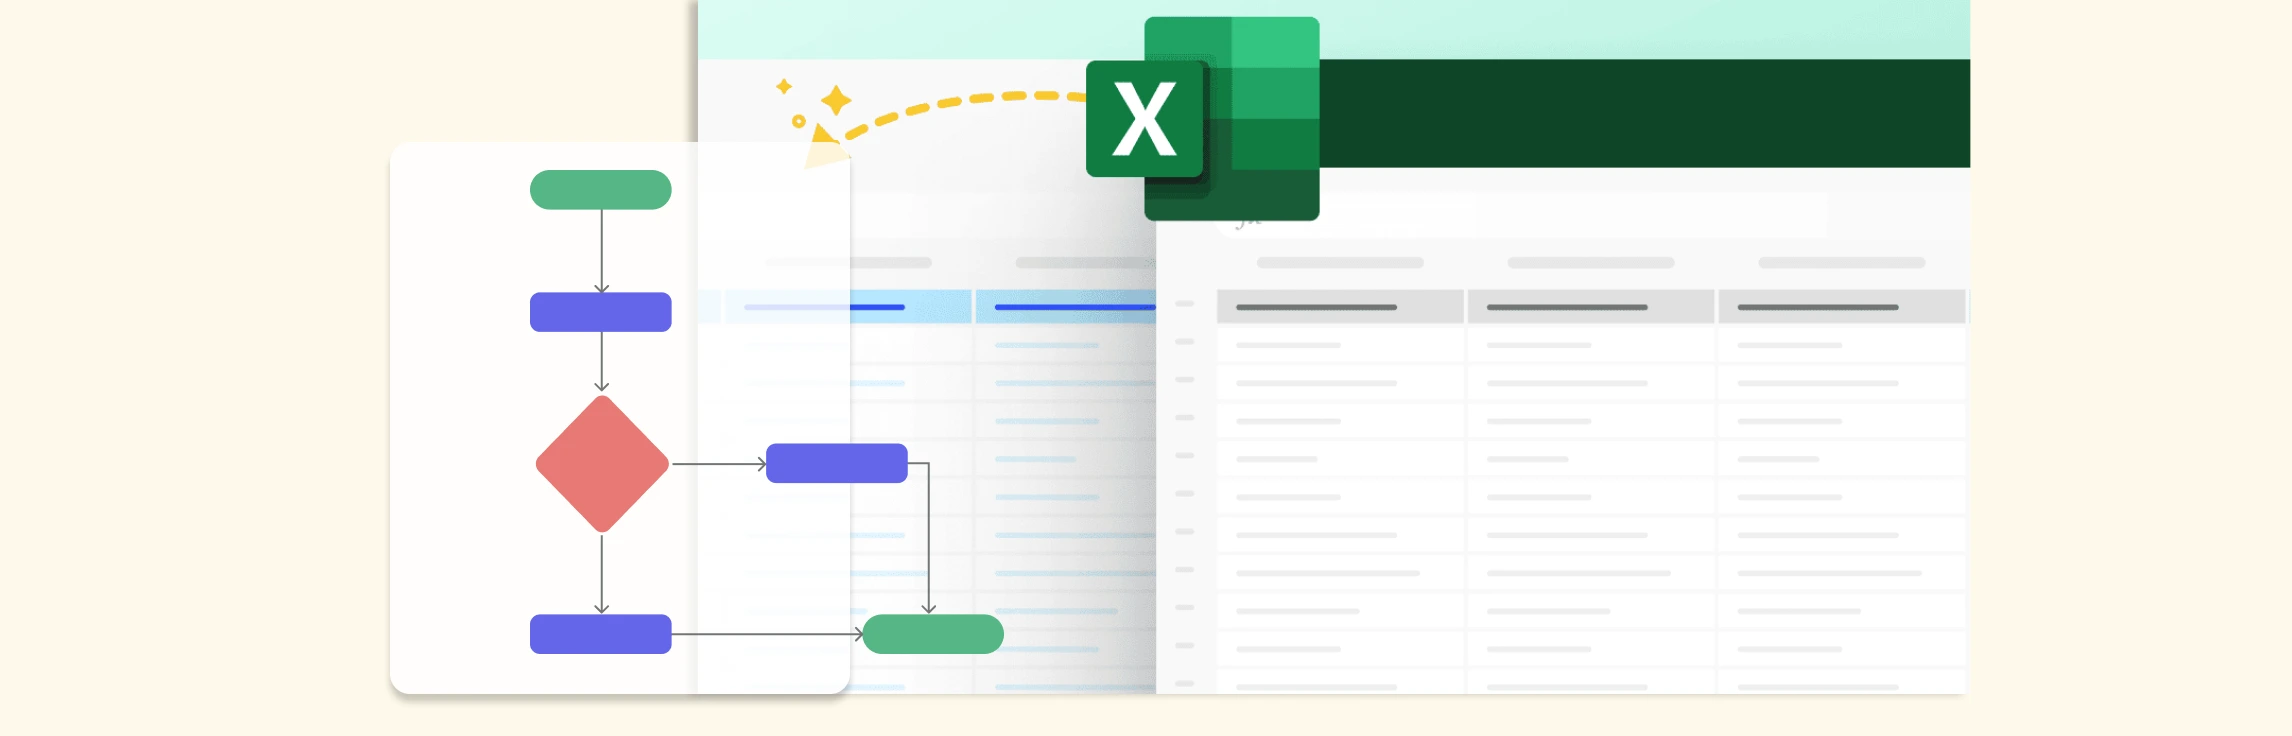
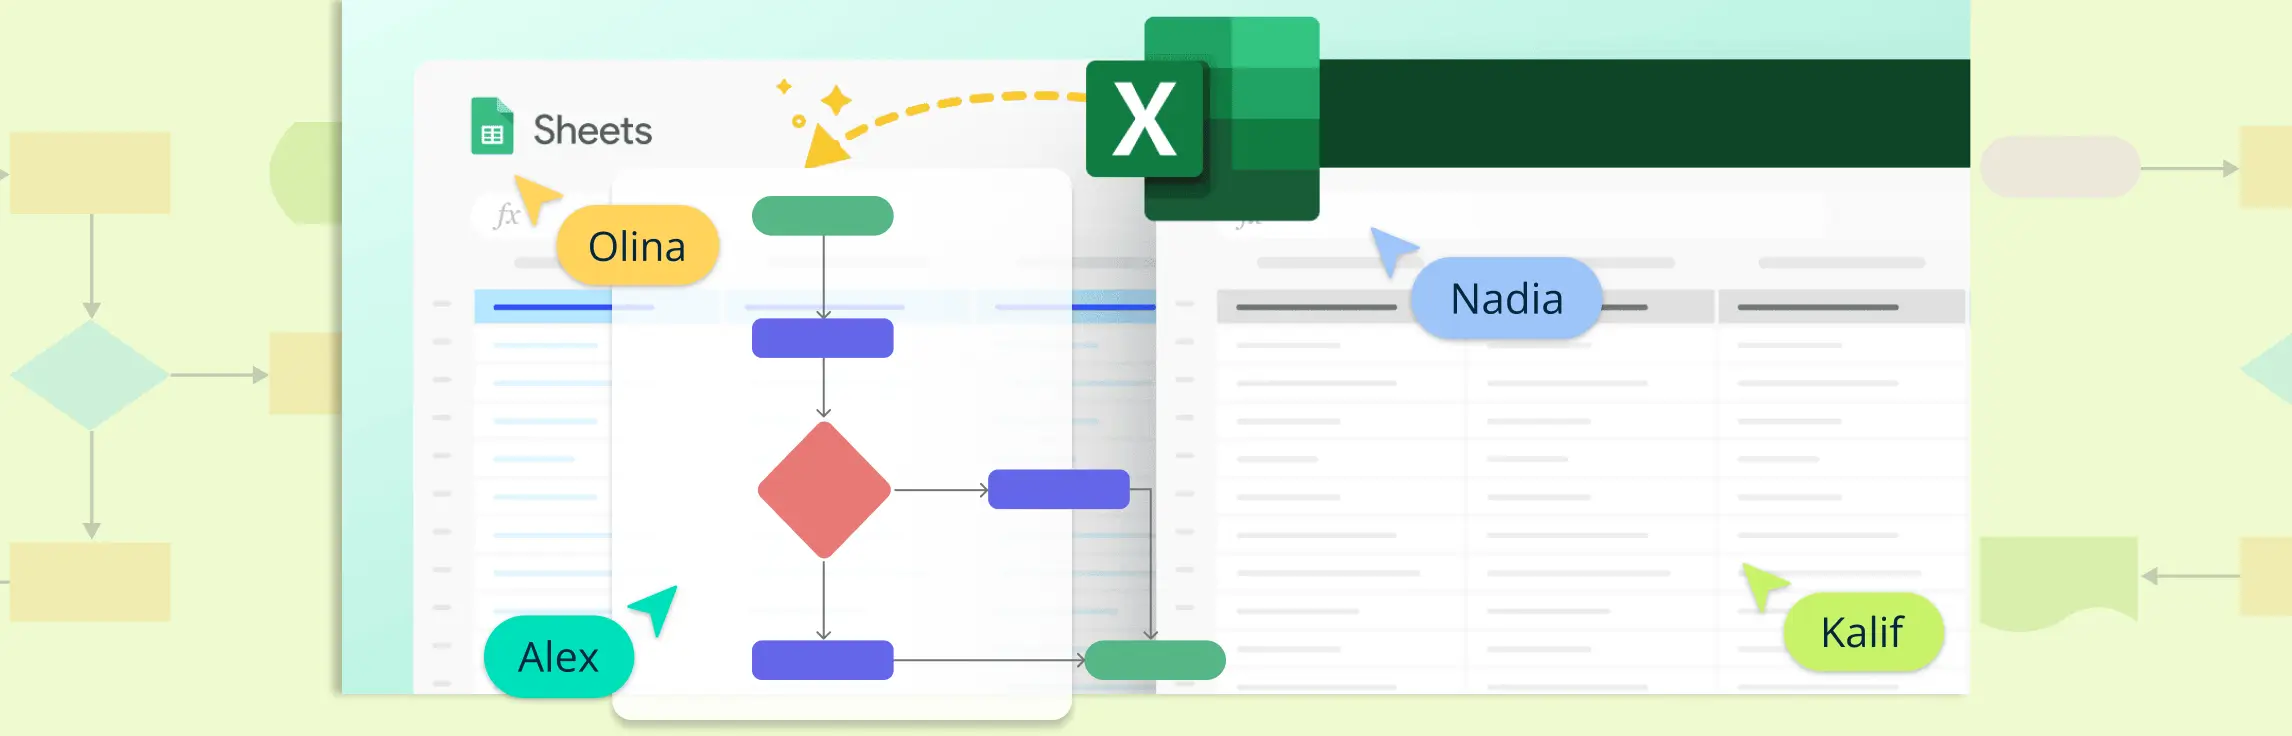
If you want to learn how to make a flowchart in Excel, then this guide is for you. Learn how to build a flowchart in Excel, make it interactive, explore its limitations, and discover a better alternative and free templates to get started today.
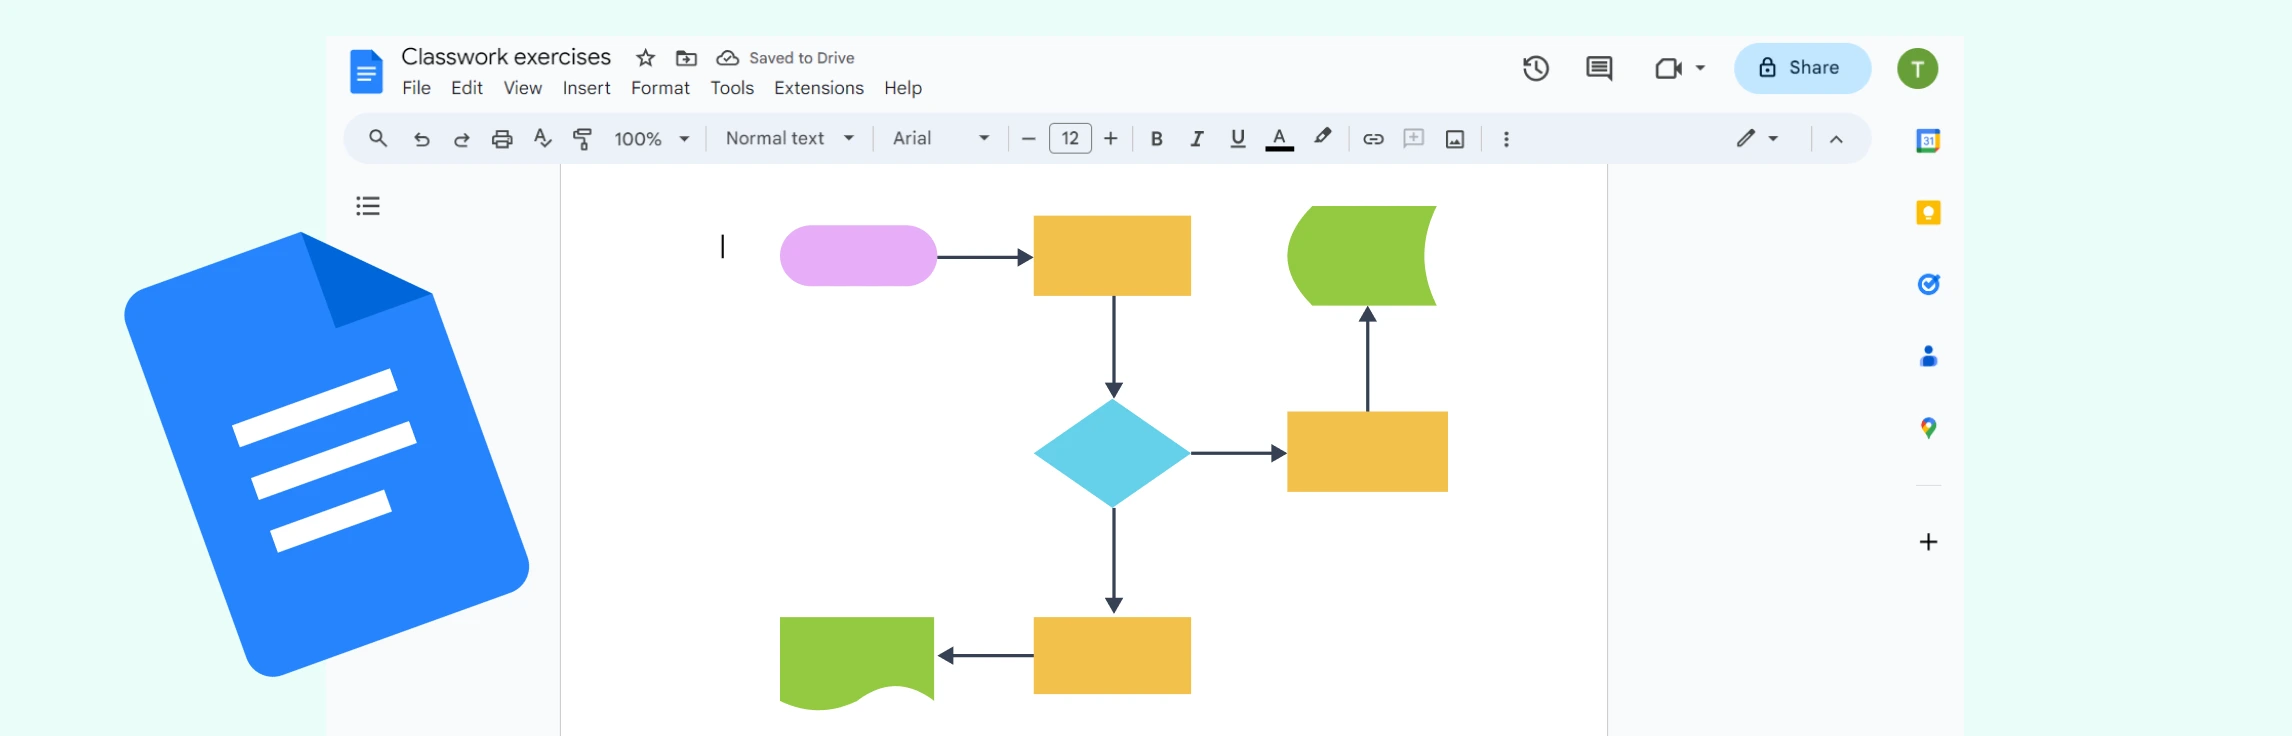
If you’ve been wondering “how do I make a flowchart in Google Docs”, then this is the guide for you. This tutorial covers how to build a flowchart in Google Docs in just six simple steps, go through the limitations, explore a better alternative, and compare its features to Google Docs.
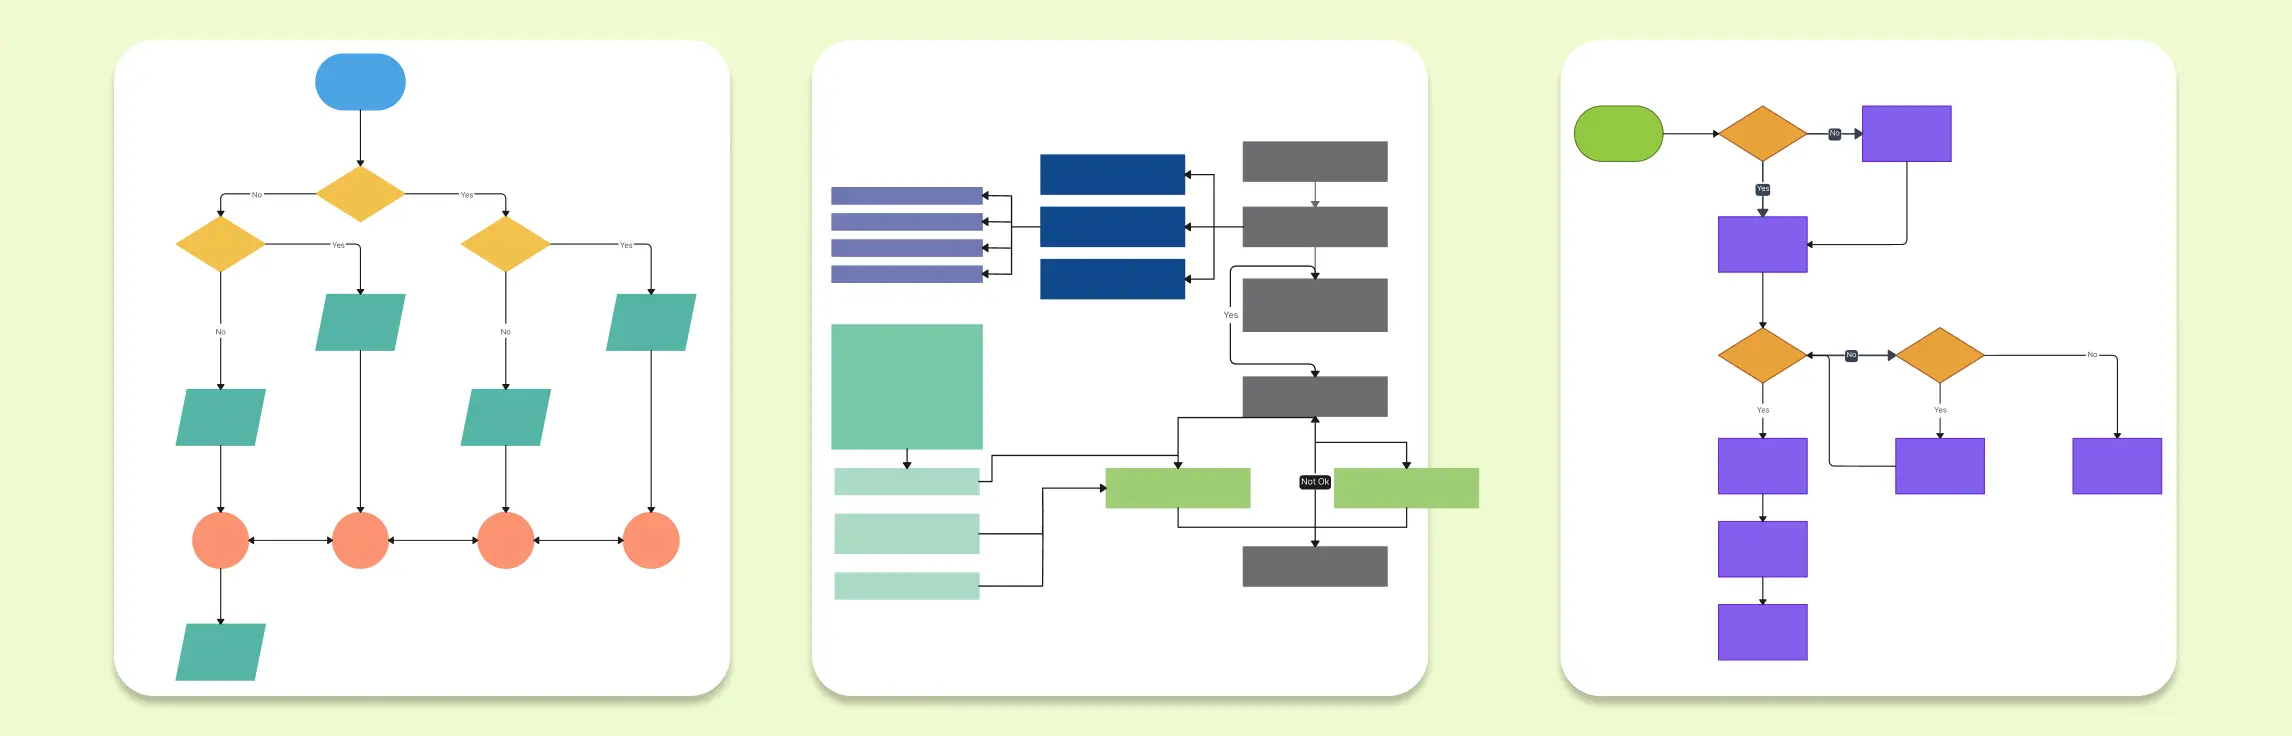
Flowcharts are powerful tools that simplify complex processes, visualize workflows, and aid in decision-making. Whether you’re designing a customer journey, mapping out business processes, or planning project tasks, flowcharts help present information in a clear and structured format. This guide presents a collection of flowchart examples for business, offering templates that cater to diverse operational needs.
Programming flowcharts help you visualize how code works before you write, debug, or explain it. A good programming flowchart example shows the sequence of steps, decisions, loops, inputs, outputs, and errors that make up a program’s logic.
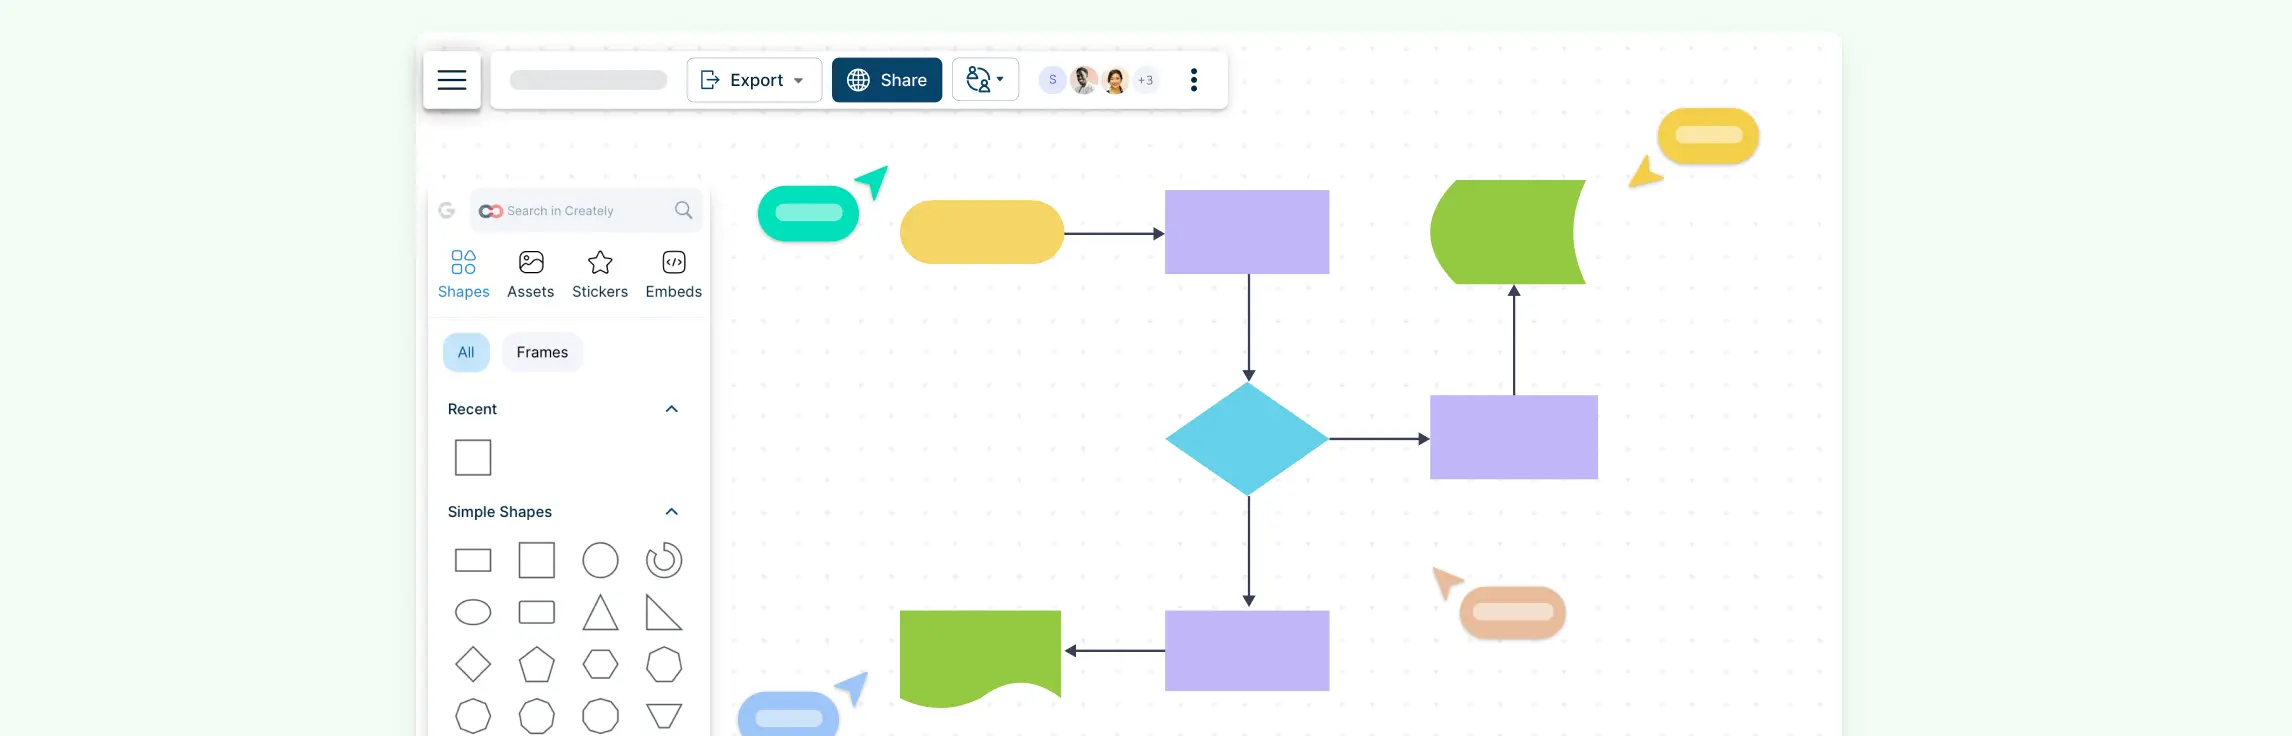
Flowcharting is an effective way to visualize processes, helping you better understand, communicate, and improve the steps involved. Whether you’re mapping out business processes or personal workflows, flowchart ideas can help streamline tasks and enhance clarity. Below, we’ve compiled 10 flowchart ideas and editable flowchart templates you can test out using Creately’s intuitive diagramming software.
Flowcharts are a great way for students to organize thoughts, simplify complex tasks, and improve problem-solving skills. In this guide, we’ll explore flowchart examples for students that cover various academic and personal scenarios, from solving math problems to planning study routines.
Flowcharts are powerful tools for visualizing processes and making complex information easier to understand. Whether you’re mapping out a business process, designing software, or planning a project, flowcharts help you break down tasks step by step. However, to create clear and effective flowcharts, it’s important to follow certain flowchart rules.
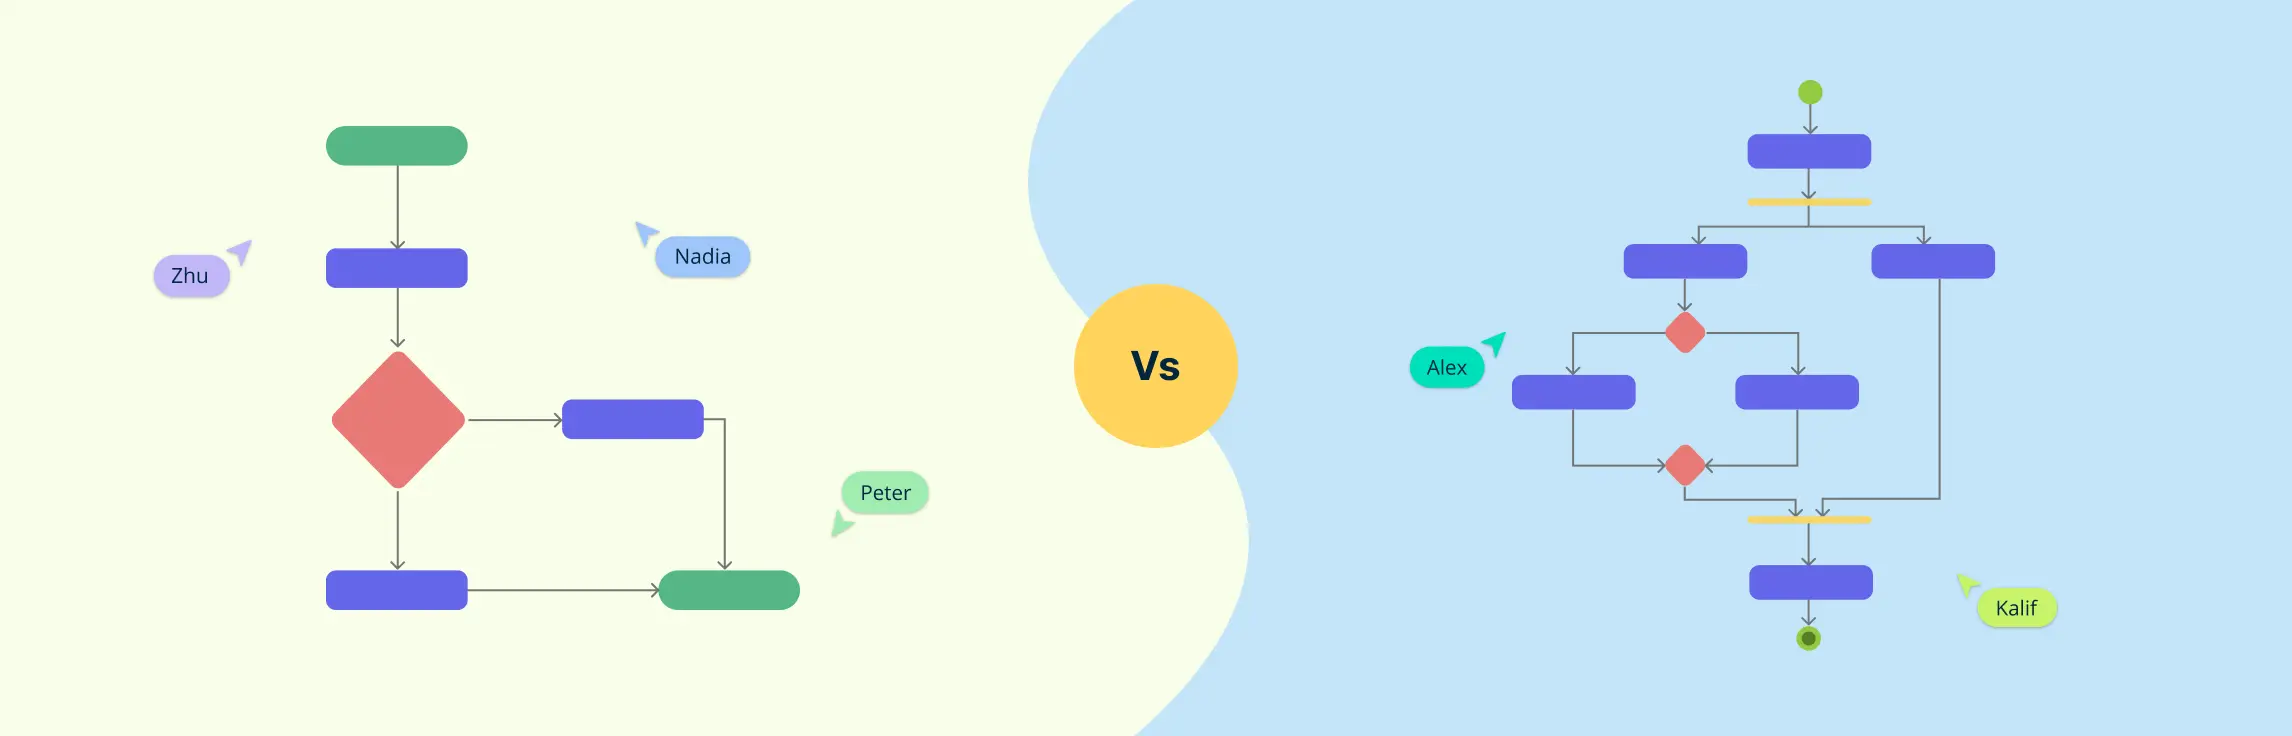
When mapping out processes, whether for business, software development, or everyday workflows, visual diagrams make things clearer. Two commonly used tools for this are flowcharts and activity diagrams. At first glance, they may seem similar—both show steps in a process—but they serve different purposes and are used in different fields.
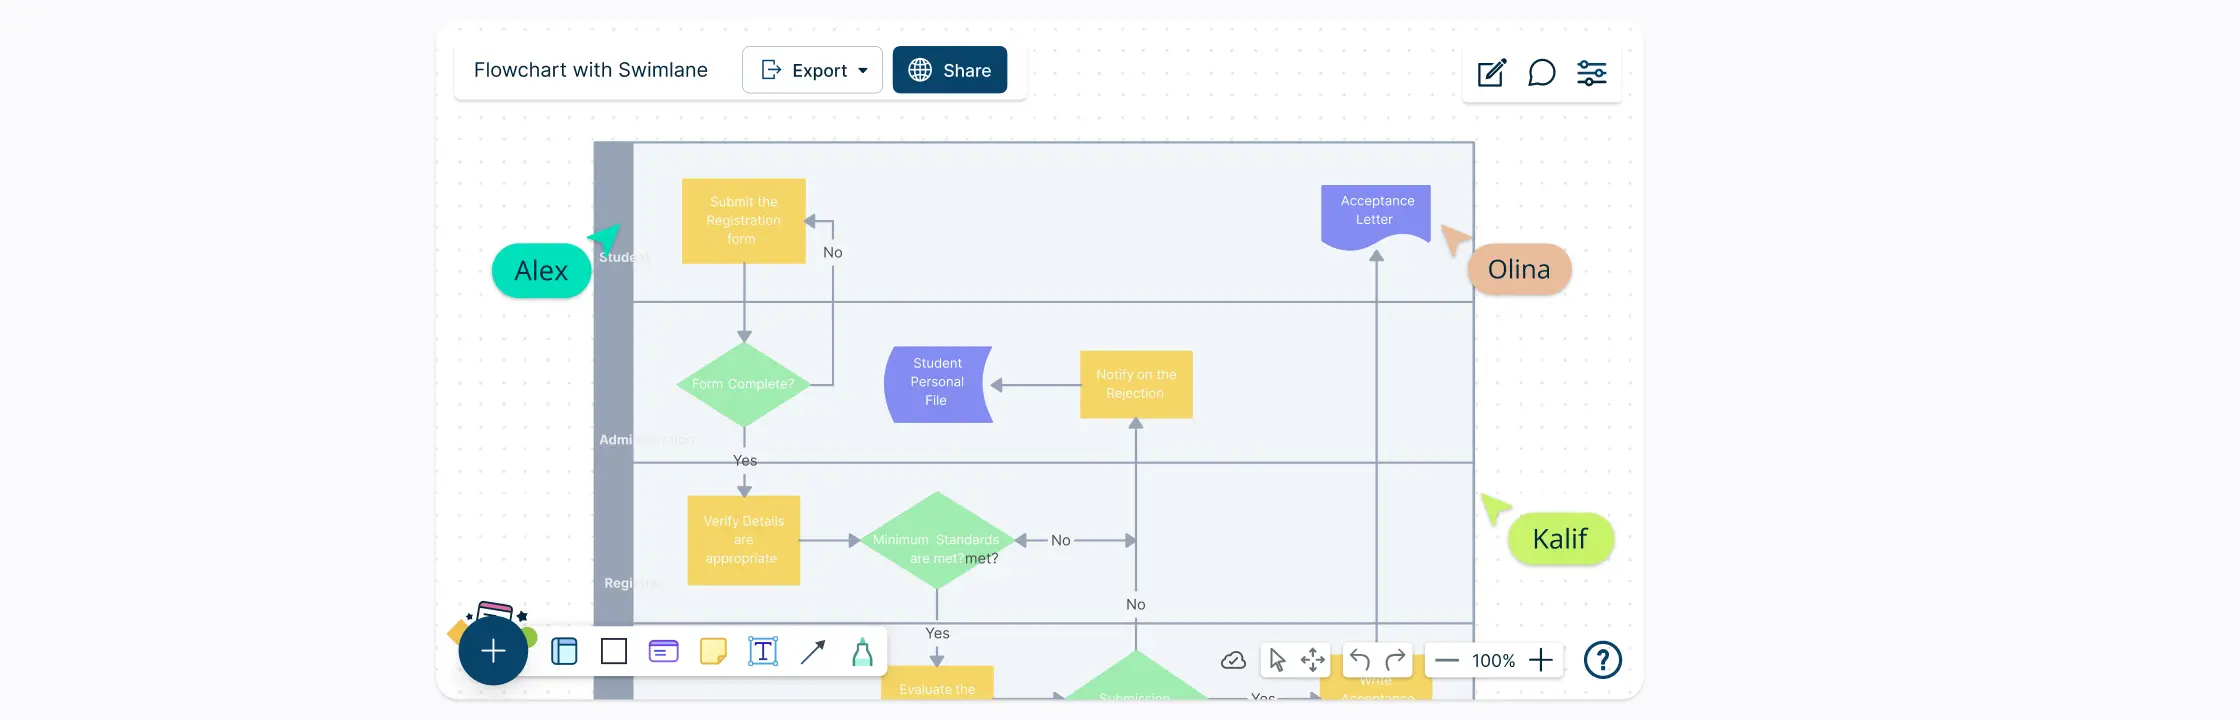
A cross-functional flowchart helps teams visualize not only the steps in a process but also the role, team, or department responsible for each one. By placing activities in swimlanes, it makes ownership and cross-team handoffs easier to see and discuss.
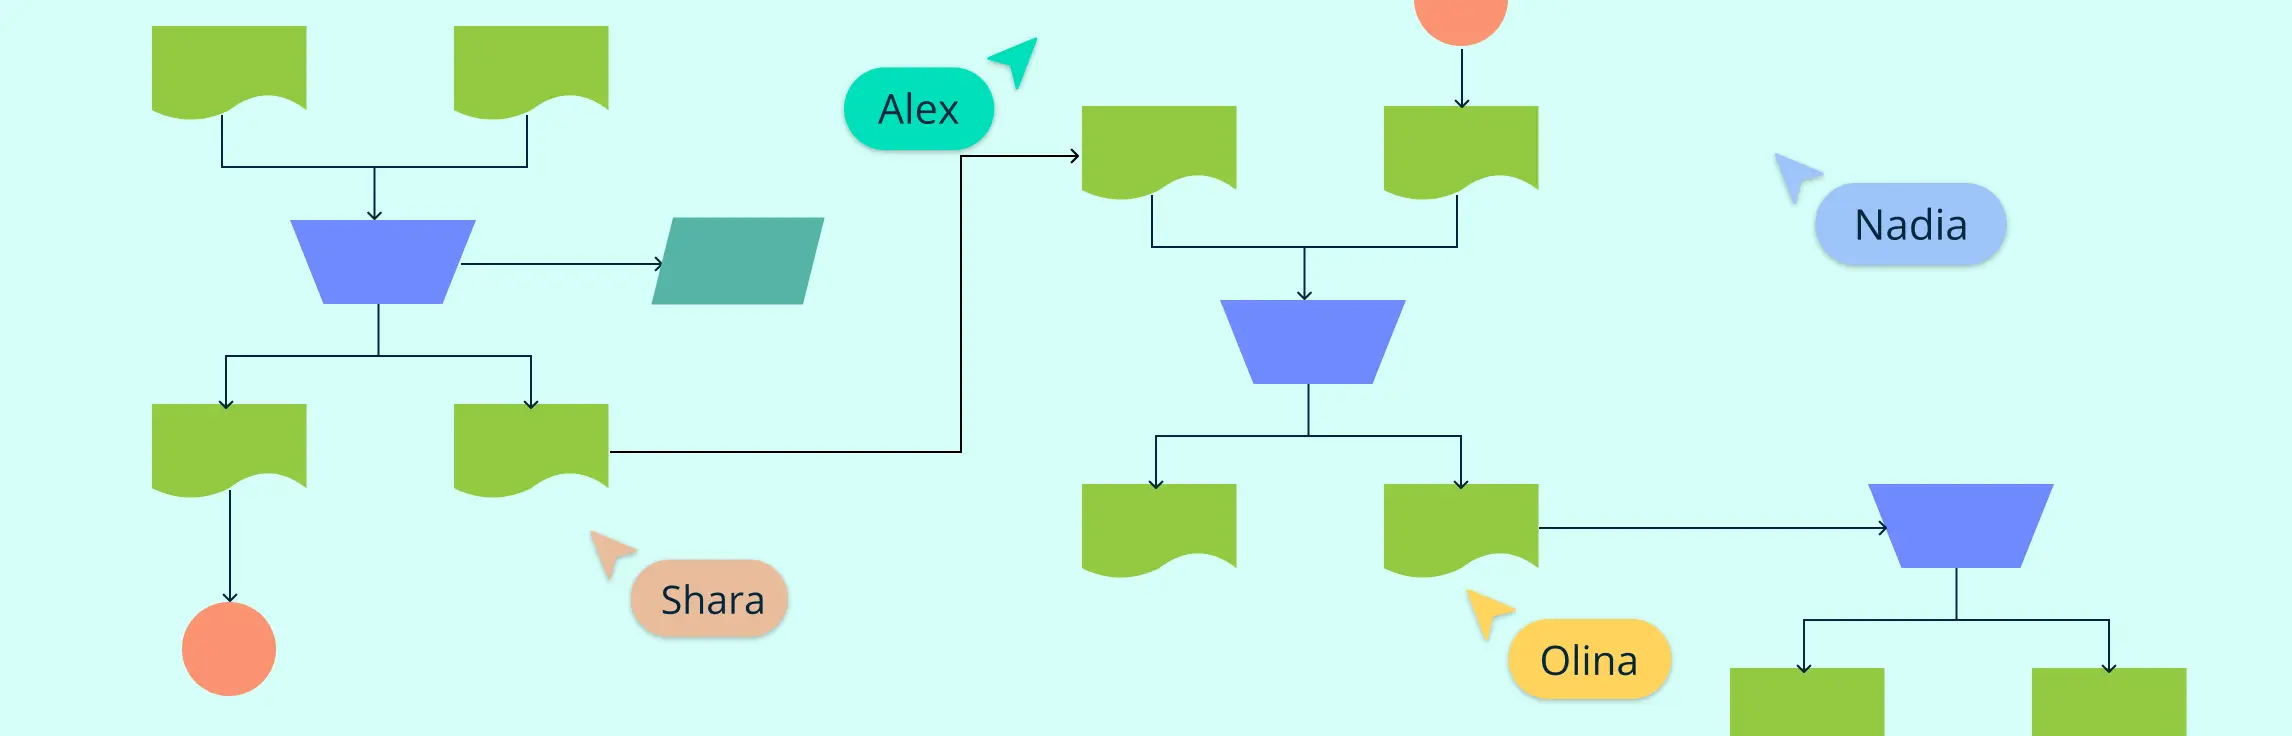
Every day, organizations handle contracts, invoices, reports, forms, and other records. Understanding how those documents move between people, teams, and systems can quickly become complicated. A document flowchart makes that movement visible.
Flowcharts are essential for illustrating processes, workflows, and systems. They simplify complex tasks, highlight inefficiencies, and help communicate ideas effectively. Although Excel is primarily recognized as a spreadsheet tool, it also includes features that enable users to craft clear and structured flowcharts.
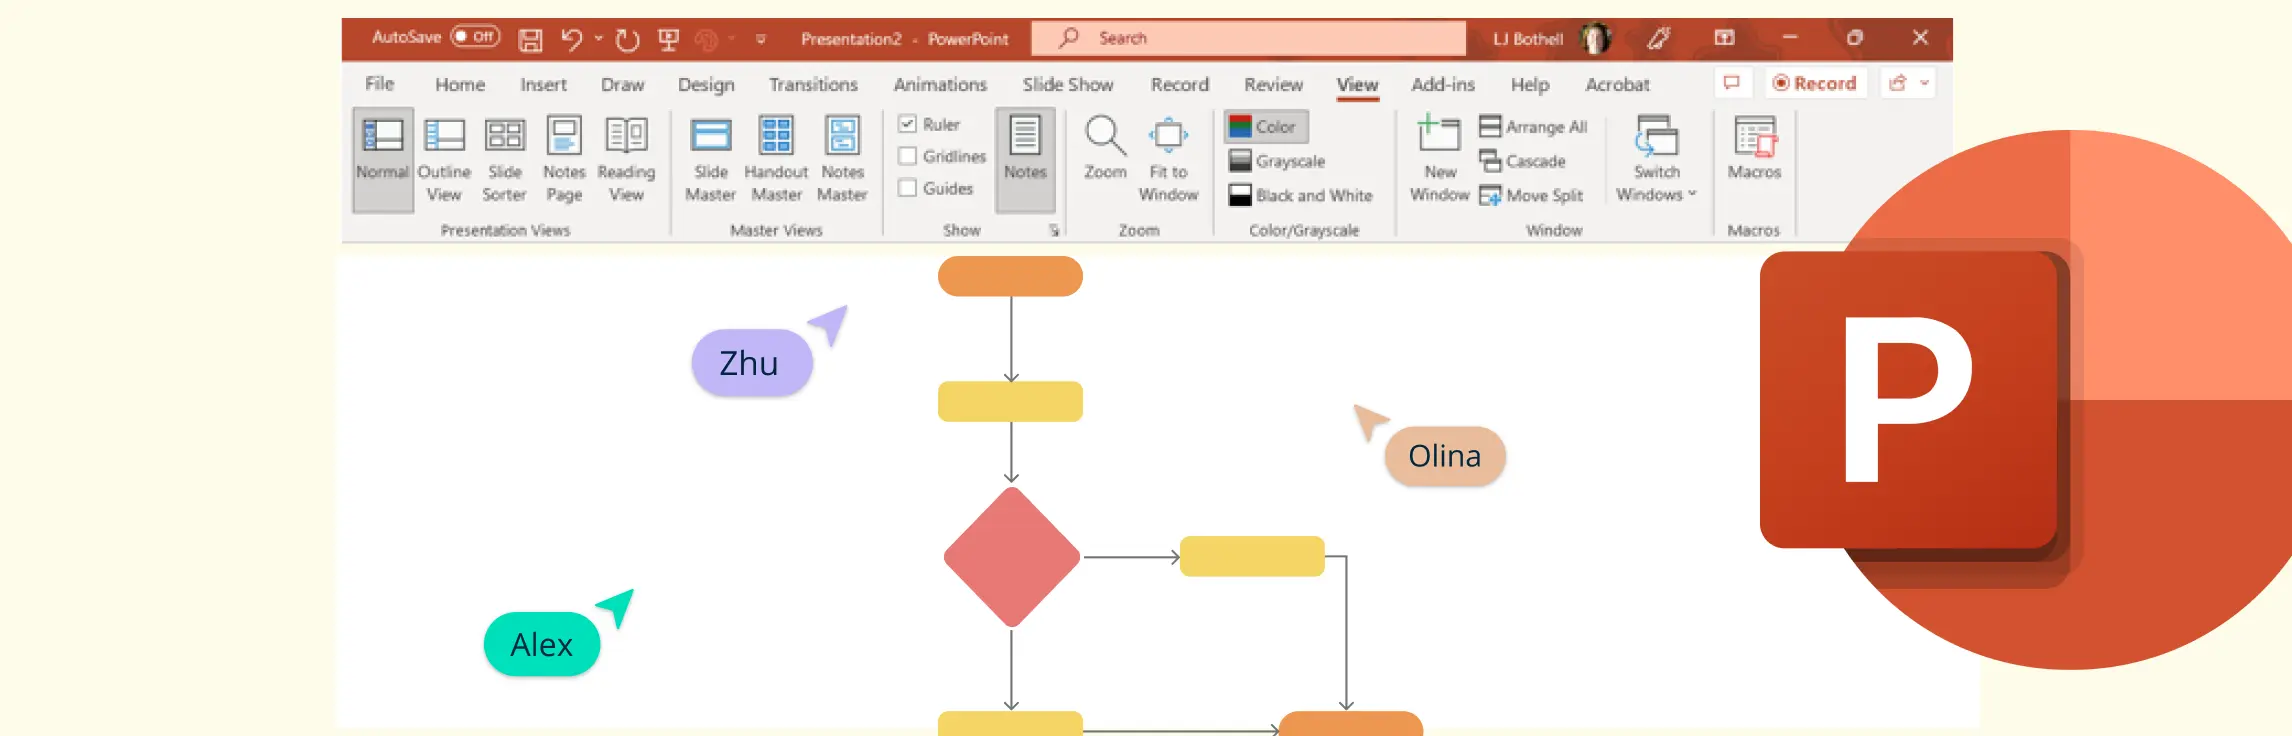
PowerPoint includes shapes, connectors, SmartArt, and formatting tools that can be used to create a basic flowchart directly on a slide. This guide explains two methods for making a flowchart in PowerPoint, along with formatting, sharing, and export tips. It also explains when a dedicated flowchart tool may be more practical for a process diagram that needs ongoing review and maintenance.
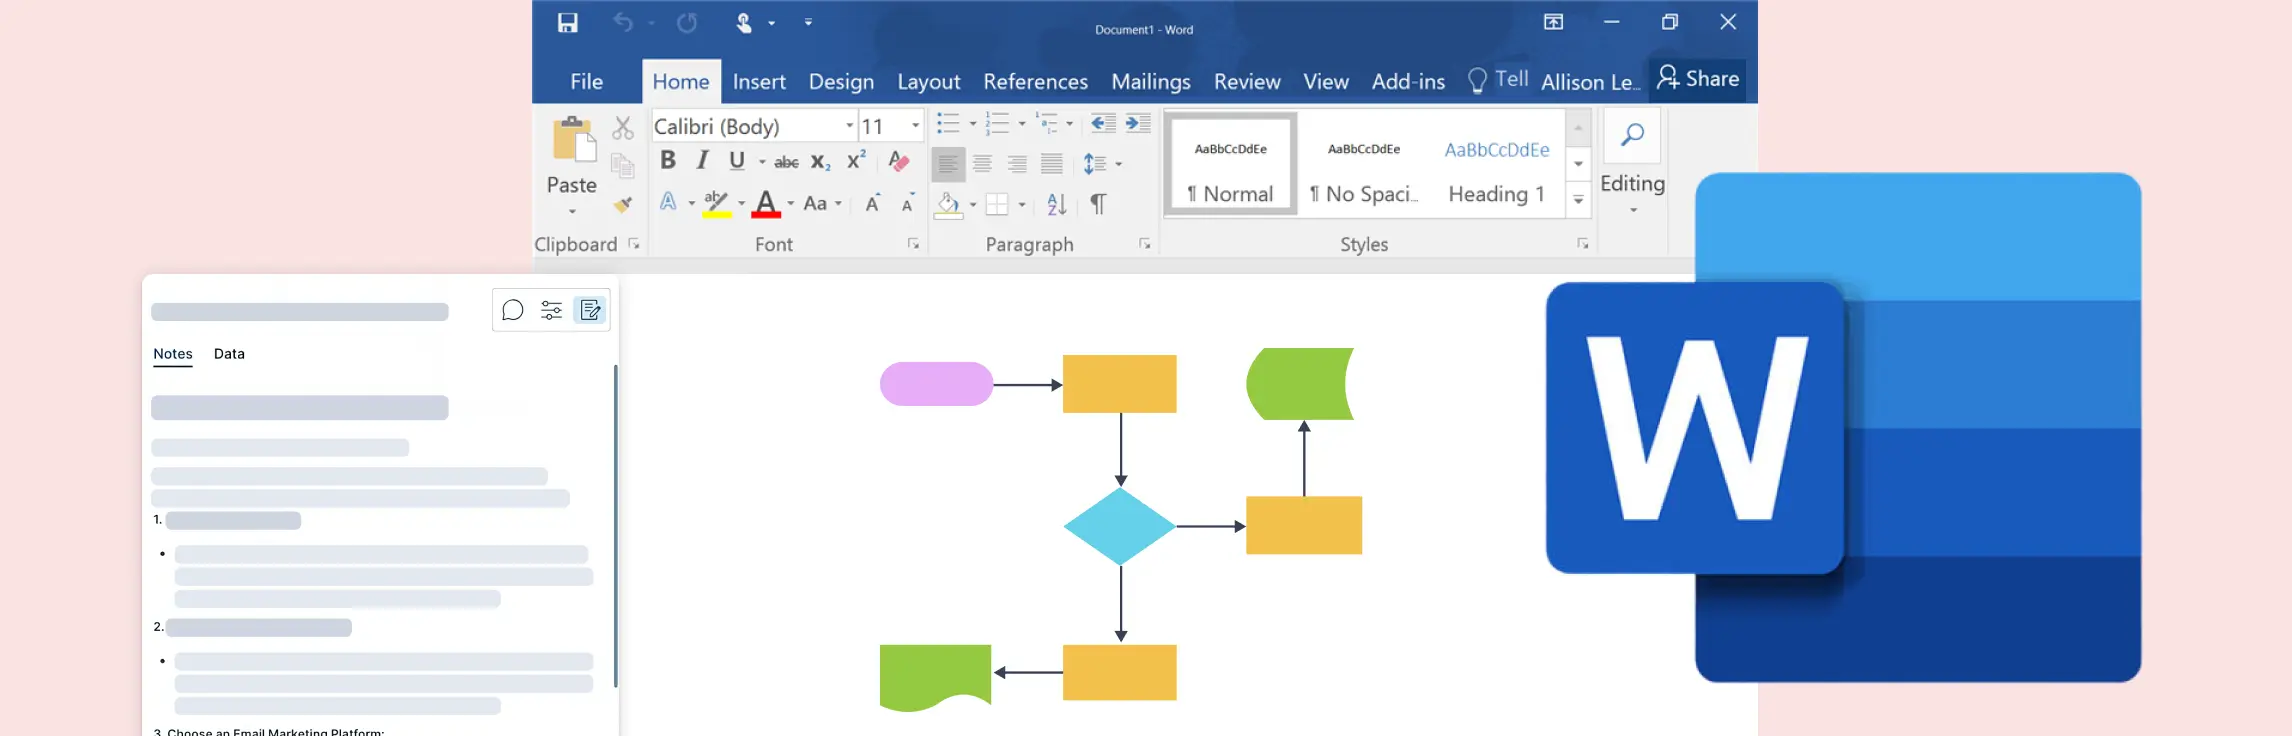
Flowcharts are essential tools for visualizing processes, workflows, and decision-making pathways. While Microsoft Word is primarily used for word processing, it also offers basic features to create flowcharts. This guide will show you how to make a flowchart in Word, covering different methods, tips, and best practices.
A flowchart loop is a fundamental concept in process automation and programming, allowing tasks to repeat based on a defined condition. Whether used in software development, workflow optimization, or decision-making processes, flowchart loops help visualize repetitive actions clearly and efficiently.
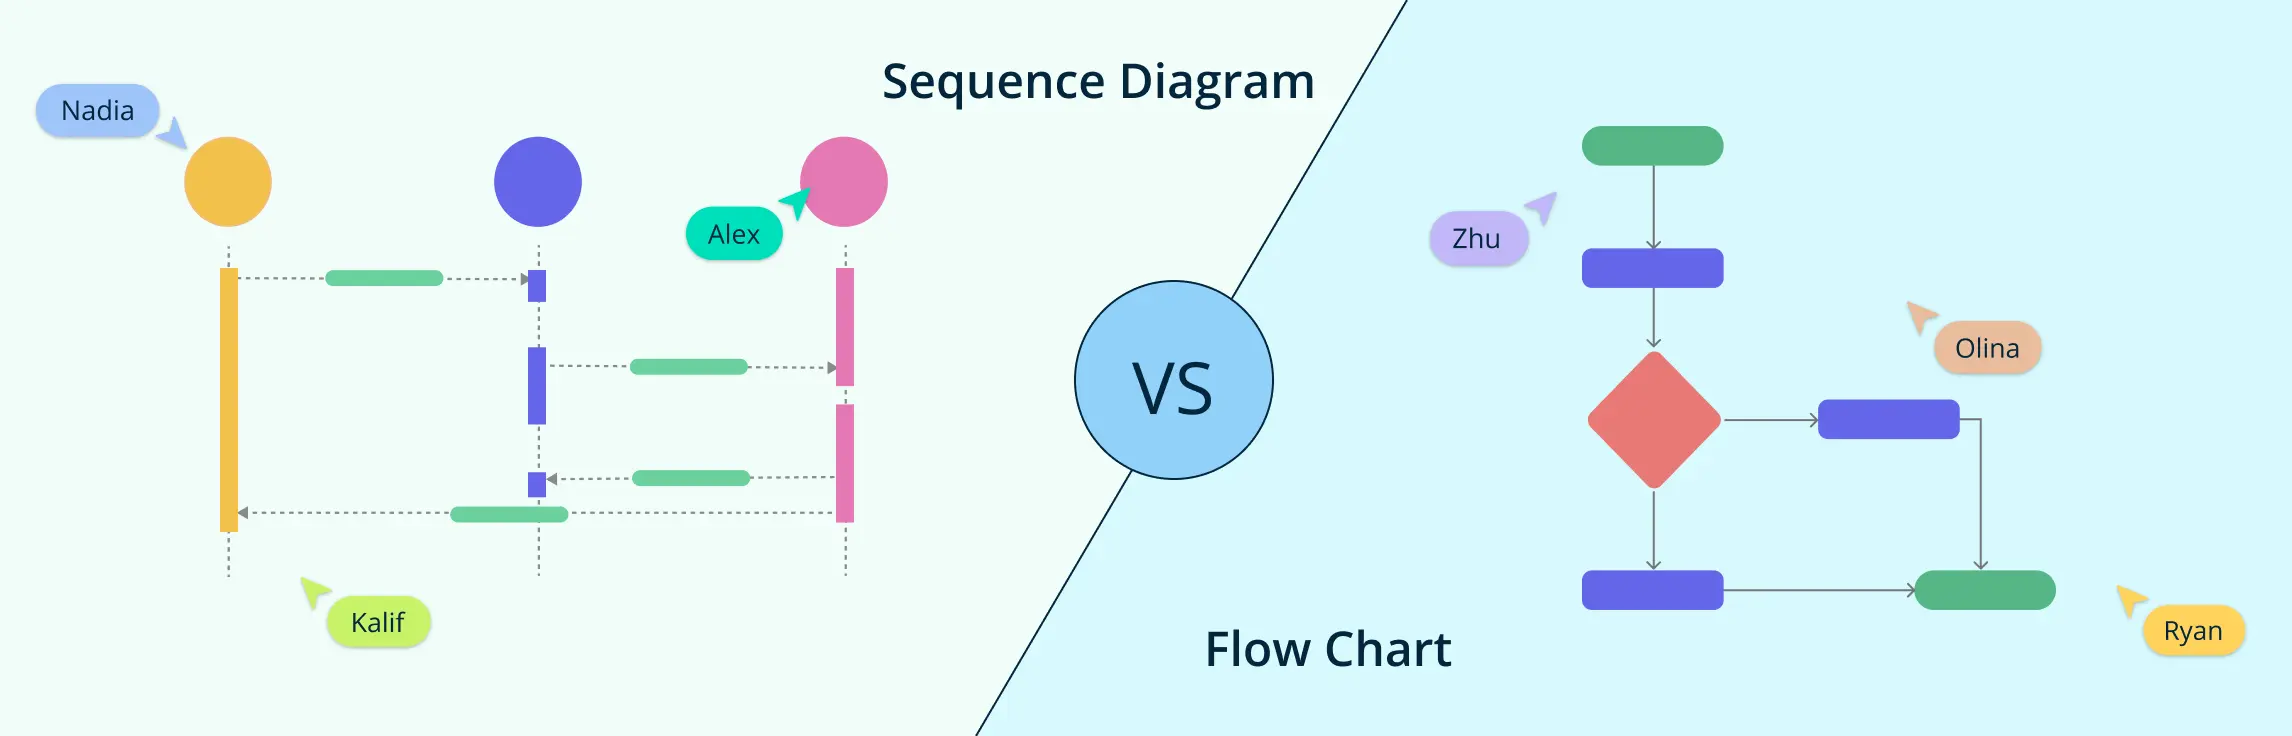
When it comes to visualizing processes and system interactions, two of the most commonly used diagramming methods are flowcharts and sequence diagrams. While both are powerful tools for representing workflows and system behaviors, they serve distinct purposes and follow different structures.
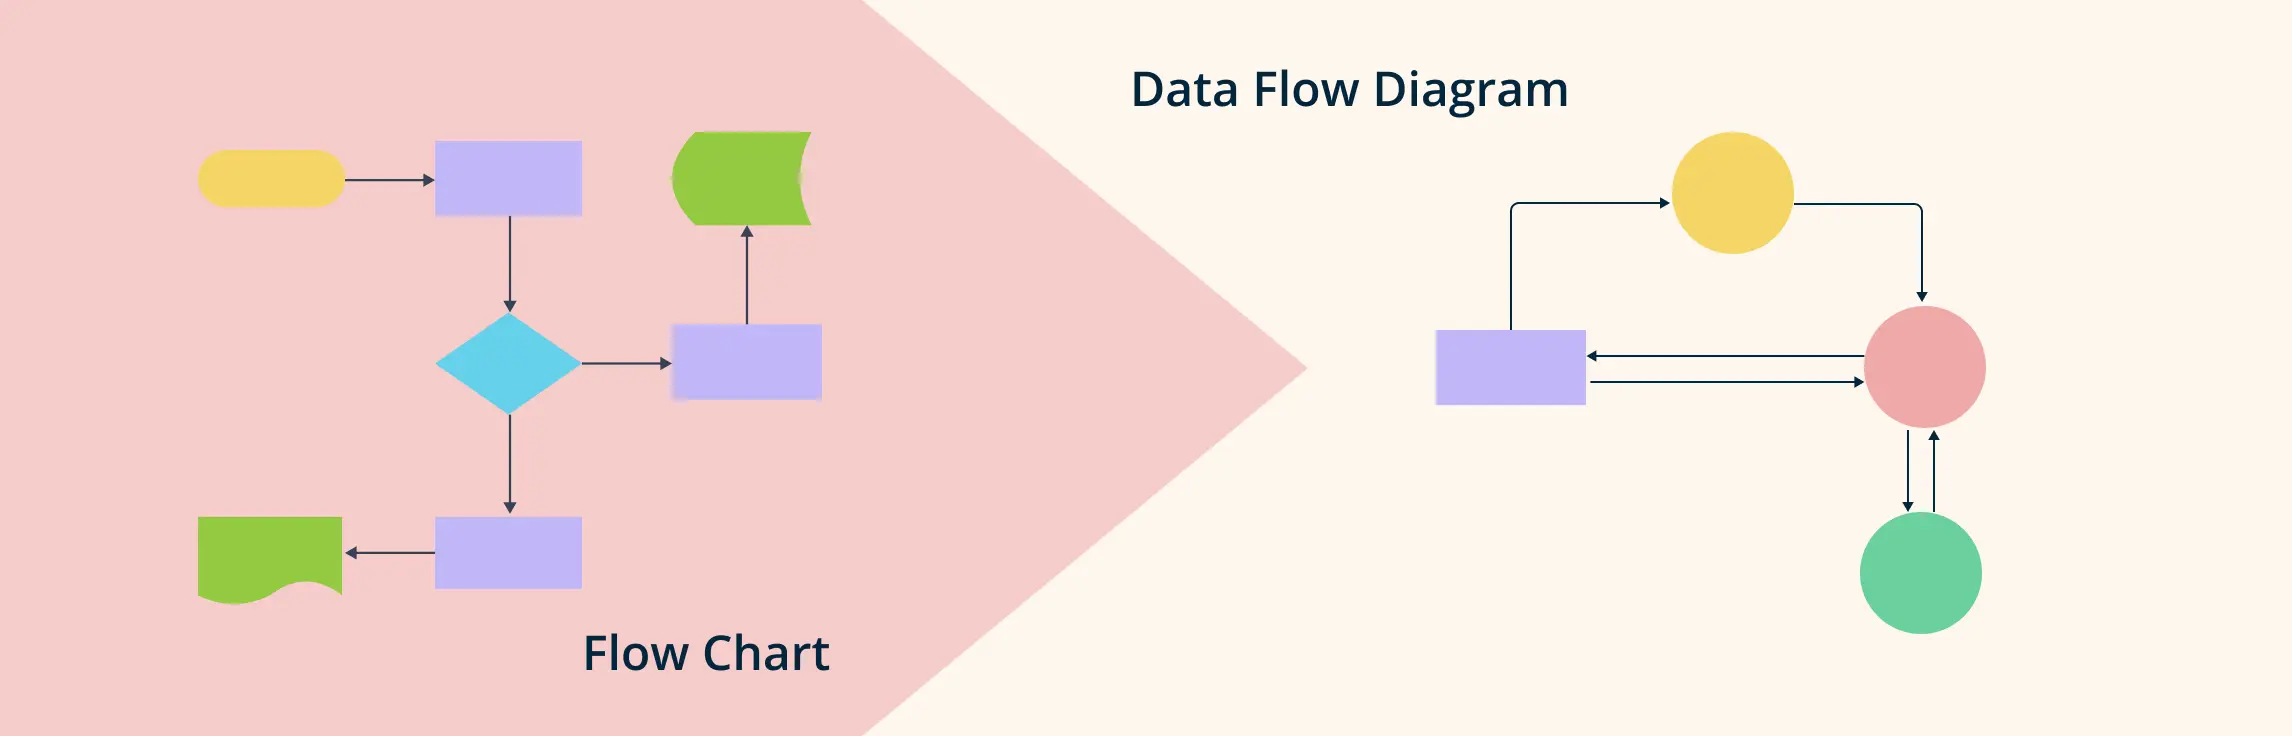
Flowcharts and data flow diagrams (DFDs) visualize different aspects of a system. A flowchart shows the sequence of activities and decisions in a workflow, while a DFD shows how data moves between external entities, processes, and data stores. Choosing the right diagram helps teams answer the right question without mixing operational flow with information flow.
Flowcharts are powerful tools that help visualize processes, systems, and workflows. Whether you’re mapping out a business operation, designing a computer program, or organizing daily tasks, flowcharts make complex ideas easier to understand.
A decision flowchart is a simple yet powerful tool that visually maps out choices and outcomes, making decision-making easier. Whether for work, projects, or daily life, a decision-making flowchart helps clarify options and improve efficiency.
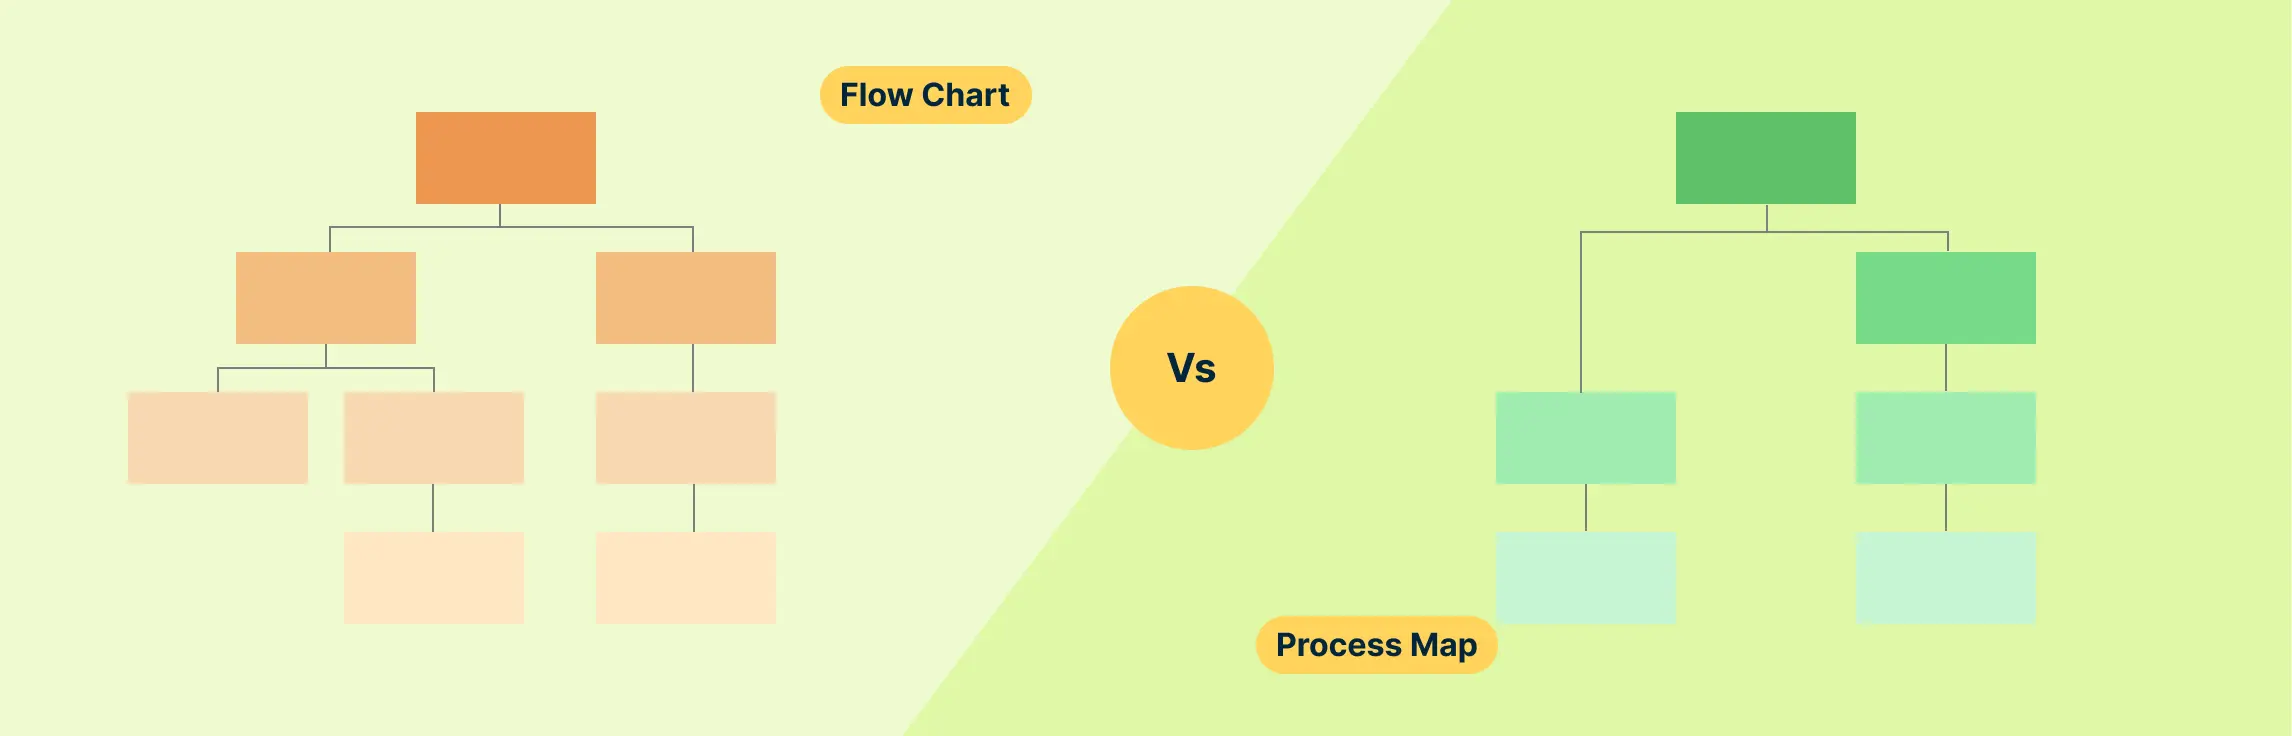
Understanding processes is key to making tasks more efficient and effective, whether you’re managing a project, improving workflows, or solving problems. Two useful tools for visualizing and analyzing processes are flowcharts and process maps. Though they may look similar, each one serves a distinct purpose and works better in different scenarios.
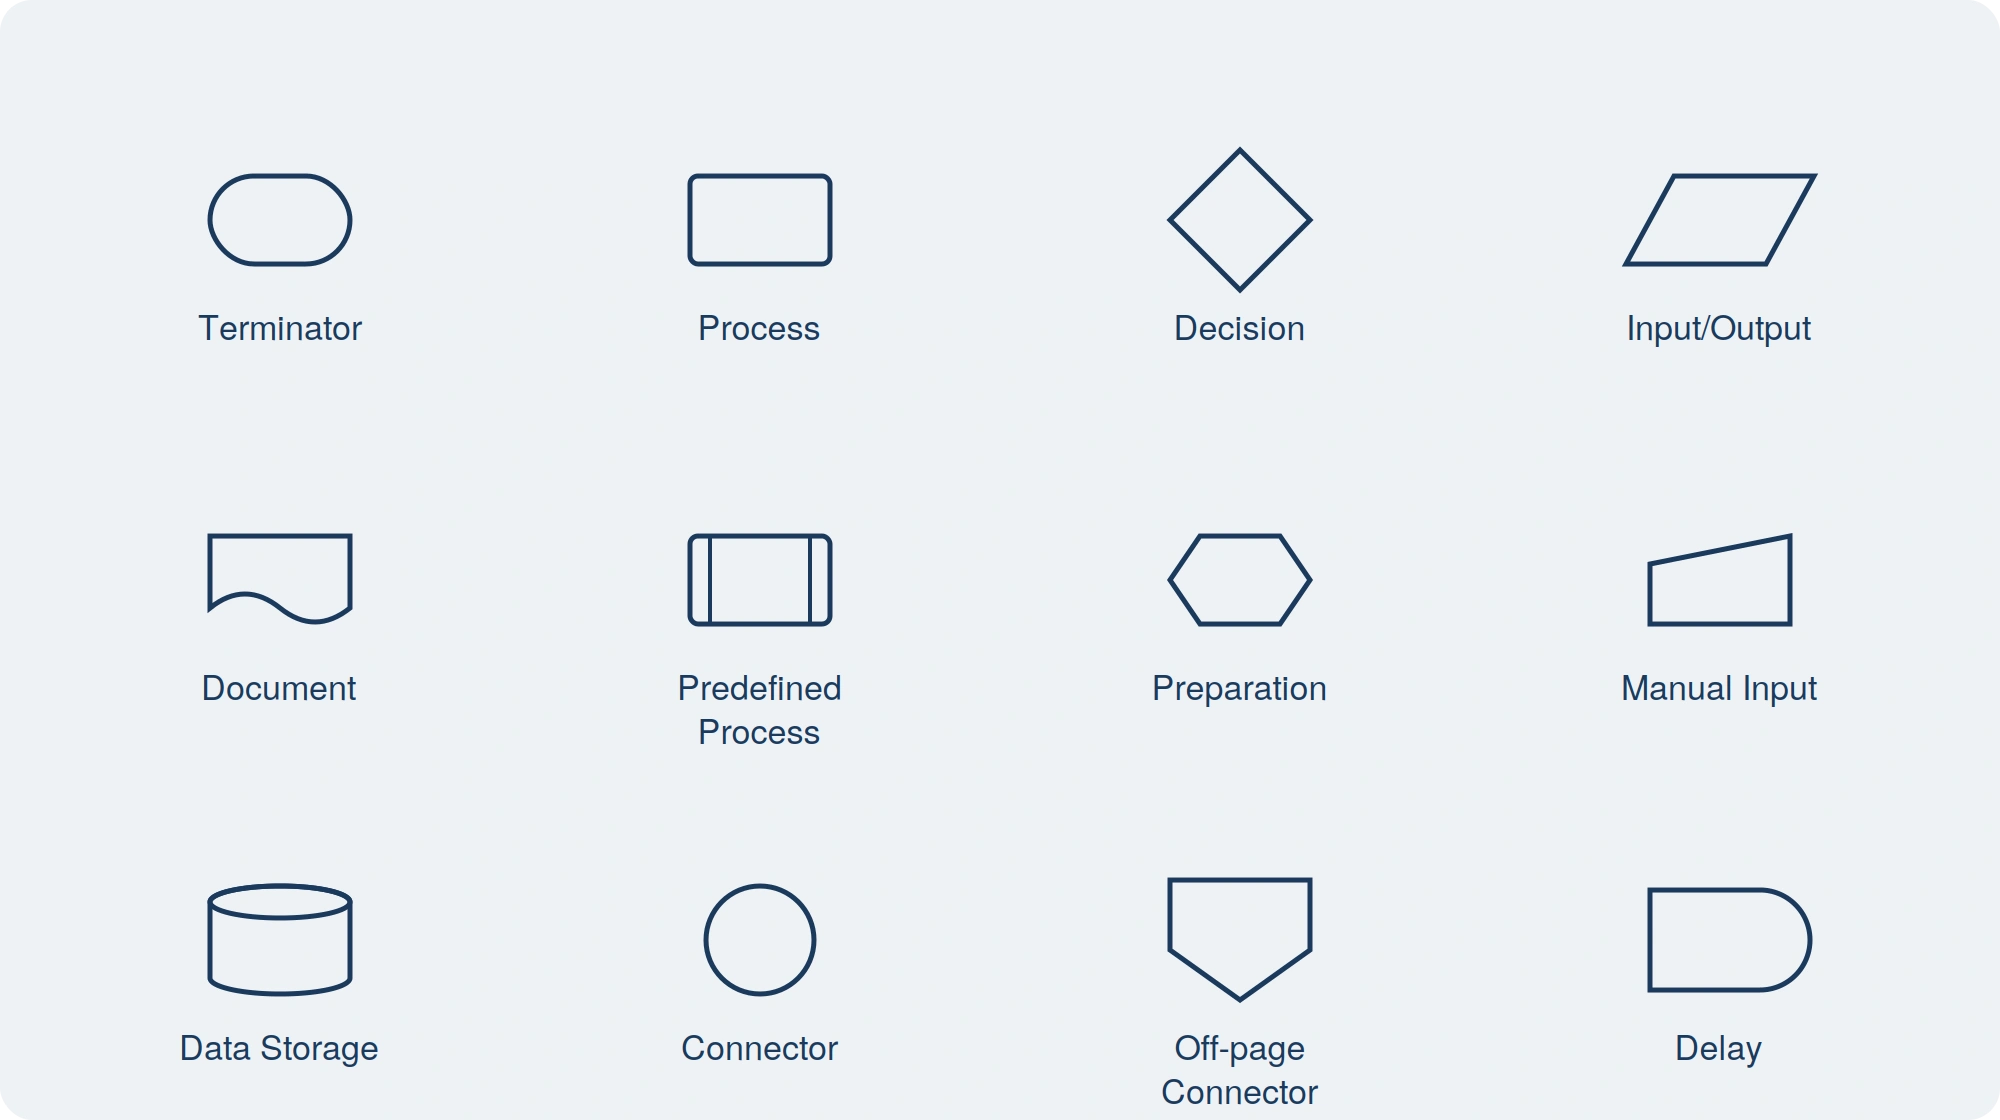
Flowcharts are the go-to tool for process mapping. Whether you are working on a new workflow or solving a problem, flowchart symbols make it easy to visualize steps, decision points, and paths. However, to create a flowchart that clearly communicates your process, you need to know the right flowchart symbols and their usage. This guide will walk you through everything you need to know about flowchart symbols, their meanings, best practices, and common mistakes. Understanding flowchart symbols ensures that your diagrams are effective, structured, and universally understood.
What are cross functional flowcharts Flowcharts are widely popular and one of the most frequently diagram types. They are great for mapping the flow of steps, decisions that need to be made etc in a process.
A sales process flowchart visualizes how opportunities move through sales stages, decisions, activities, and handoffs. It gives teams a shared view of the current workflow so they can investigate bottlenecks, unclear criteria, duplicated effort, and gaps between sales and adjacent teams.
So you want to learn flowcharts? Well, This flowchart tutorial will teach you all you need to know. It will cover the history of flowcharts, flowchart symbols, how to create flowcharts, flowchart best practices and we’ve also included a section to answer frequent questions about flowcharts. Best of all you can use our flowchart software.