


Flowcharts are the go-to tool for process mapping. Whether you are working on a new workflow or solving a problem, flowchart symbols make it easy to visualize steps, decision points, and paths. However, to create a flowchart that clearly communicates your process, you need to know the right flowchart symbols and their usage. This guide will walk you through everything you need to know about flowchart symbols, their meanings, best practices, and common mistakes. Understanding flowchart symbols ensures that your diagrams are effective, structured, and universally understood.
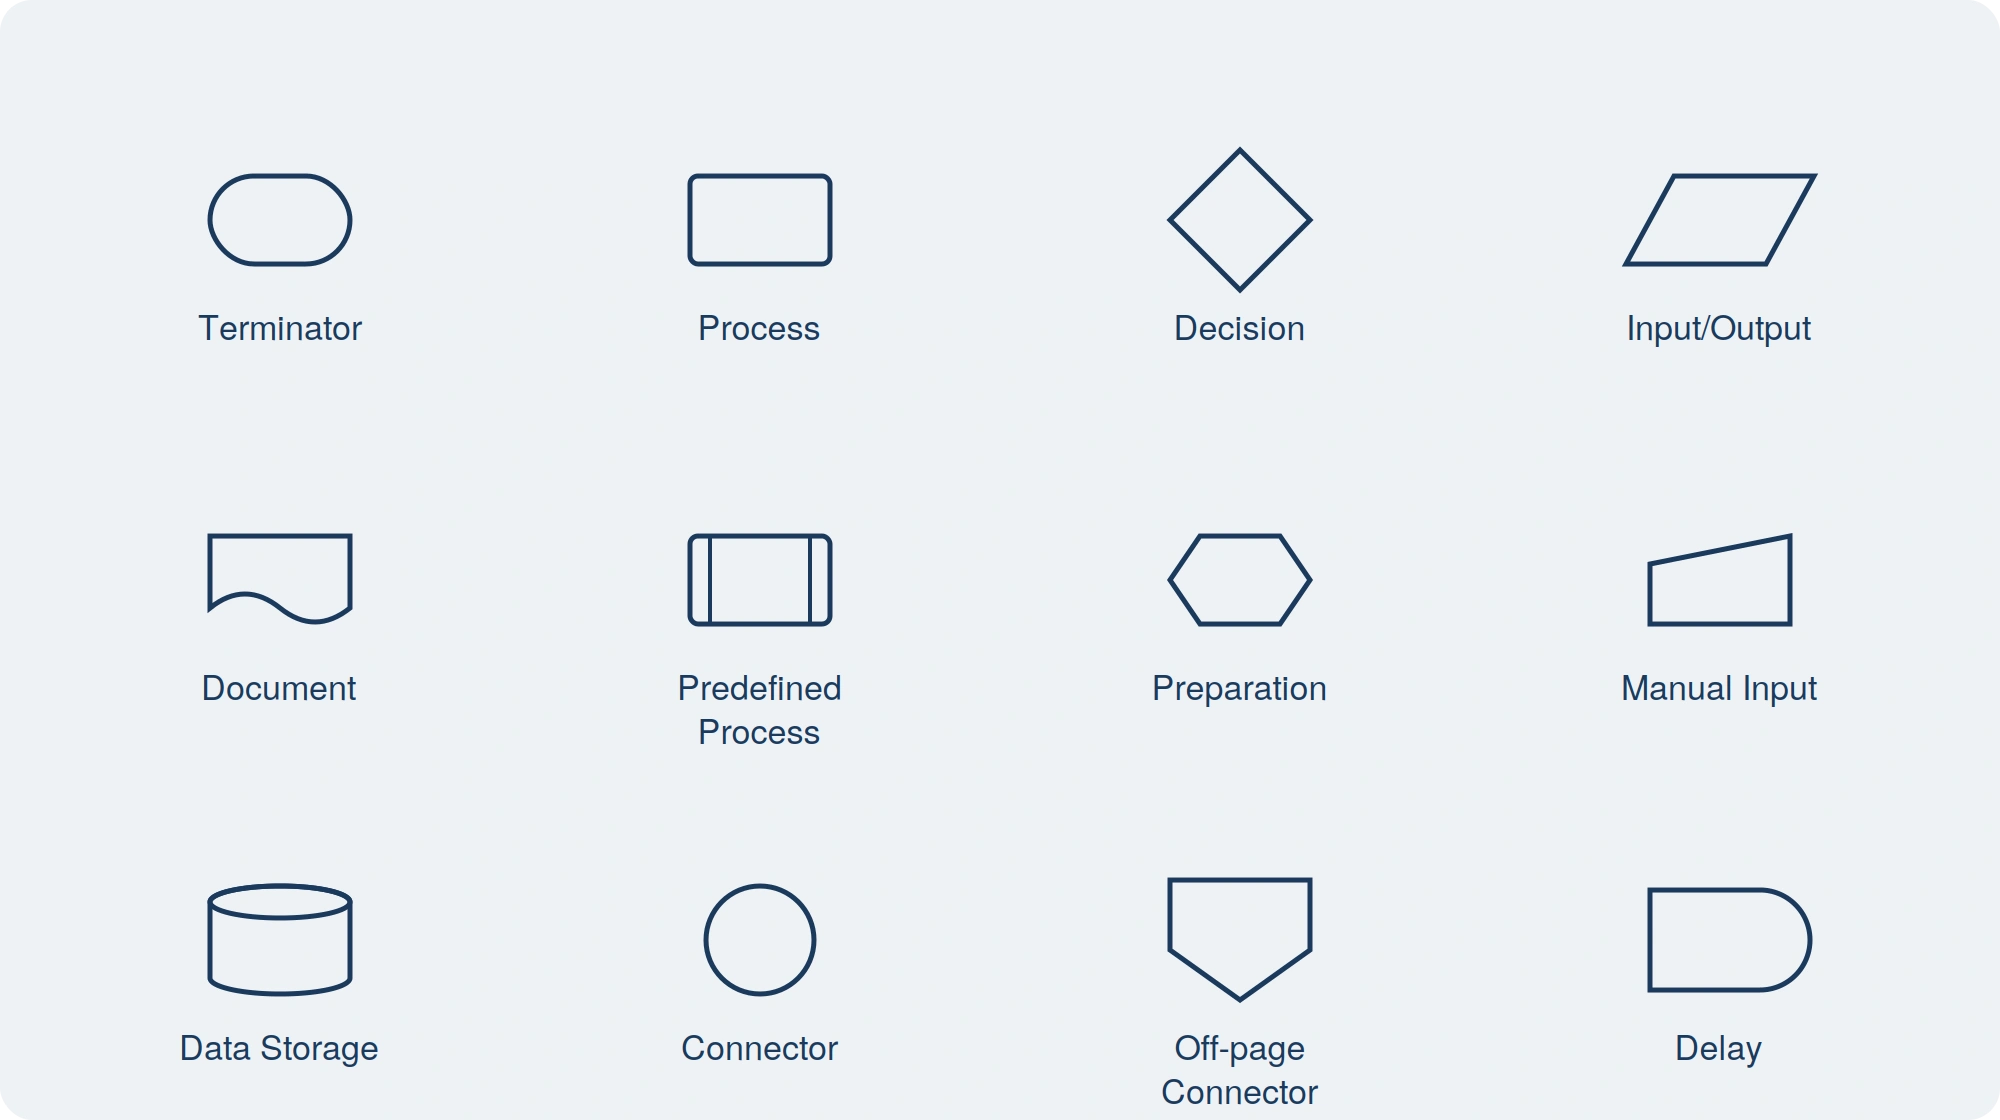
All Flowchart Symbols at a Glance
Use this quick reference when you need to choose the right flowchart symbol without scrolling through the full guide.
| Symbol | Meaning | Common use |
|---|---|---|
| Terminator | Start or end point | Mark where a process begins or finishes |
| Process | Action or task | Show a step such as “Review request” or “Send invoice” |
| Decision | Choice or condition | Branch the flow with yes/no or true/false outcomes |
| Flowline | Direction of flow | Connect symbols in the order steps happen |
| Input/Output | Data entering or leaving | Capture form entries, reports, or displayed results |
| On-page connector | Same-page jump | Continue a flow without crossing lines |
| Off-page connector | Link to another page | Continue a large flowchart on another page |
| Document | Single document | Show a report, form, receipt, or file |
| Multiple documents | Several documents | Represent a packet of forms or grouped files |
| Predefined process | Reusable subprocess | Reference a process defined elsewhere |
| Preparation | Setup step | Show initialization, configuration, or preparation |
| Manual input | User-entered data | Capture keyboard input or manual entry |
| Manual operation | Human-performed task | Show a step that is not automated |
| Database | Stored data | Represent a database or structured data store |
| Data storage | Saved information | Show stored files, archives, or records |
| Delay | Waiting period | Mark a pause, queue, or time delay |
| Display | Screen output | Show information presented to a user |
| Annotation | Explanatory note | Add context without changing the flow |
What Are Flowchart Symbols?
The flowchart symbols are specific shapes used to represent particular tasks in a process. Each of these symbols on a flowchart denotes a certain action, decision, result, or outcome, making it easier to visually map out workflows. Flowchart symbols help users quickly interpret and navigate through the process, no matter how simple or complex. Each symbol has a designated role in illustrating how steps are connected, where decisions need to be made, and how data or tasks flow from one point to another. These symbols are standardized making it easier for everyone to understand the flowchart.
One of the key features of flowchart symbols is their standardization, ensuring consistency and understanding across various industries and professions. The current symbols follow the ISO 5870, the international standard for process mapping and documentation. This allows clear communication, minimizing misunderstandings, and inconsistent or unclear visual representations.
Moreover, flowchart symbols enable teams to collaborate effectively, especially in fields like software development, engineering, and business process management. An effective flowchart helps teams identify bottlenecks, optimize workflows, and guide others by providing a visual breakdown of each step in a process.
The 4 Basic Flowchart Symbols You Need to Know in detail.
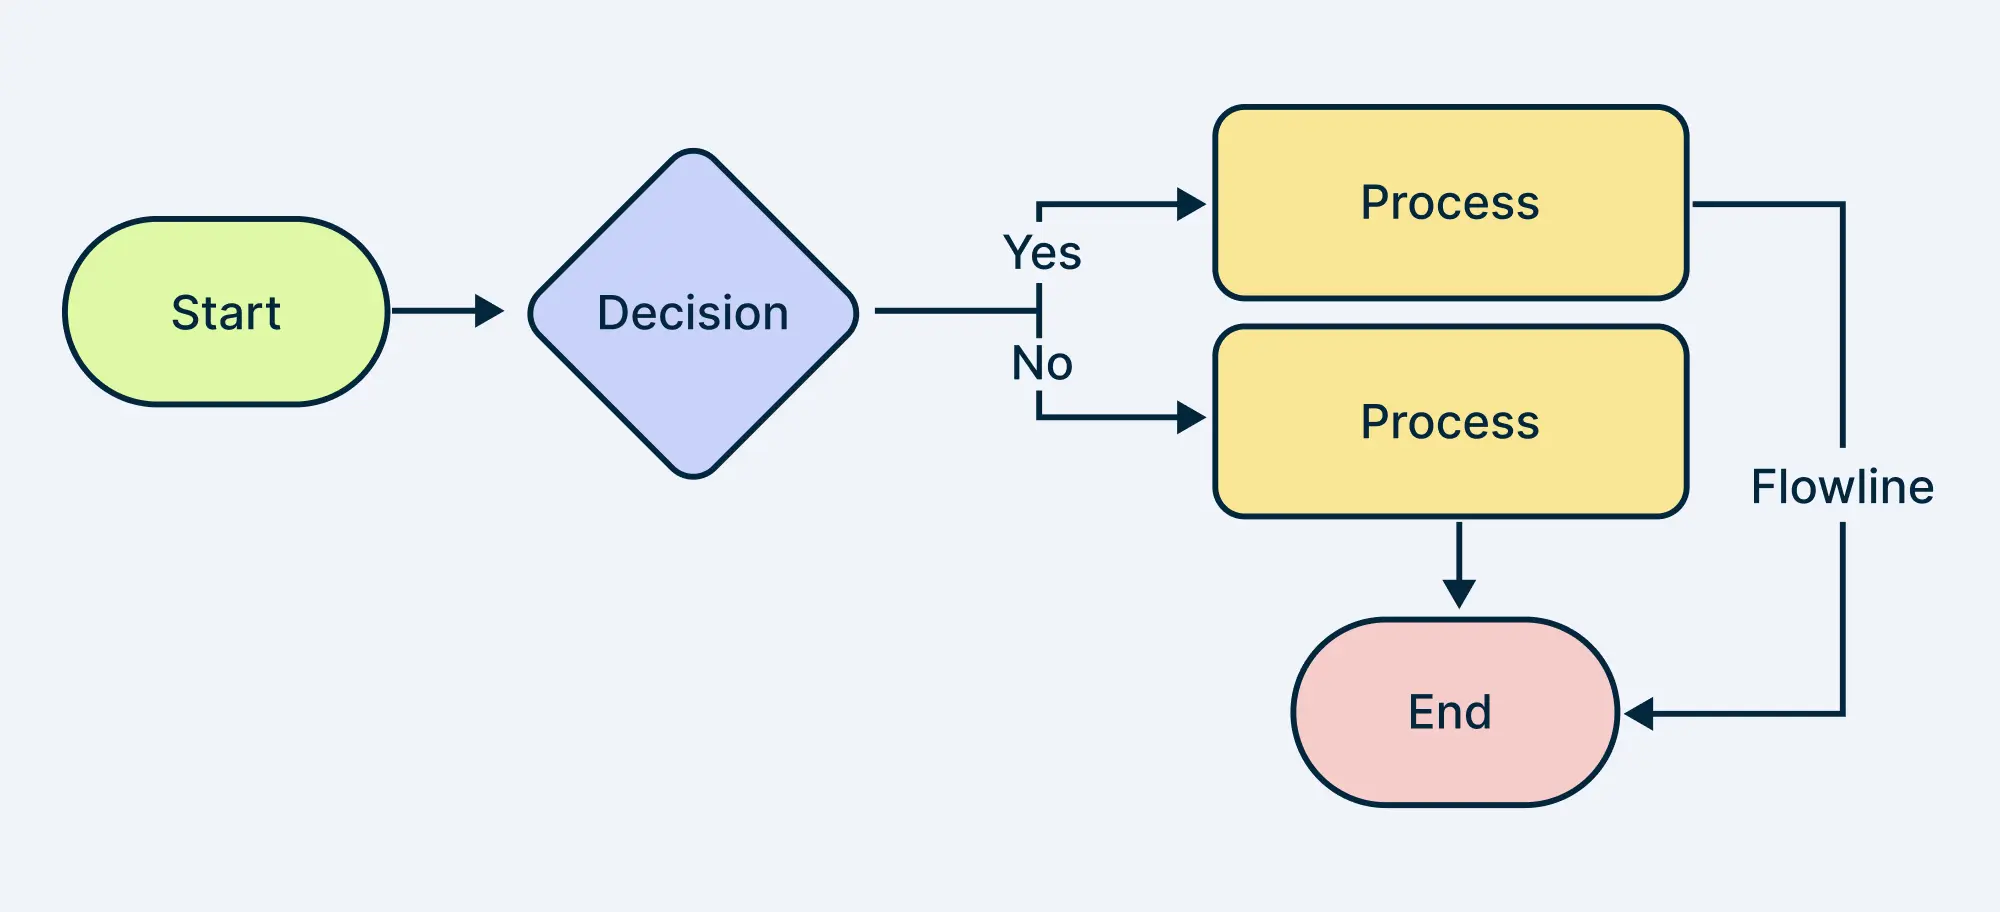
There are many flowchart symbols. However, there are four basic flowchart symbols most commonly used in creating workflows. They can even be called the building blocks of flowcharts.
| Symbol | Description | Best Practices | Common Mistakes |
| The Start/End symbol, also known as the terminator, marks the beginning or the end of a process. It is commonly shaped like an oval or a rounded rectangle. The terminator symbol is where everything starts and where it all concludes. Think of it as the bookends of the flowchart. Usually, terms like ‘Start’, ‘Begin’, and ‘End’ are used to make the process clearer. | Placement: Always place the start symbol at the top or far left of the flowchart and the end symbol at the bottom or far right. Clarity: Make sure it’s clear what starts and ends the process. Use simple, direct language, such as “Start Project” or “End Process.” | Multiple Start/End Points: Unless absolutely necessary, try to avoid having multiple ‘start’ or ‘end’ points, as this can confuse the flow of the chart. Vague Descriptions: Be specific. ‘Start’ and ‘End’ alone might not be clear enough. Include what’s starting or ending. |
| Arrows or flowlines show the order of operation from one symbol pointing to another. They indicate the direction of flow within the process. Generally, the line of the arrow is solid but a dotted line can be used to show an alternate path or connections between different points on the flowchart. The function of the dotted arrow may vary depending on the usage and can be defined in the flowchart legend. | Directional Clarity: Ensure arrows indicate the direction of the flow clearly. Typically, processes flow from top to bottom or left to right. Avoid Crossed Lines: Keep your arrows neat and avoid crossing lines as much as possible. If your flowchart becomes too complex, consider using connectors or breaking it down into sub-processes. | Inconsistent Flow: Ensure that your arrows consistently point in the same direction to avoid confusion. For instance, if your flowchart primarily flows left to right, don’t randomly introduce a bottom-to-top arrow. Overuse of Arrows: Too many arrows can make your flowchart look cluttered. If necessary, simplify the chart by using connectors or re-evaluating the process flow. |
| The rectangular process symbol, also called the action symbol, is the heart of flowcharting. It represents a process, operation, action step, or task that needs to be completed as part of the overall workflow. It is one of the most widely used flowchart symbols. | Detail: Provide enough detail within the rectangle to understand what’s being done, but avoid overwhelming it with too much information. Consistent Language: Keep the language and wording consistent. If you start with action verbs, stick with them throughout the flowchart. | Overloading with Detail: While it’s important to be clear, too much detail in a single process box can clutter the chart. Break down complex steps into smaller, more manageable processes if necessary. Skipping Steps: Ensure every step in your process is accounted for. Missing steps can lead to confusion and errors when others follow your flowchart. |
| The diamond represents a decision point in the process. It’s where the flowchart branches based on a Yes/No or True/False question. Each decision leads to different outcomes or paths. They are denoted by two flow lines, usually coming out from the bottom and the right points of the diamond. | Clear Questions: Make sure the question within the diamond is clear and can only be answered with a yes/no or true/false. Avoid ambiguity. Balanced Branches: Ensure each branch of the decision leads to a clear and logical next step. Avoid dead ends unless that’s a natural part of the process. | Multiple Outcomes: Avoid using a decision diamond for choices that have more than two outcomes. If you need to accommodate more options, consider breaking it down into multiple decision points. Vague Outcomes: Clearly define what happens after each decision. Vague or unclear outcomes can lead to misunderstandings and errors. |
Common Flowchart Symbols and Their Meanings
Basic Flowchart Symbols
There are other flowchart symbols commonly used to denote various functions in a process or a workflow.
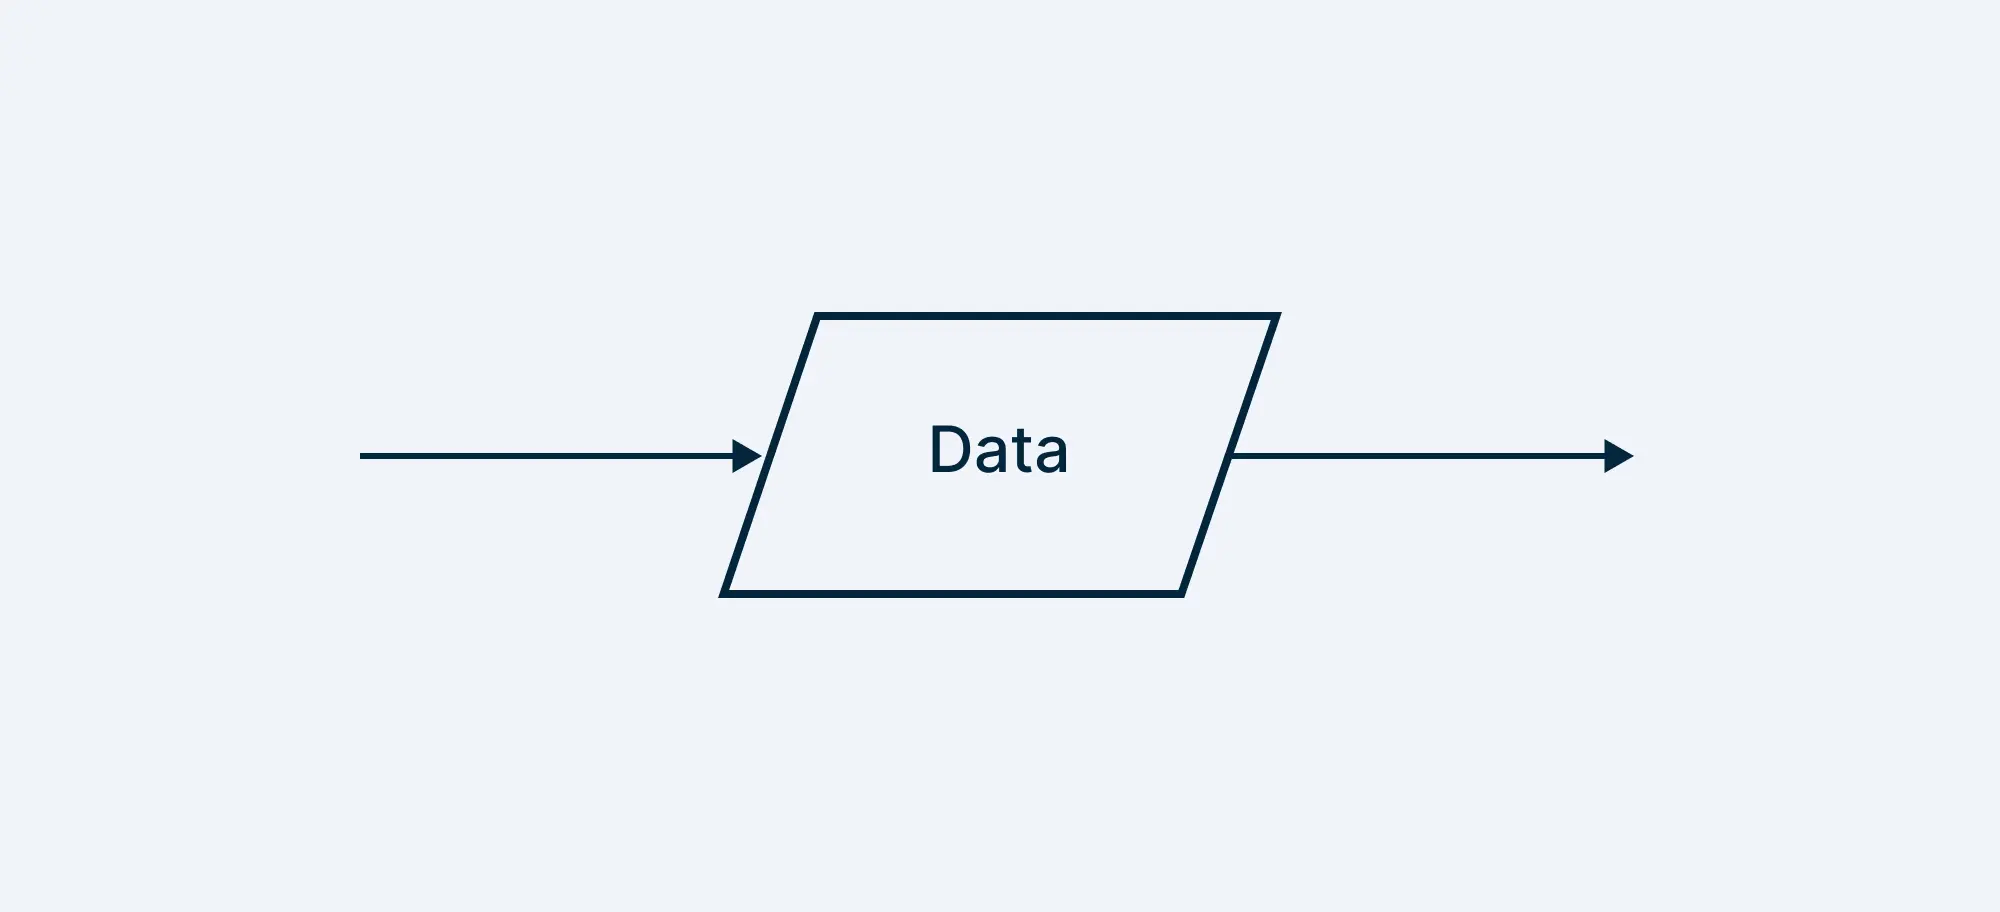
5. Input/Output (Parallelogram) Symbol
The parallelogram is used to represent input or output operations. This is where data is entered into or received from a process. An example might be “Input: Customer Order” when starting a process to fulfill an order, or “Output: Confirmation Email” after processing that order.
Best Practices:
Specificity: Indicate clearly what data is being input or output. Instead of “Enter Data,” specify, “Enter Customer Information.”
Separate Input and Output: If your process involves both input and output, use separate symbols for clarity. For instance, “Input: Order Details” and “Output: Receipt.”
Common Mistakes:
Combining Input/Output in One Symbol: Avoid combining both input and output operations in one parallelogram. This can confuse the flow of information.
Overlooking Important Data: Ensure that all necessary inputs and outputs are captured in your flowchart. Missing these can disrupt the process.
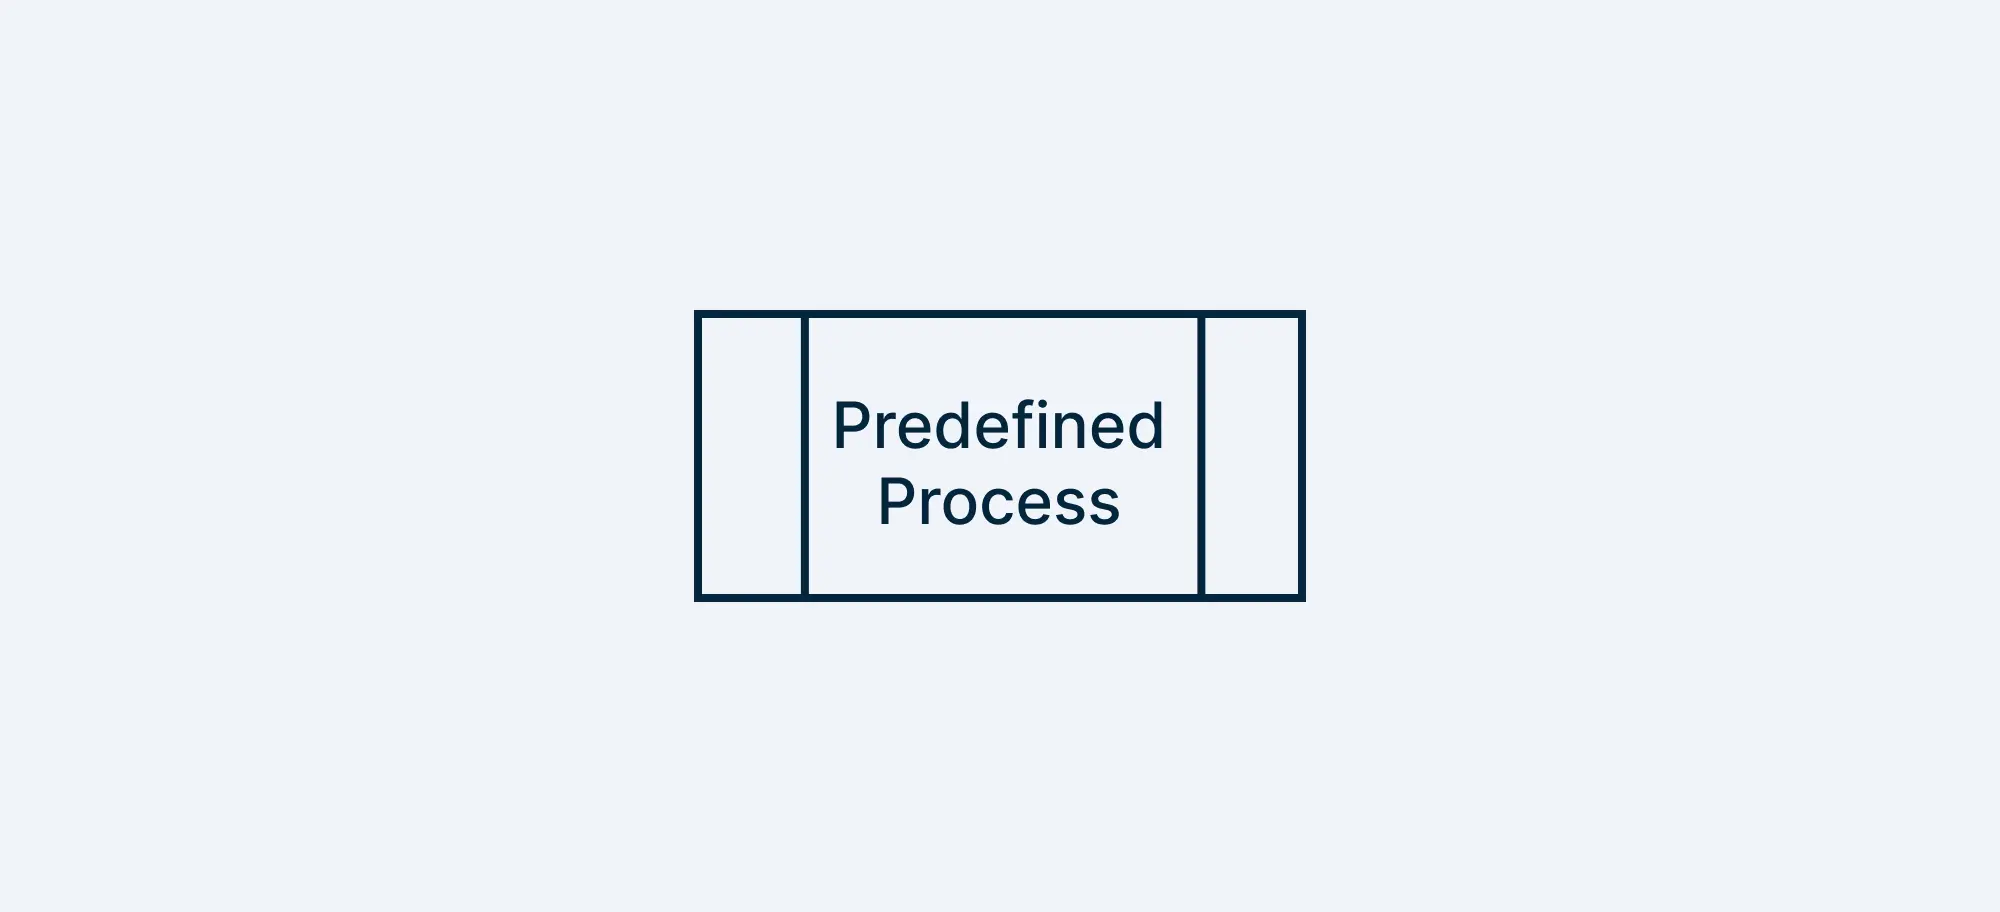
6. Predefined Process/ Subroutine
The predefined process symbol is used when a specific process within your flowchart is detailed enough to be its own flowchart. This flowchart is already drawn and you can reference it for more information. It indicates that there is more going on within that step than meets the eye.
Best Practices:
Link to Detailed Process: If the subprocess is complex, consider creating a separate flowchart for it and referencing it within your main flowchart.
Use When Necessary: Don’t overuse subprocess symbols. Reserve them for parts of the process that are genuinely detailed enough to warrant a separate breakdown.
Common Mistakes:
Lack of Clarity: Ensure that the subprocess is linked to its detailed process, either within the same flowchart or as a separate diagram.
Overuse: Over-relying on subprocess symbols can make your flowchart unnecessarily complex. Use them only when a step needs further breakdown.
7. Document/ Documents Symbol
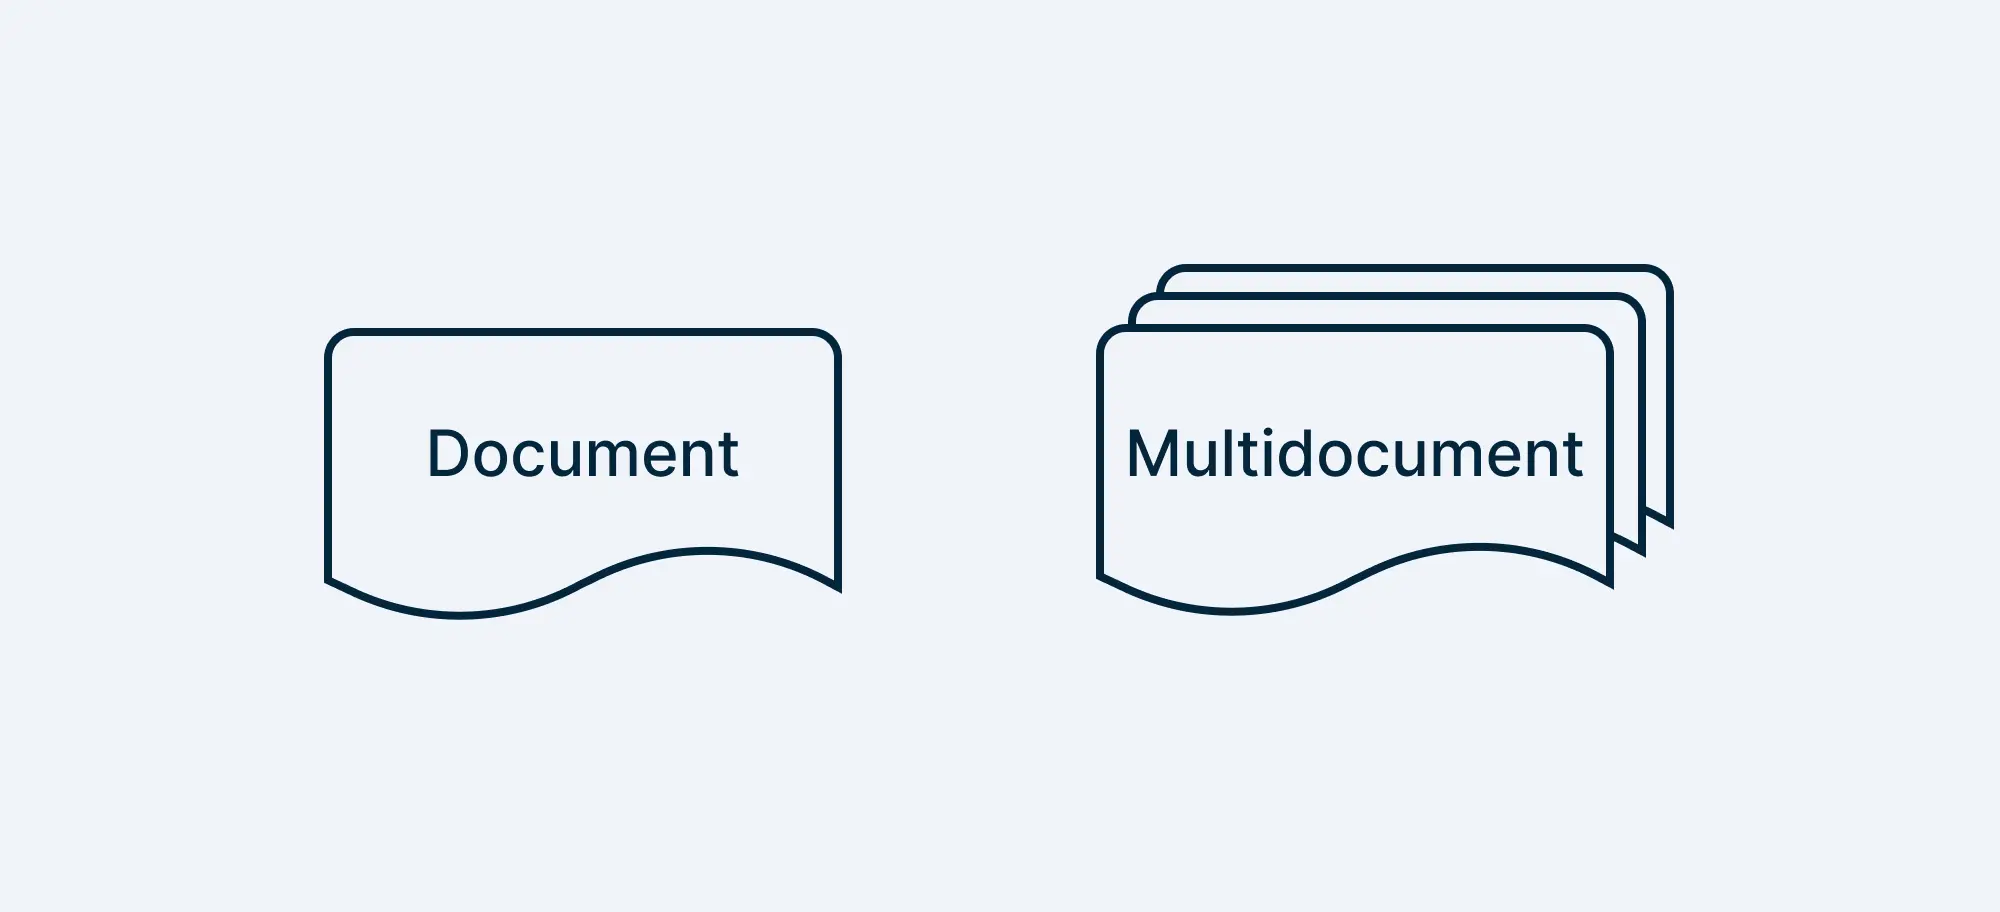
The document symbol looks like a piece of paper with a wavy base and represents any document involved in the process. This could be a physical paper document or a digital file.
For example, in a flowchart for processing a loan application, a document symbol might represent the “Loan Agreement” that needs to be reviewed and signed.
Best Practices:
Specify Document Type: Clearly state what document is being referenced. Instead of just “Document,” use “Customer Invoice” or “Contract Agreement.”
Indicate Actions on Documents: If an action needs to be taken on the document (like reviewing, signing, or filing), include that information within or near the symbol.
Common Mistakes:
Ambiguous Documents: Avoid using this symbol for generic document references. Be specific about what the document is and its role in the process.
Forgetting Document Flow: Make sure to connect document symbols with arrows to indicate how the document moves through the process. For instance, after a document is reviewed, it might be sent to another department.
8. Manual Input Symbol
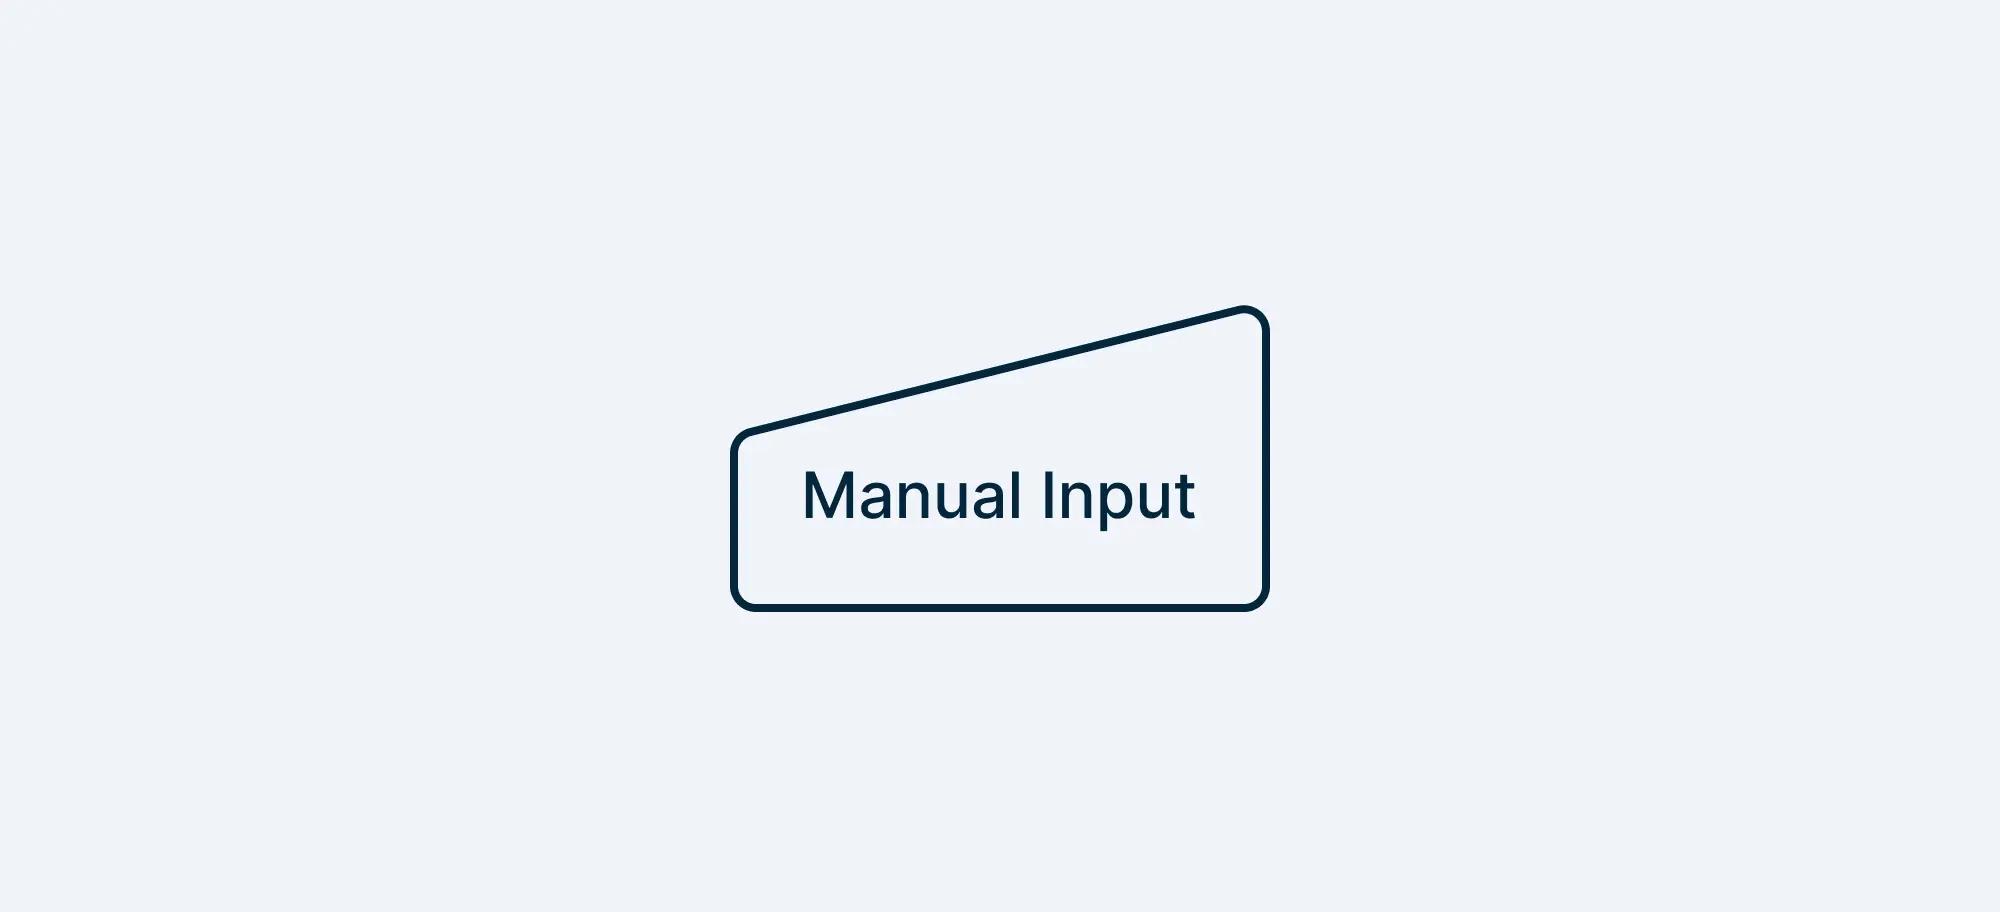
This symbol represents a non-automated process requiring manual input in a flowchart. For example, this could be a step that requires a user to input data manually, like filling out a form or entering the email address.
Best Practices:
Indicate the Requirement: Make sure to indicate what the input should be, like login data, personal information, payment details, etc.
Common Mistakes:
Overuse: Overusing manual inputs in your process diagram can create limitations and bottlenecks.
9. Manual Operation Symbol (Trapezoid)
The manual operation symbol represents a process step that is performed manually rather than automatically. It’s used when a task requires human intervention or physical effort.

Best Practices:
Specify Actions: Clearly define the manual task to avoid confusion about what needs to be done. This ensures that the person responsible understands their role and the task at hand.
Logical Placement: Place the manual operation symbol logically within the flow to ensure it fits naturally into the process. This makes the process easier to follow.
Common Mistakes:
Overuse: Avoid using manual operation symbols excessively in automated processes. This can clutter the flowchart and obscure the overall automation strategy.
Lack of Detail: Don’t assume that the manual operation is self-explanatory. Failing to provide enough detail can lead to errors or delays in the process.
10. Preparation Symbol (Hexagon)
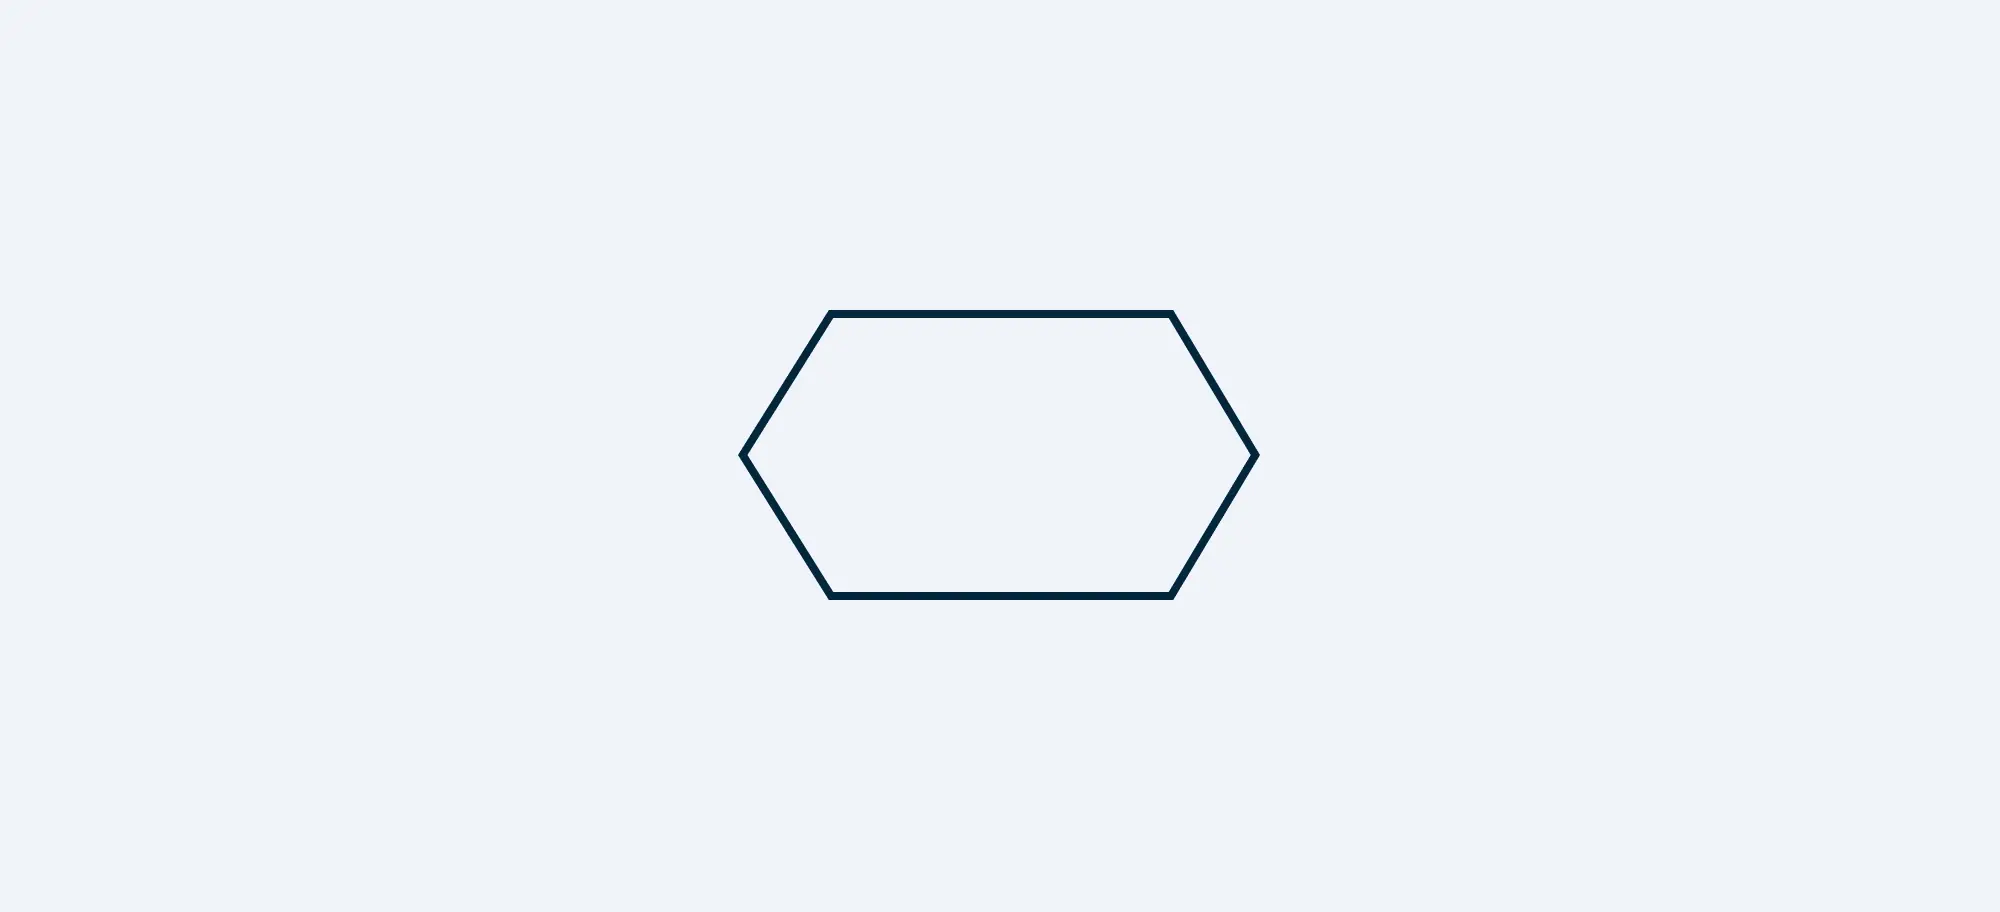
The preparation symbol, represented by a hexagon, indicates a setup process that prepares for the next step. It’s often used for initialization tasks or setting up parameters for the following action.
Best Practices:
Sequential Order: Place the preparation symbol at the correct point in the process to ensure that the setup is completed before the subsequent steps. This helps in maintaining the logical flow of the chart.
Clarity of Purpose: Clearly describe the preparation task so that its necessity and impact on the next step are understood.
Common Mistakes:
Misplacement: Avoid placing the preparation symbol too far from the step it’s preparing for. This can lead to confusion and disrupt the flow of the process.
Insufficient Information: Don’t use the preparation symbol without explaining what exactly is being prepared. This can leave users guessing about the setup required.
11. Display Symbol
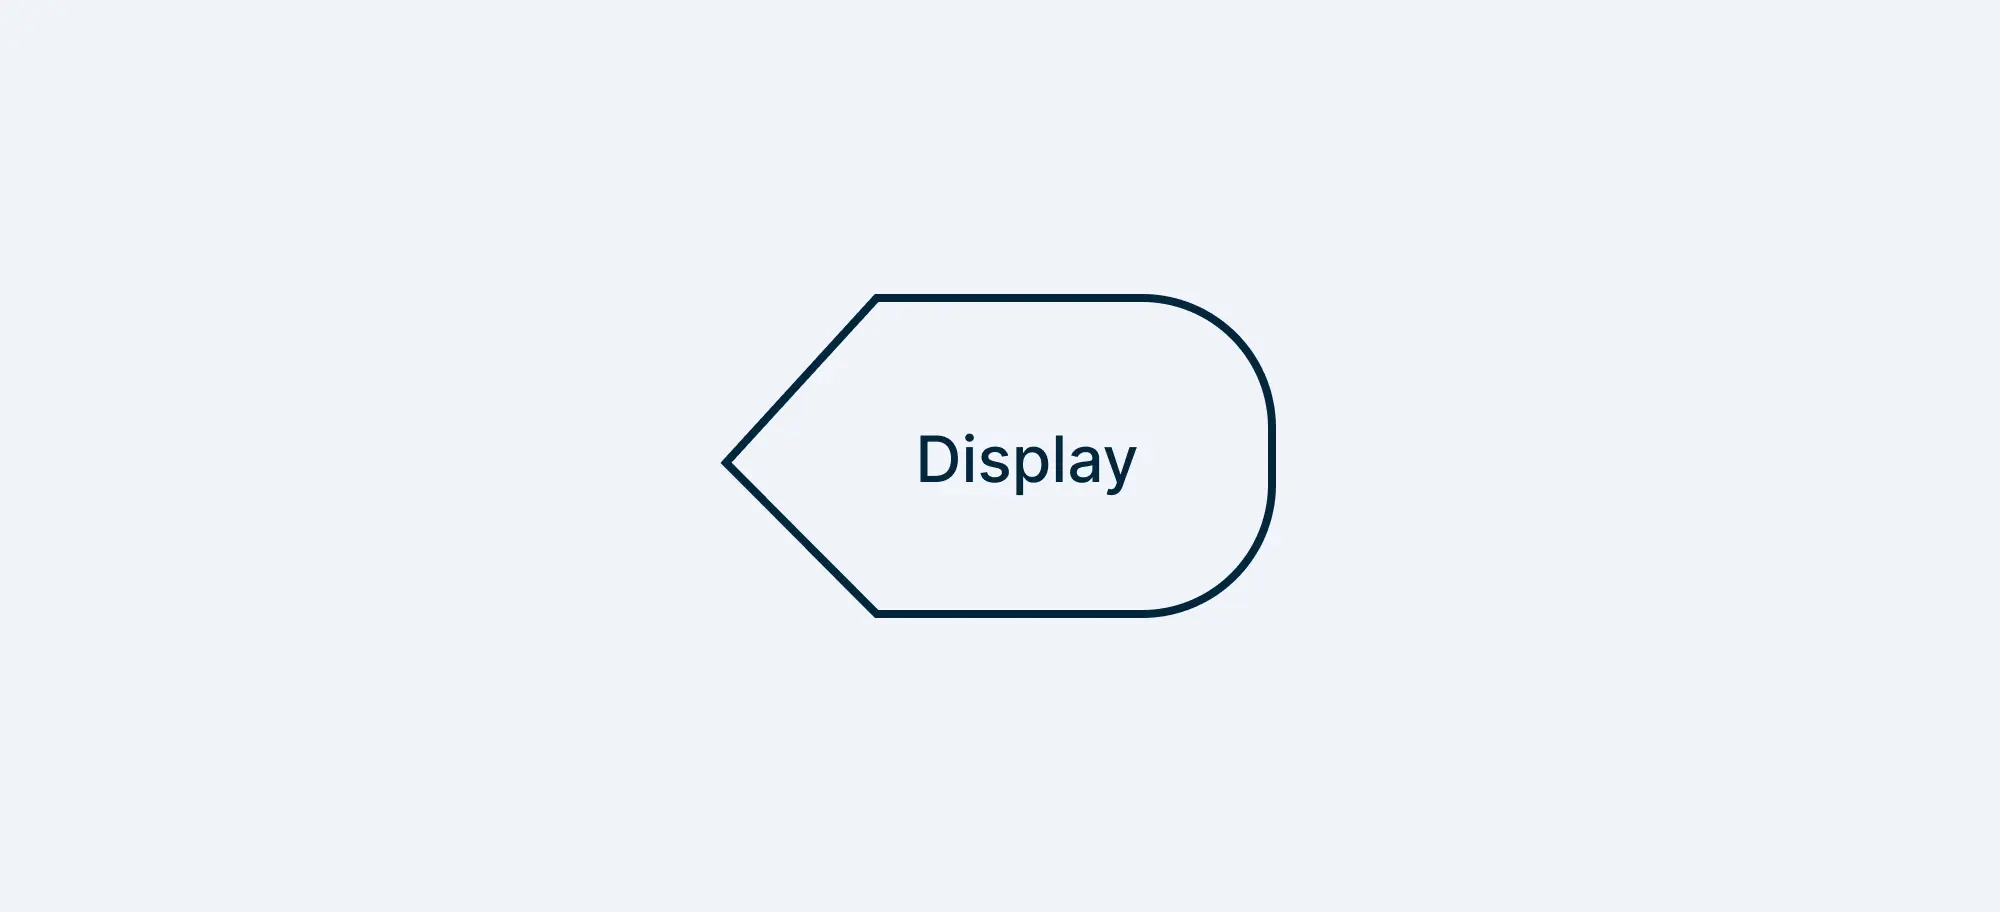
This indicates where information is displayed to the user during a process. This could be information displayed on a monitor or a report generated.
Best Practices:
Specify What’s Displayed: Indicate accurately what information is displayed without overcomplicating.
Common Mistakes:
Ambiguous Labeling: Avoid using generic labels which can confuse the end user.
12. Delay Symbol
The delay symbol, depicted as a sideways “D,” indicates a waiting period or delay in the process. It’s useful for showing where a process needs to pause before the next step can occur.

Best Practices:
Specify Duration: If possible, indicate how long the delay is expected to last. For instance, “Delay: 24 Hours” or “Waiting for Approval.”
Use When Necessary: Only use the delay symbol when it’s important to show that a pause is a part of the process.
Common Mistakes:
Unnecessary Use: Not every natural pause in a process needs a delay symbol. Reserve this for moments where the delay is significant or affects the overall timeline.
Lack of Explanation: Always provide context for why the delay occurs. Without an explanation, this symbol can create confusion.
Data Storage Symbols
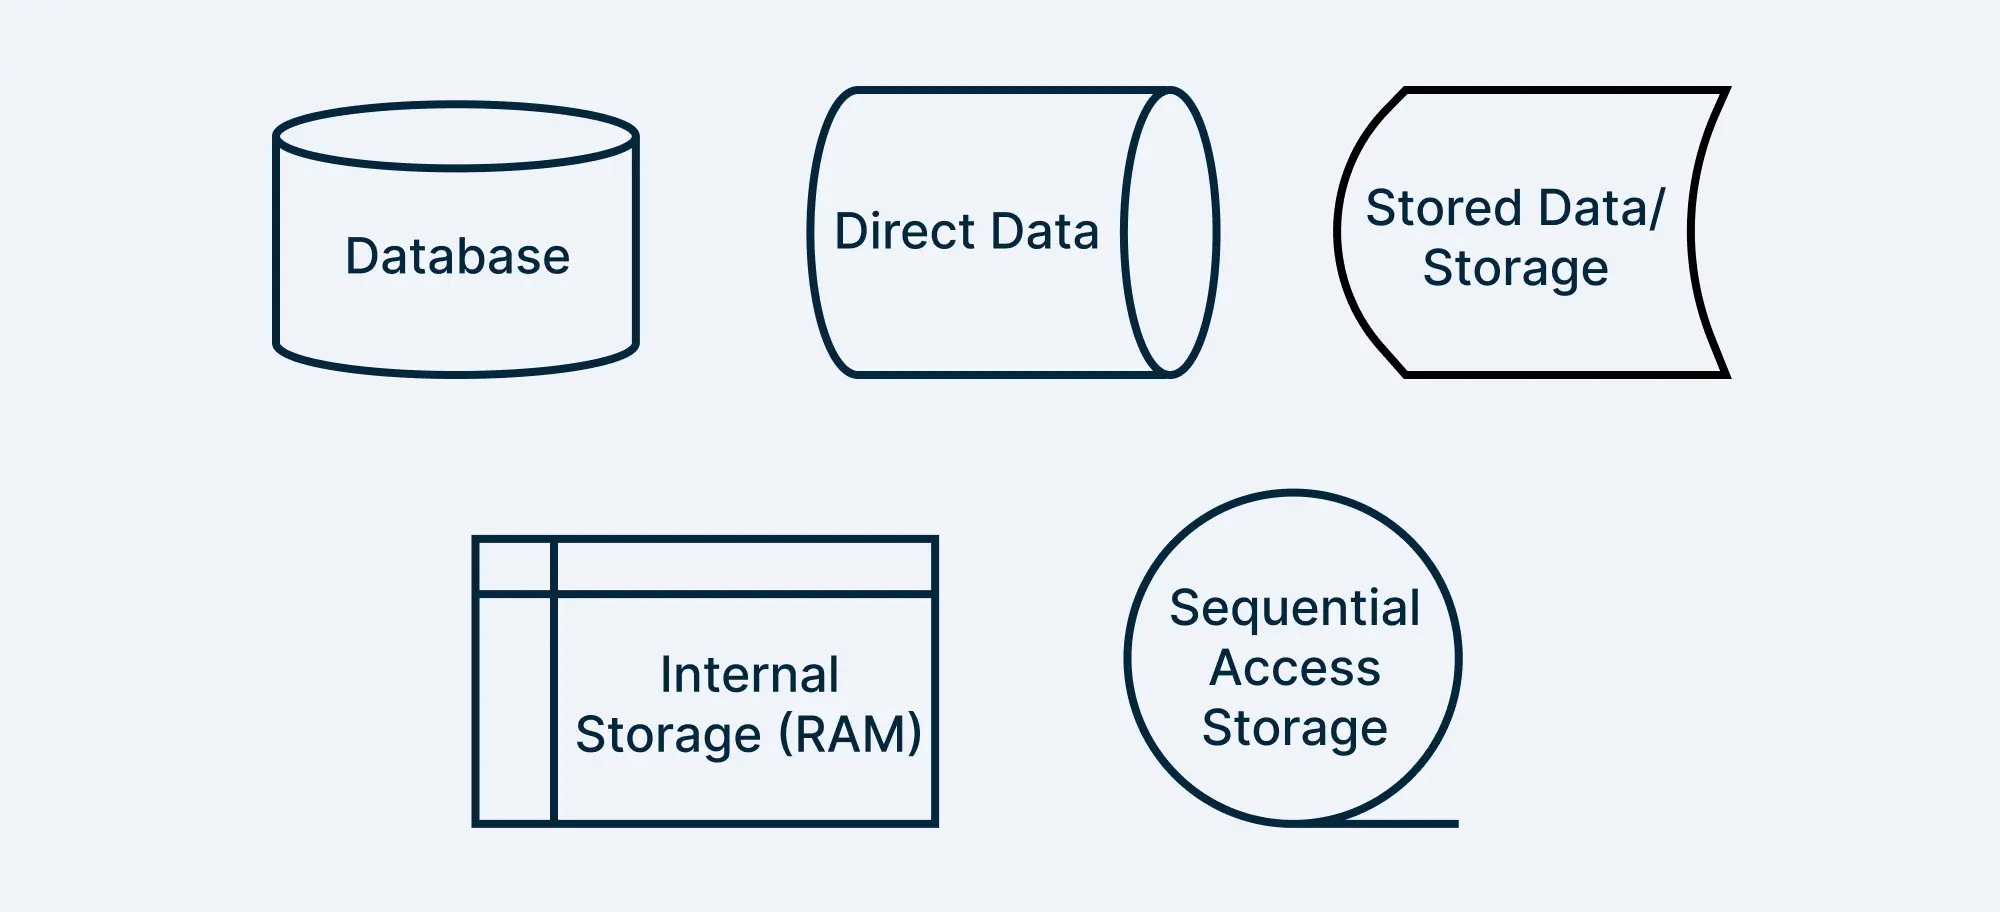
Several data storage symbols are used in flowchart designs depending on their functions.
13. Database Symbol
The database symbol, often represented as a cylinder, indicates that a process involves storing or retrieving data from a database. In a customer service process, for example, you might use the database symbol to represent where customer information is stored or retrieved for processing inquiries.
14. Stored Data/Storage Symbol
The stored data symbol is mainly used in programming flowcharts. It denotes a general data storage
15. Direct Data Symbol
Direct Data symbol indicates data stored on a hard drive that can be directly accessed.
16. Internal Storage Symbol
This is another type of data storage symbol commonly used in programming flowcharts to show a specific type of internal data storage.
17. Sequential Access Storage Symbol
This indicates data stored in a sequence that requires sequential access such as a magnetic tape.
Best Practices:
Specific Data Storage Naming: Indicate what data is being stored or retrieved. For example, “Retrieve Customer Data” or “Store Transaction Information.”
Highlight Data Flow: Make sure that arrows clearly show how data flows to and from the data storage.
Common Mistakes:
Generic Usage: Avoid using this symbol without specifying the nature of the data interaction. Be clear about what’s being accessed or stored.
Overloading with Data Storages: Use data storage symbols judiciously. Not every data interaction needs its own symbol—group similar data interactions when possible.
Navigation Flowchart Symbols
When the processes get complex, the flowcharts can also become quite complicated. To seamlessly navigate such complex flowcharts, several symbols are used.
18. On-Page Connector Symbol
The circle, or connector, is used to connect different parts of your flowchart without drawing long, messy lines across the chart. It’s especially useful when your flowchart is complex.

Best Practices:
Strategic Placement: Place the on-page connector symbol at points where continuing the flow line would make the chart cluttered or difficult to read. This helps maintain a neat and organized layout.
Clear Labeling: Clearly label each on-page connector with a unique identifier (such as a letter or number) to ensure users can easily follow the flow from one part of the chart to another.
Common Mistakes:
Overuse: Avoid using too many on-page connectors, as this can make the flowchart harder to follow and diminish the benefits of using them to keep the chart tidy.
Inconsistent Labeling: Don’t use inconsistent or unclear labels for your connectors, as this can lead to confusion and errors in following the flow.
19. Off-Page Connector/Reference Symbol
Off-page connector, often represented by a pentagon, is used when a complex process is spread over several pages. It allows the flow to continue on a different page, with the page number or reference clearly indicated within the symbol.

Best Practices:
Page Numbering: Always include the page number or reference within the off-page connector to guide users to the correct continuation of the flow. This ensures that the flowchart remains easy to follow, even across multiple pages.
Logical Flow Continuation: Place the off-page connector at natural breaking points in the process, where it makes sense to continue on a different page. This helps in maintaining the logical sequence of the flowchart.
Common Mistakes:
Misleading Continuation: Avoid placing the off-page connector at arbitrary points in the process, as this can disrupt the flow and make the chart difficult to follow.
Lack of Clarity: Don’t forget to clearly label the off-page connector with the correct reference or page number. Failing to do so can lead to confusion and make it difficult for users to navigate the flowchart.
20. Or Symbol
The or symbol, typically an ellipse with a vertical cross, represents a branching point where the flow must choose one path or another. It’s used when multiple paths are possible, but only one can be taken.

Best Practices:
Clearly Defined Choices: Clearly label the paths emerging from the or symbol to ensure that users understand the available options.
Logical Flow: Make sure the branching paths lead to logical, distinct outcomes, and that they are placed sequentially in a way that makes the flowchart easy to follow.
Common Mistakes:
Ambiguous Choices: Avoid leaving the choices at the or symbol vague or unclear, as this can lead to incorrect decisions being made in the process.
Unbalanced Paths: Don’t create paths that are too similar or don’t represent distinctly different options, as this can defeat the purpose of the or symbol and confuse users.
21. Merge Symbol (Upside-Down Triangle)
The merge symbol, typically an upside-down triangle, is used to combine two paths or processes into a single one. It’s commonly used when different branches in a flowchart converge into one path.

Best Practices:
Consistent Use: Ensure that all merging paths logically lead to a single, coherent process. Consistency in the use of this symbol helps in understanding how different parts of the process come together.
Label Merged Paths: Label or annotate each path that leads into the merge symbol to clarify where each flow is coming from.
Common Mistakes:
Merging Unrelated Paths: Avoid merging paths that don’t logically fit together, as this can cause confusion and disrupt the flowchart’s clarity.
Over-Merging: Don’t overuse merge symbols, as too many converging paths can complicate the flowchart and make it difficult to follow.
22. Summoning Junction Symbol
The summoning junction symbol, usually depicted as a circle with a diagonal cross, indicates points where multiple flows or paths converge back into a single process. It’s used to simplify the flowchart by reducing the number of paths that need to be followed simultaneously.

Best Practices:
Clarity of Convergence: Ensure that all paths converging at the summoning junction are clearly identified and logically fit together. This helps in maintaining a coherent and streamlined process.
Consistent Use: Use the summoning junction symbol consistently across the flowchart to avoid confusion and make the chart easier to understand.
Common Mistakes:
Merging Incompatible Paths: Avoid converging paths that don’t logically belong together, as this can cause confusion and disrupt the overall flow.
Overuse: Don’t use the summoning junction symbol too frequently, as this can complicate the flowchart and make it harder to follow the main process.
How to Choose the Right Flowchart Symbol for a Process?
Selecting the correct flowchart symbols ensures clarity and accuracy in your process mapping. Here’s how to determine which symbols to use:
1. Identify the Type of Step
Each flowchart symbol represents a different action:
- Start/End (Terminator Symbol) – Marks the beginning or end of a process.
- Process (Rectangle) – Represents an action or task.
- Decision (Diamond) – Indicates a branching point with Yes/No or True/False paths.
- Input/Output (Parallelogram) – Used for receiving or displaying data.
- Arrow (Connector) – Shows the flow direction between steps.
2. Consider the Level of Detail
- For simple workflows, stick to basic symbols (Start, Process, Decision, and End).
- For complex processes, include advanced symbols like manual input, predefined processes, or document symbols.
3. Maintain Consistency
- Use the same symbols throughout for similar actions to avoid confusion.
- Follow standard flowcharting conventions to make it easy for others to interpret.
4. Optimize for Readability
- Avoid overcomplicating with too many decision points.
- Use consistent spacing and alignment to ensure a clear structure.
By choosing the right flowchart symbols, you can create a structured, easy-to-follow process map that improves understanding and efficiency.
Flowchart Symbols vs. Other Diagram Symbols
Flowchart symbols are commonly used for process mapping, but other diagramming notations like UML (Unified Modeling Language) and BPMN (Business Process Model and Notation) serve different purposes. Here’s how they compare:
| Aspect | Flowchart Symbols | UML Symbols | BPMN Symbols |
|---|---|---|---|
| Purpose | Visualizing processes and workflows | Modeling software architecture and object-oriented design | Mapping complex business processes and workflows |
| Common Shapes | Start/End, Process, Decision, Arrows | Classes, Objects, Use Cases, Activities | Events, Tasks, Gateways, Sequence Flows |
| Usage | Simple process flows, decision-making, step-by-step instructions | Software development, system design, object relationships | Business process automation, workflow standardization |
| Complexity | Simple to moderate | Moderate to high | High (detailed business rules and automation) |
| Best For | Quick process mapping, brainstorming, workflow visualization | Software engineering, application development | Enterprise-level process management and optimization |
Key Differences
- Flowchart Symbols: Best for straightforward workflows, decision-making, and process visualization.
- UML Symbols: Used mainly in software development to design system structures and object interactions.
- BPMN Symbols: Offer a detailed approach for mapping complex business processes, including automation and decision rules.
Understanding these differences ensures you choose the right diagramming method for your specific needs.
Industry-Specific Flowchart Symbols and Use Cases
Flowchart symbols are widely used across industries to represent specialized workflows and processes. Understanding how they apply in different fields can help streamline operations and improve efficiency. Below is a breakdown of how flowchart symbols are used in manufacturing, healthcare, software development, and business.
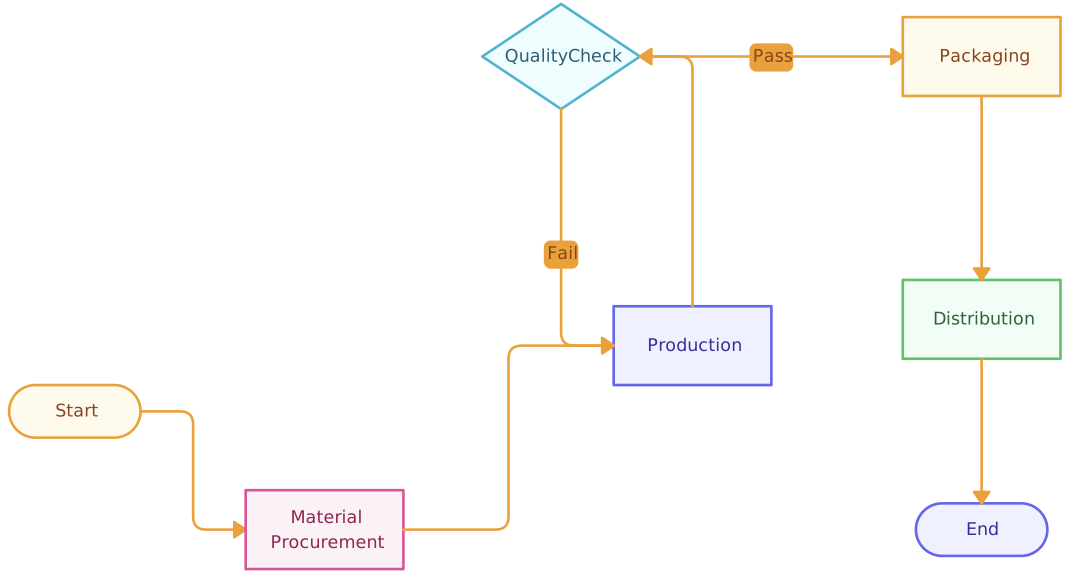
1. Manufacturing: Streamlining Production and Quality Control
Flowcharts in manufacturing help visualize production workflows, inventory management, and quality control procedures.
Commonly Used Symbols
- Process Symbol: Represents different stages in a production line, such as assembly, inspection, or packaging.
- Decision Symbol: Used for quality control checks, determining if a product is approved or needs rework.
- Connector Symbol: Helps track processes across different departments, such as procurement and logistics. Example

2. Healthcare: Managing Patient Care and Medical Processes
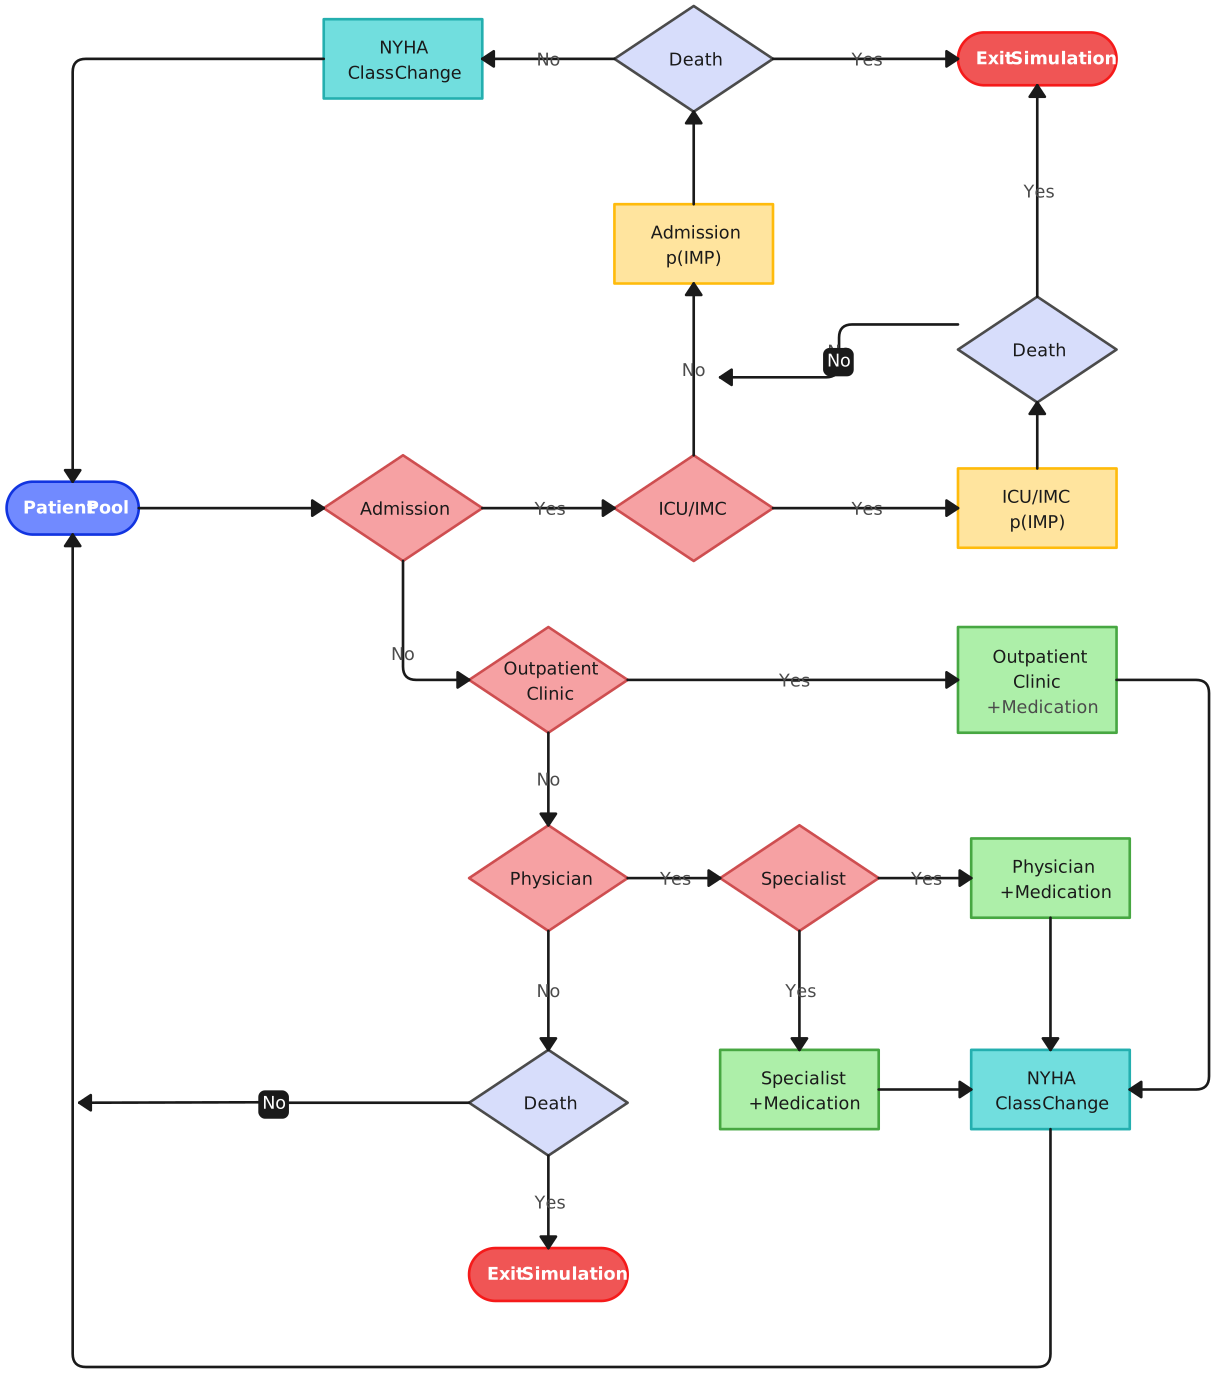
In healthcare, flowcharts help in patient admission, diagnosis, emergency response, and treatment workflows.
Commonly Used Symbols
- Terminator Symbol: Marks the start of a patient’s journey, such as hospital admission.
- Input/Output Symbol: Represents patient records, test results, or prescriptions.
- Decision Symbol: Used in diagnosis to determine treatment options based on symptoms.
3. Software Development: Visualizing Algorithms and System Workflows
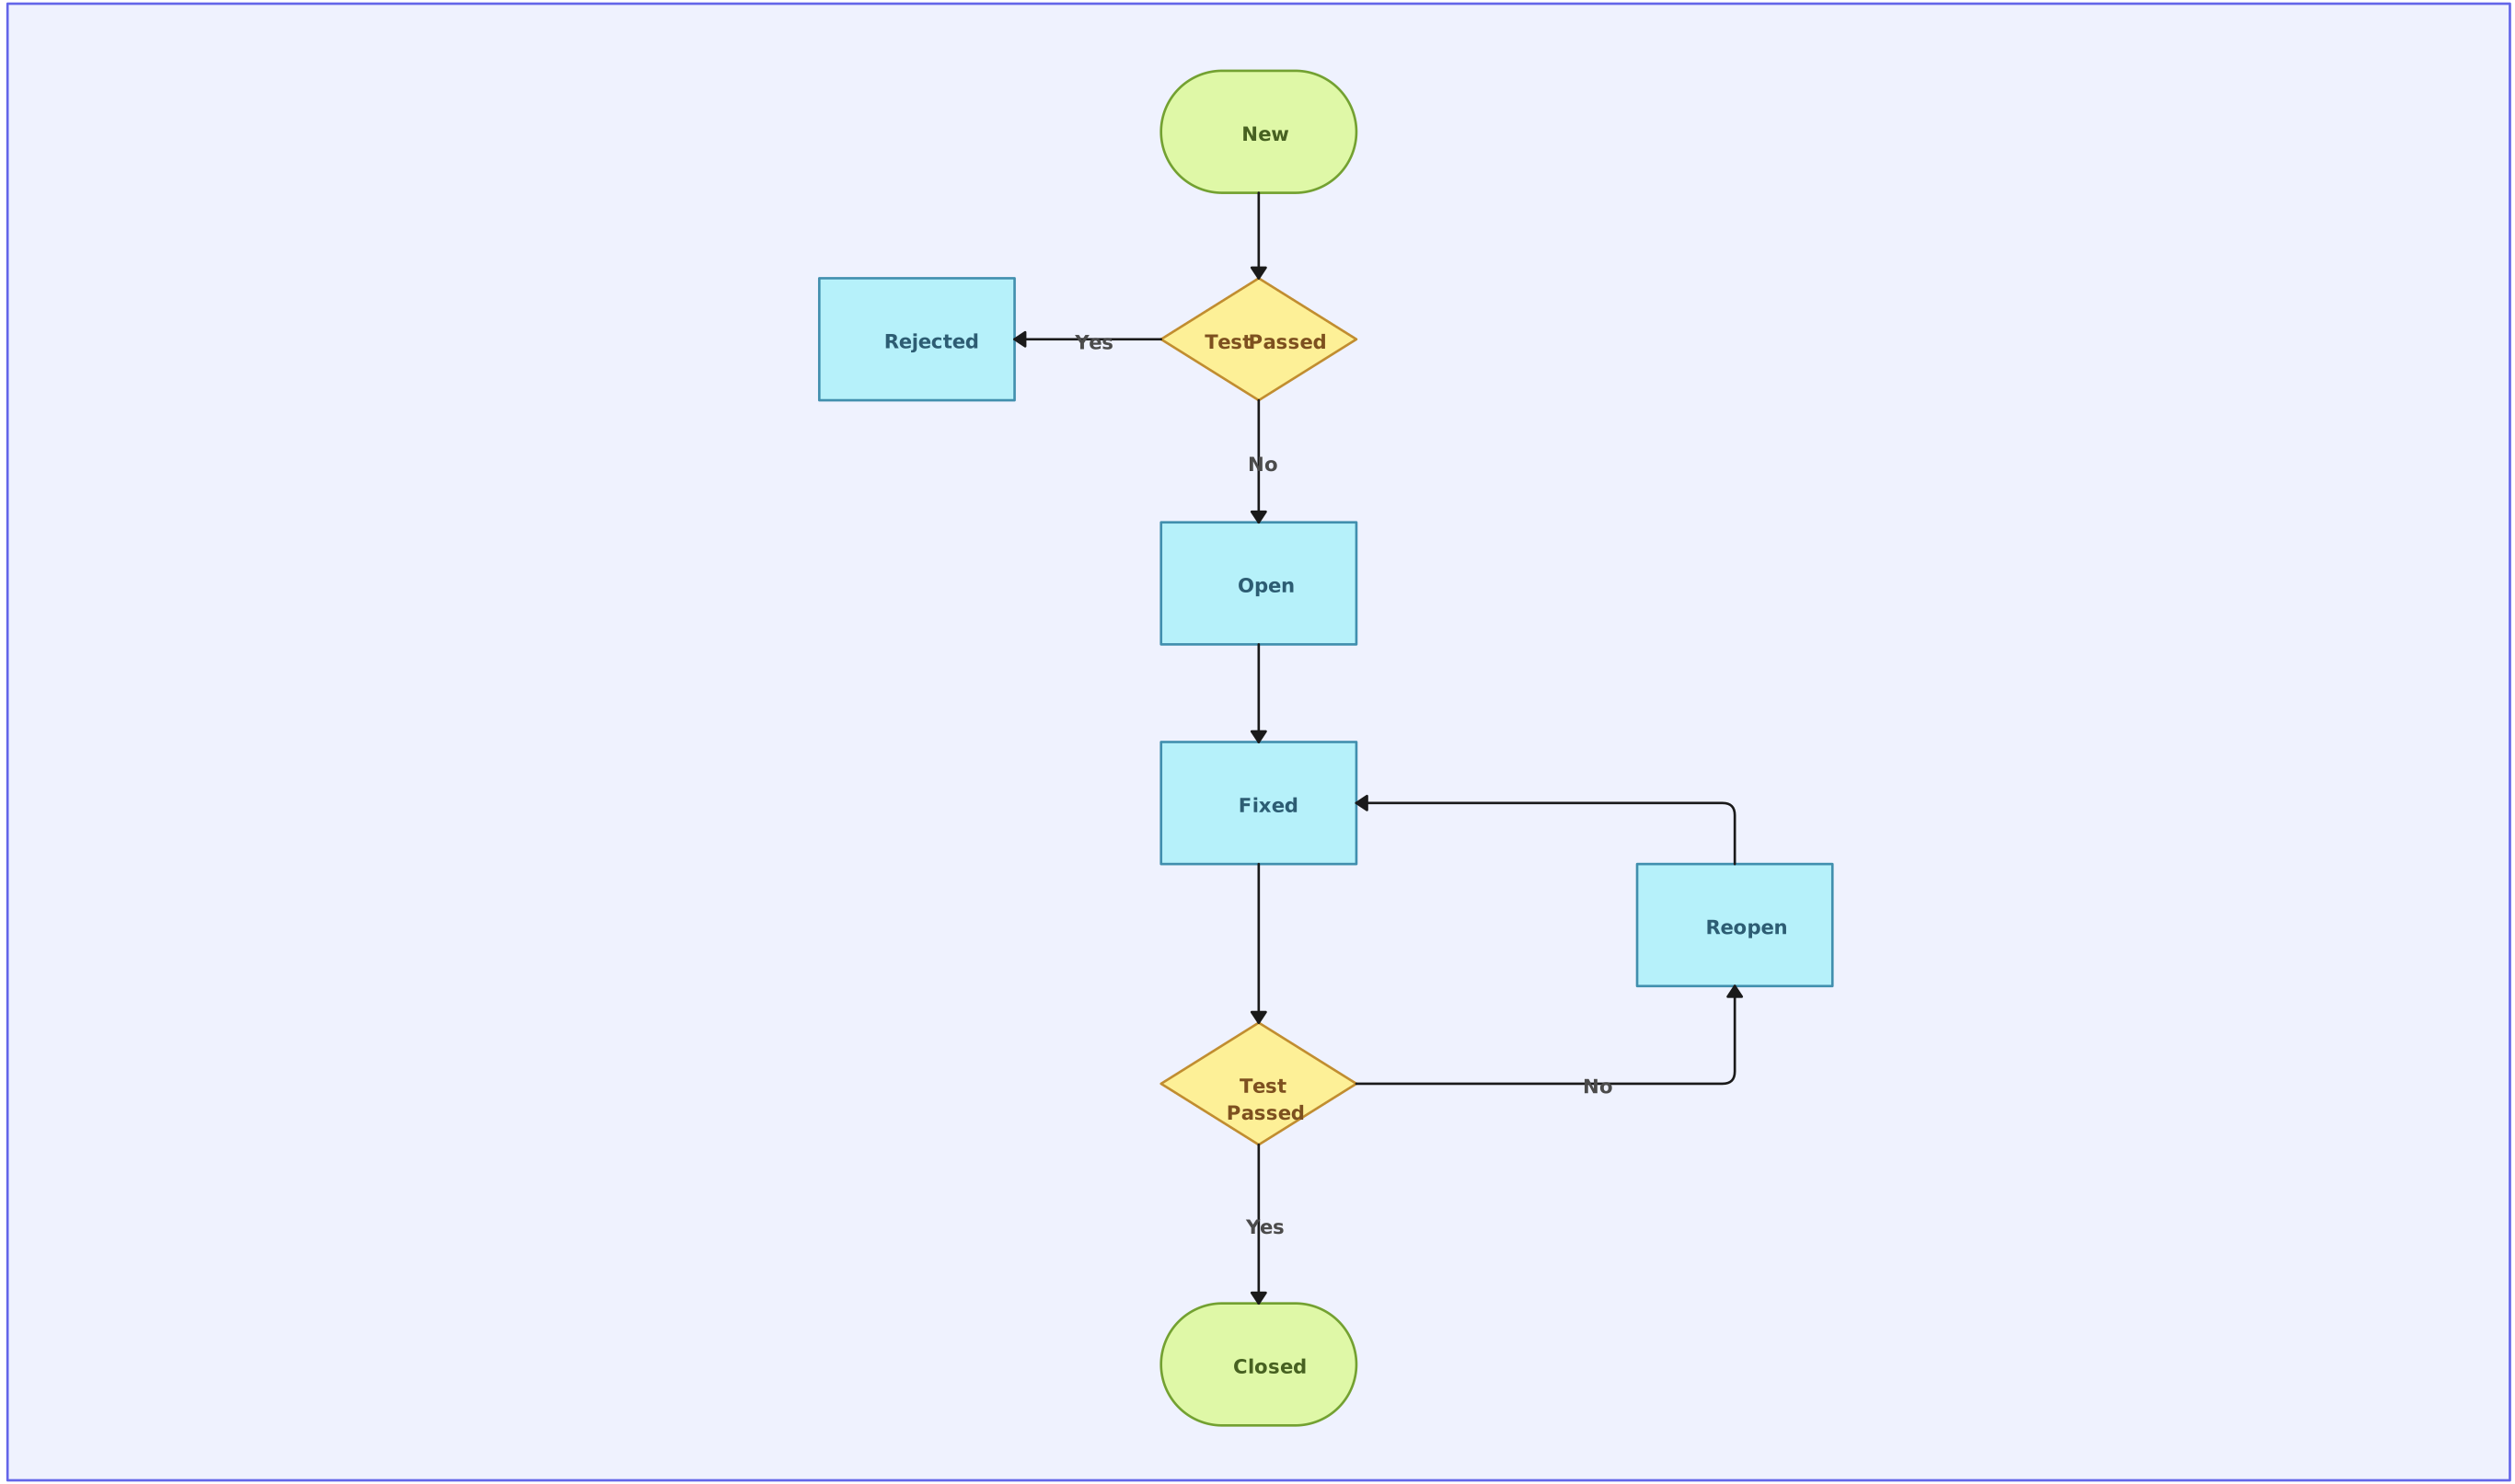
Flowcharts are extensively used in software engineering for algorithm design, debugging, and system architecture.
Commonly Used Symbols
- Process Symbol: Represents function executions or system operations.
- Decision Symbol: Handles conditional logic in programming.
- Subprocess Symbol: Indicates reusable code blocks or separate program functions.
4. Business and Finance: Optimizing Operations and Decision-Making
Businesses use flowcharts to streamline processes like sales, financial approvals, and customer support. Commonly Used Symbols
- Predefined Process Symbol: Represents standardized workflows like payroll processing.
- Database Symbol: Stores financial transactions or customer data.
- Decision Symbol: Used for approvals, such as loan applications or invoice processing.
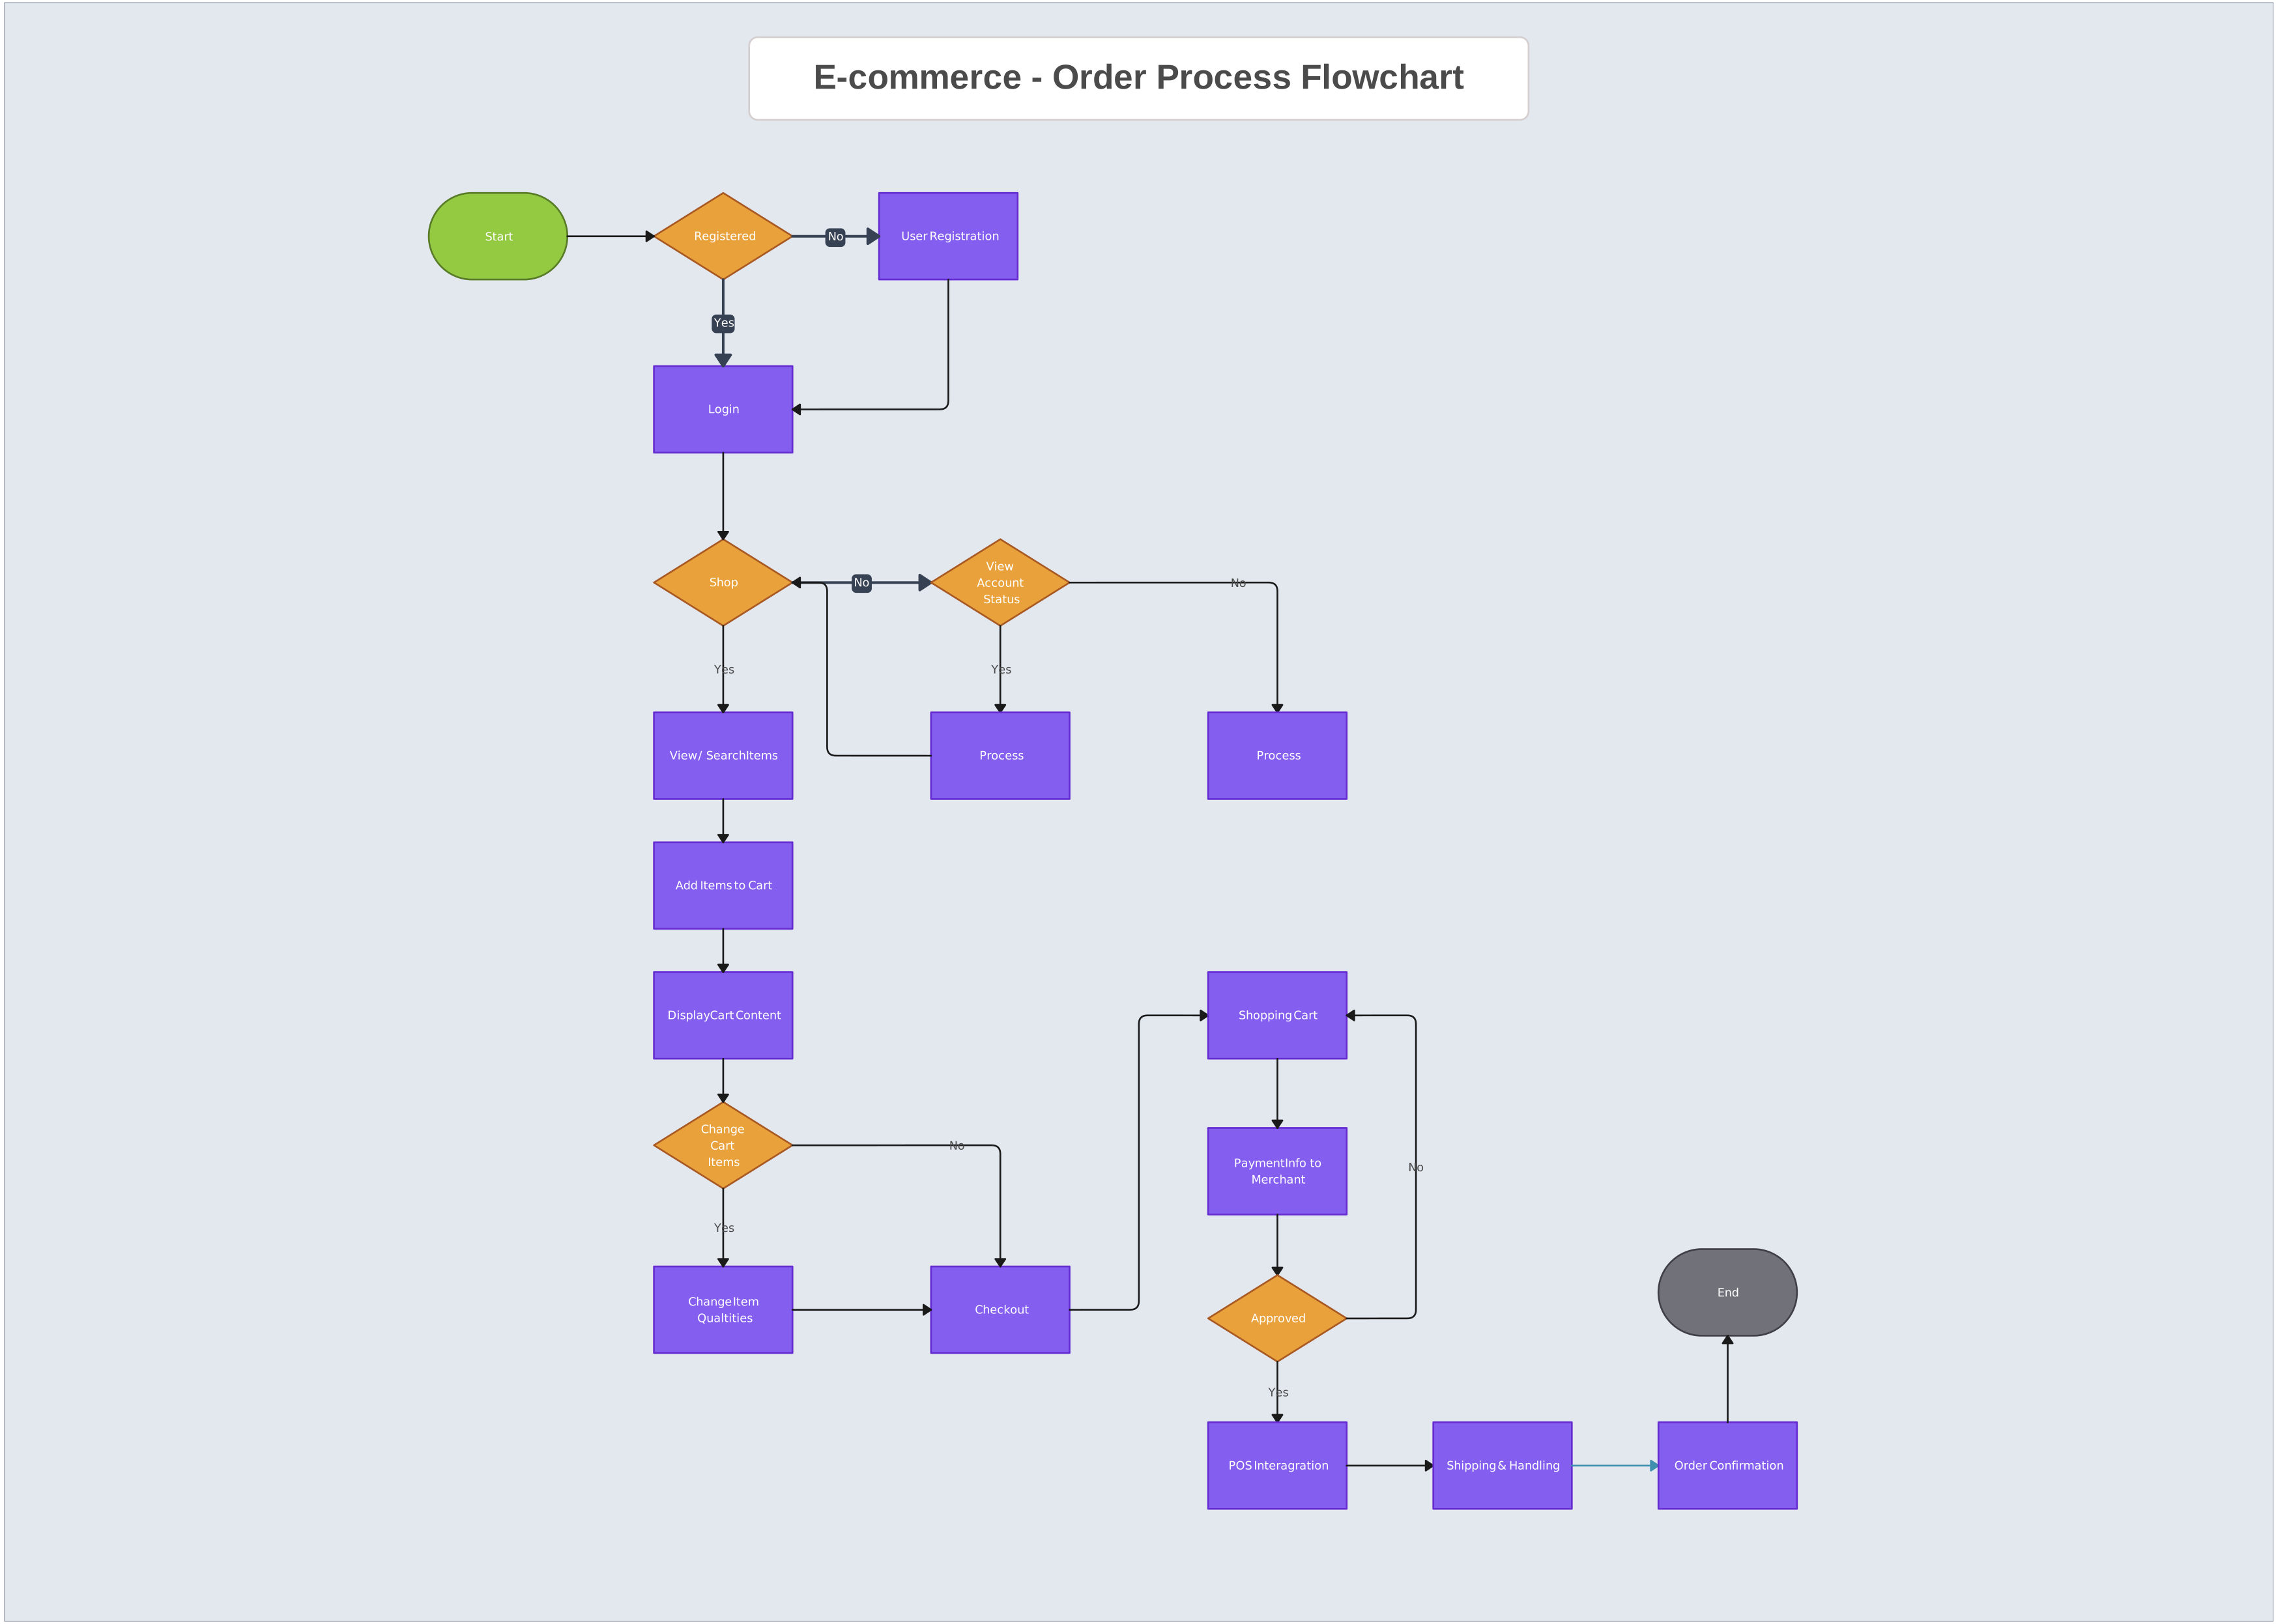
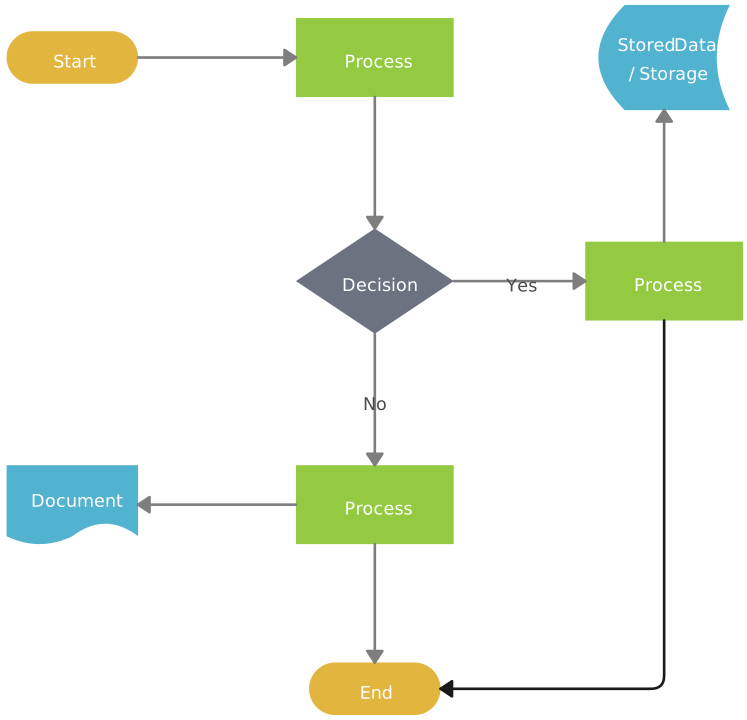
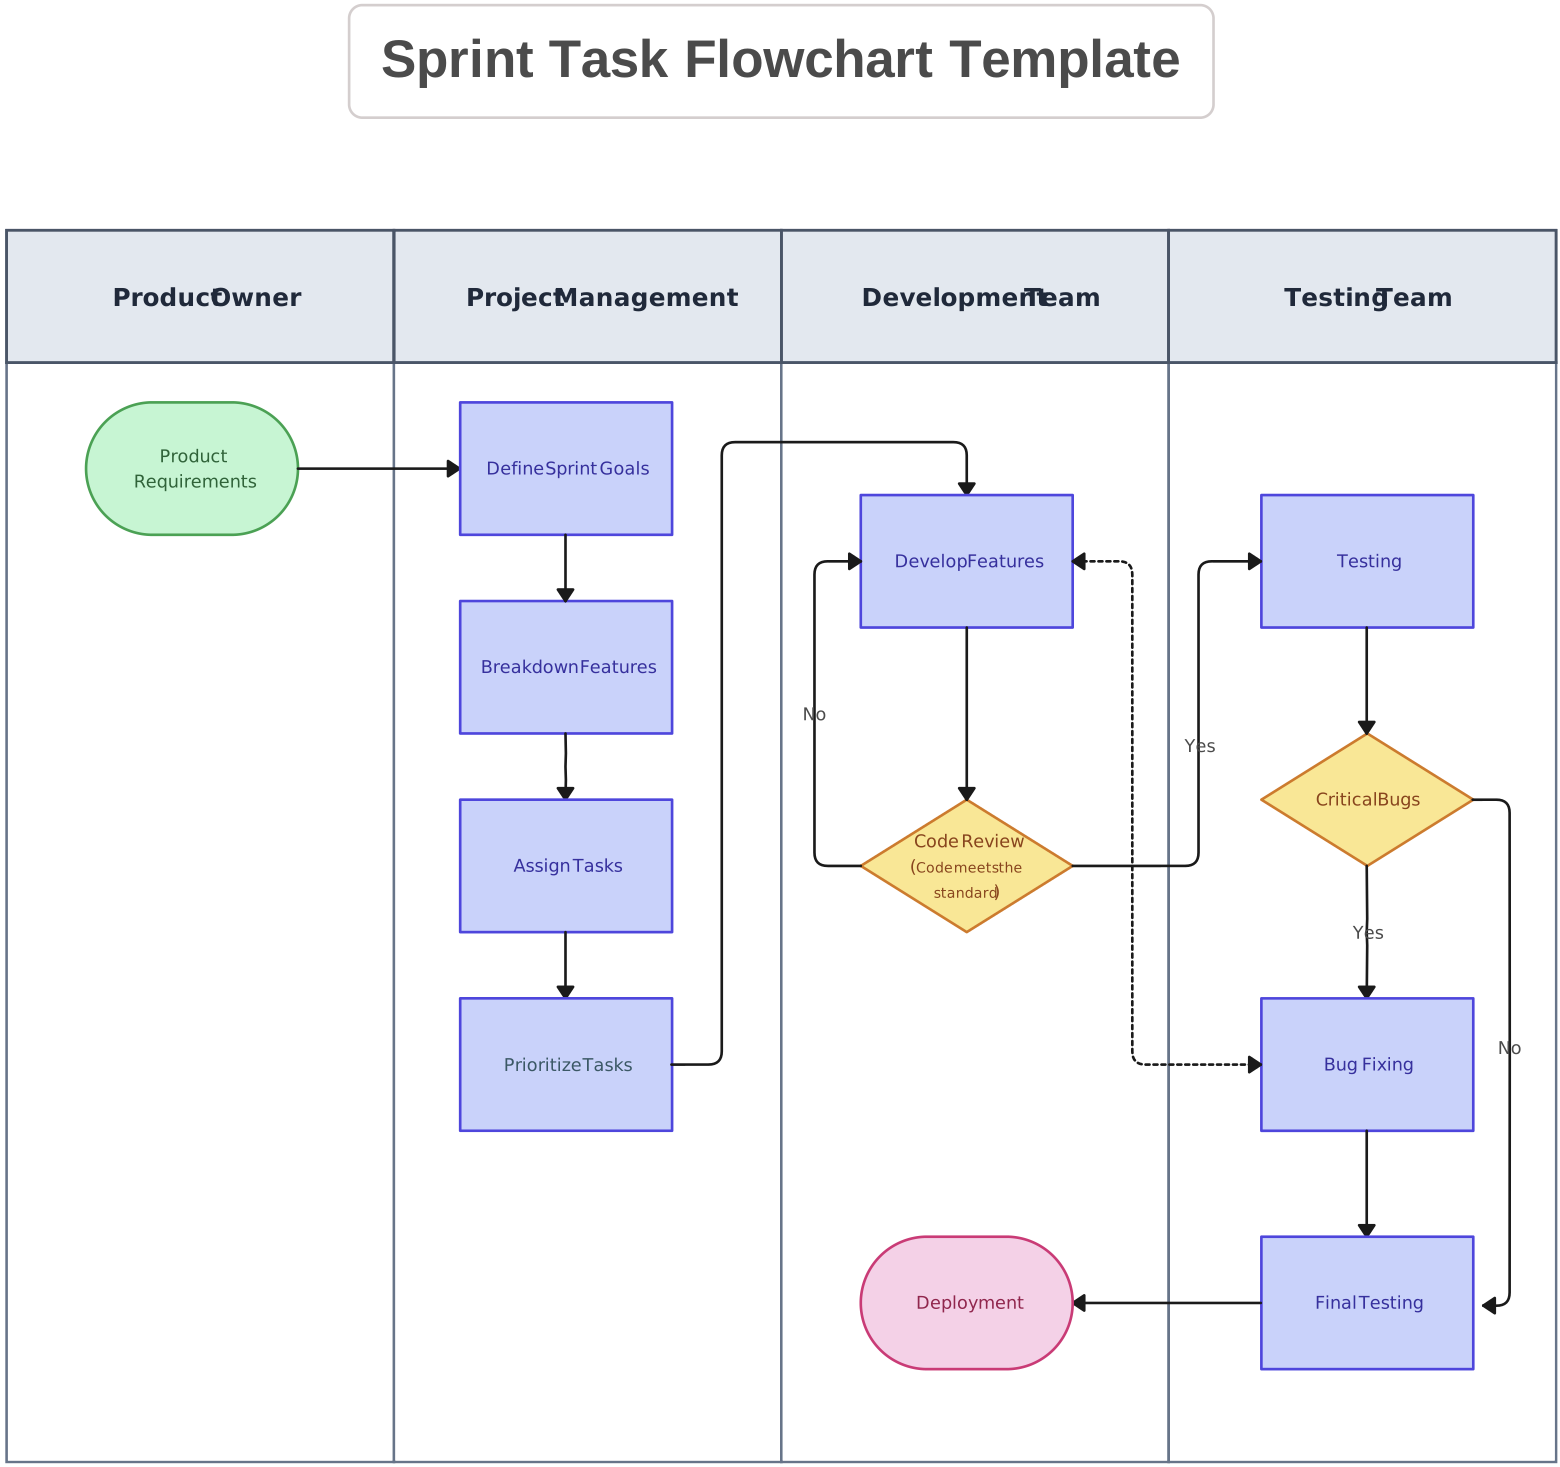
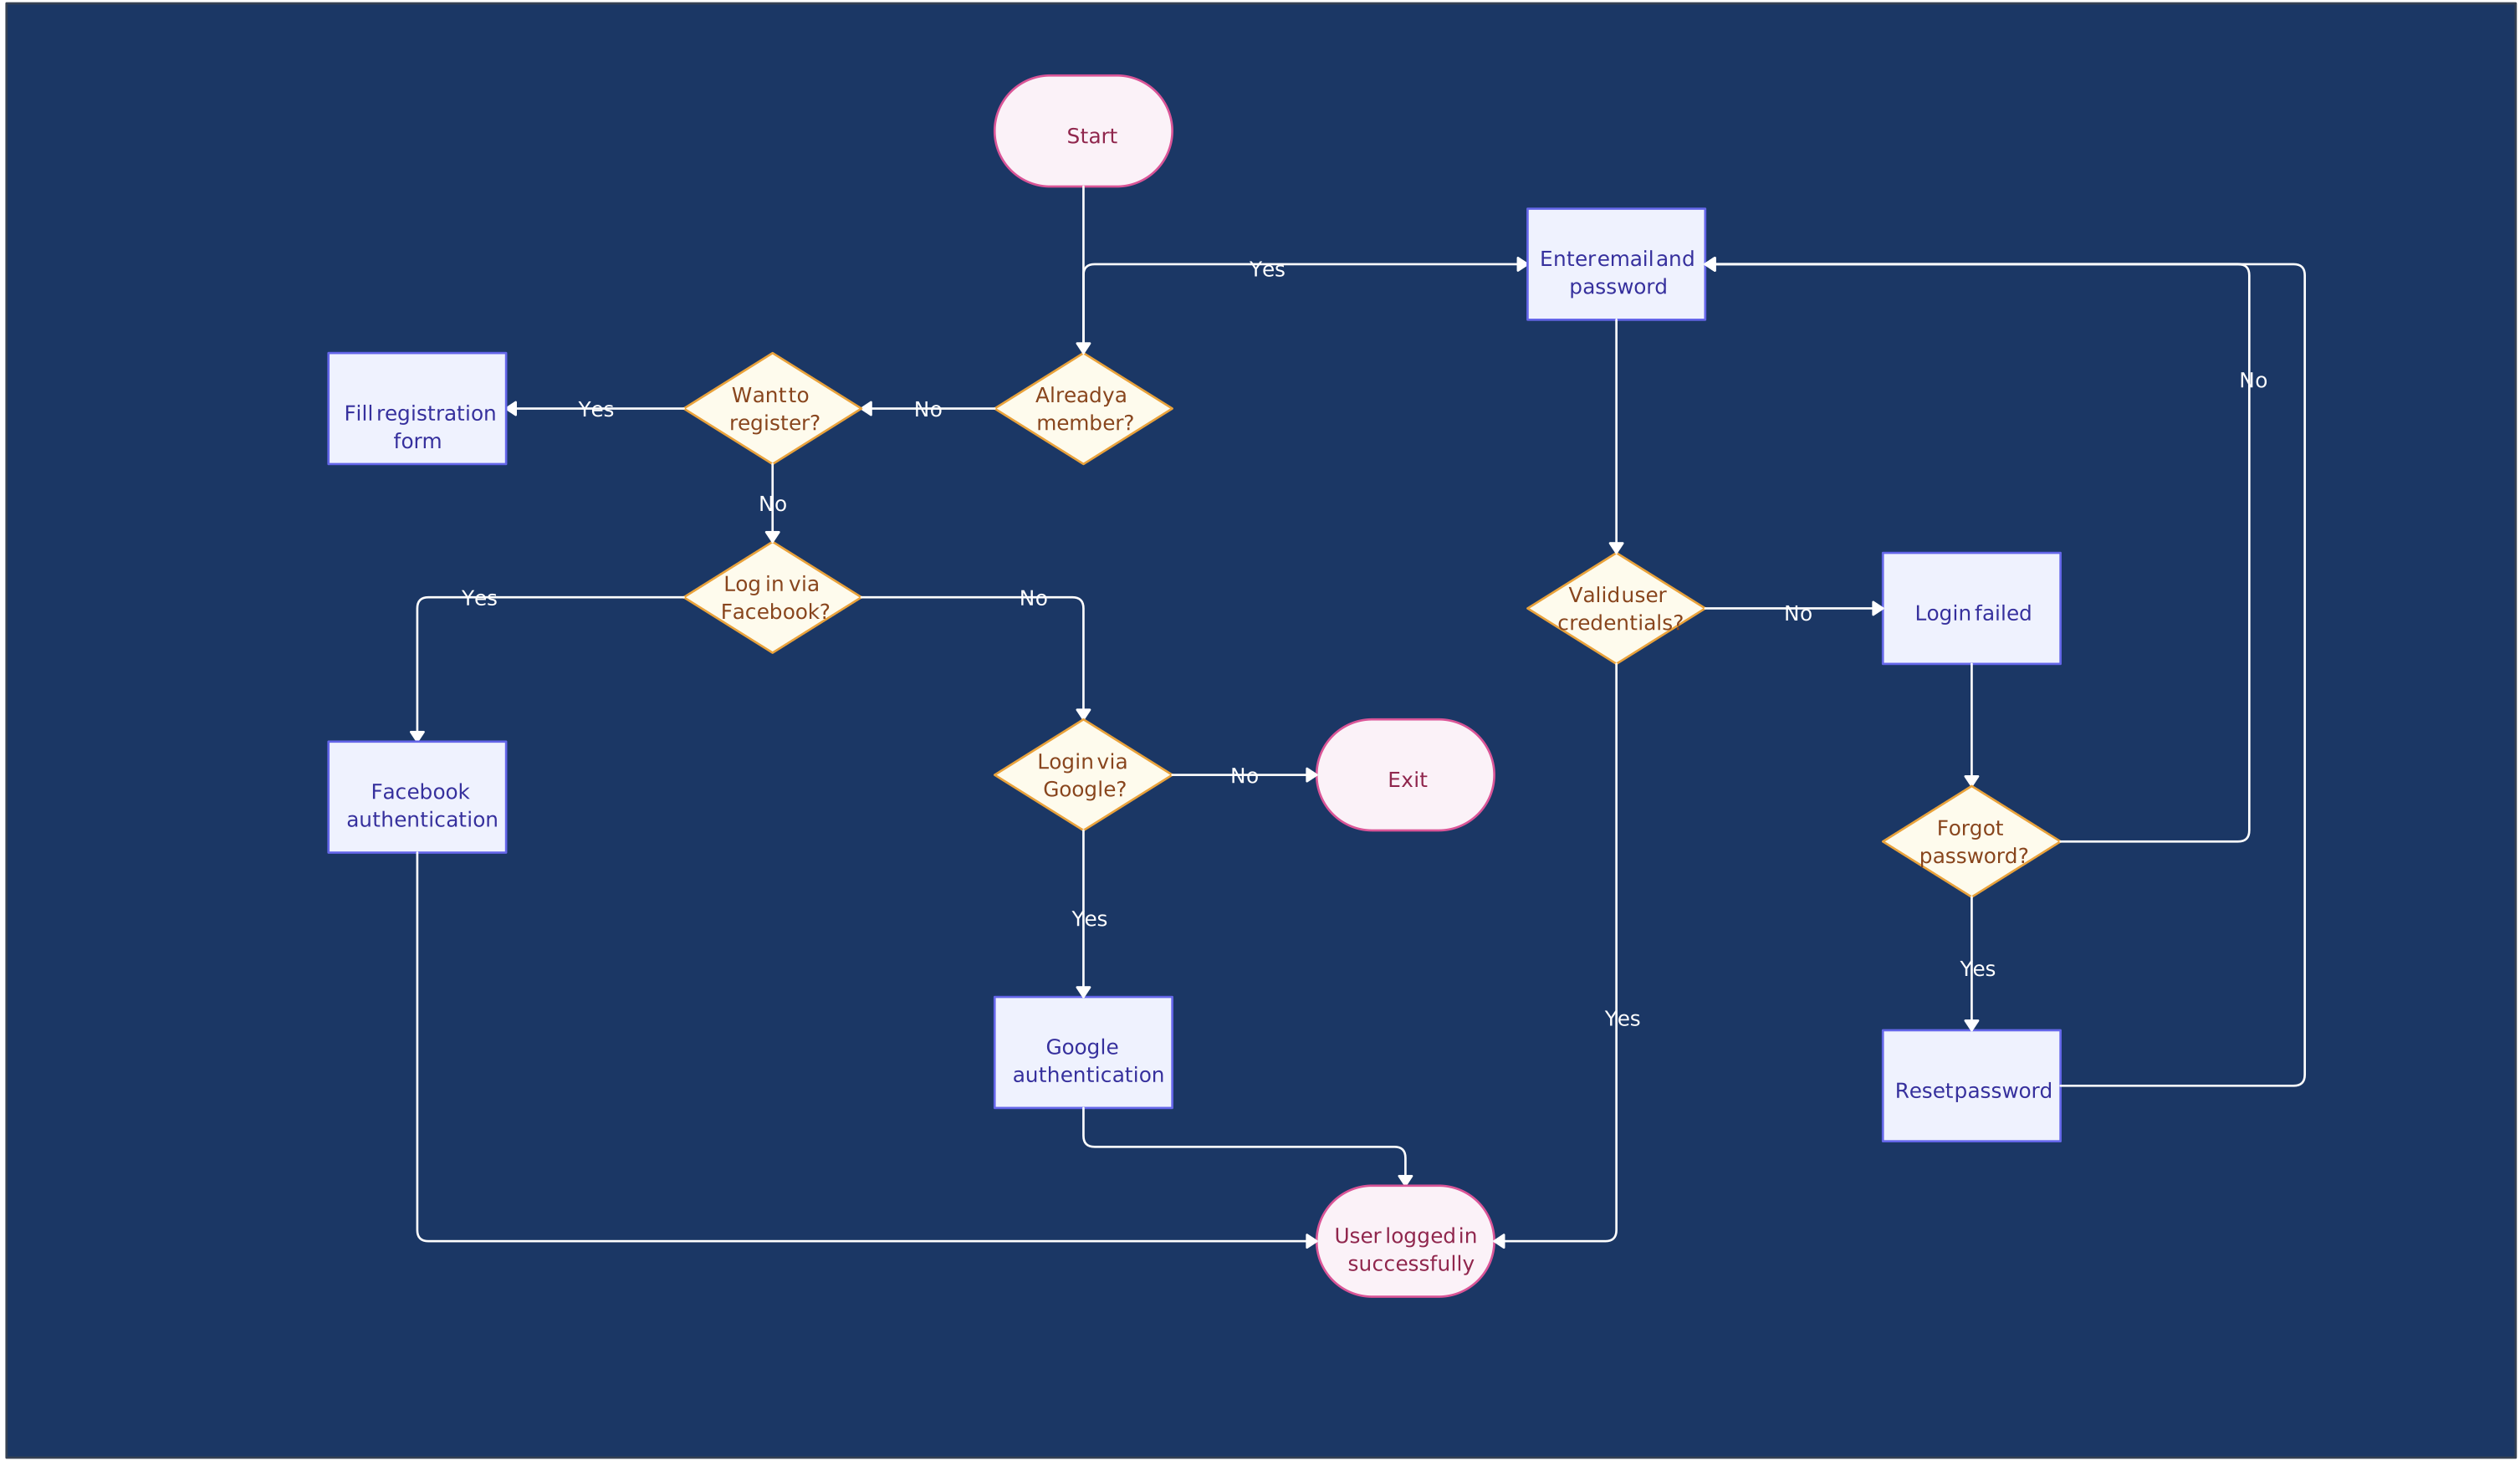
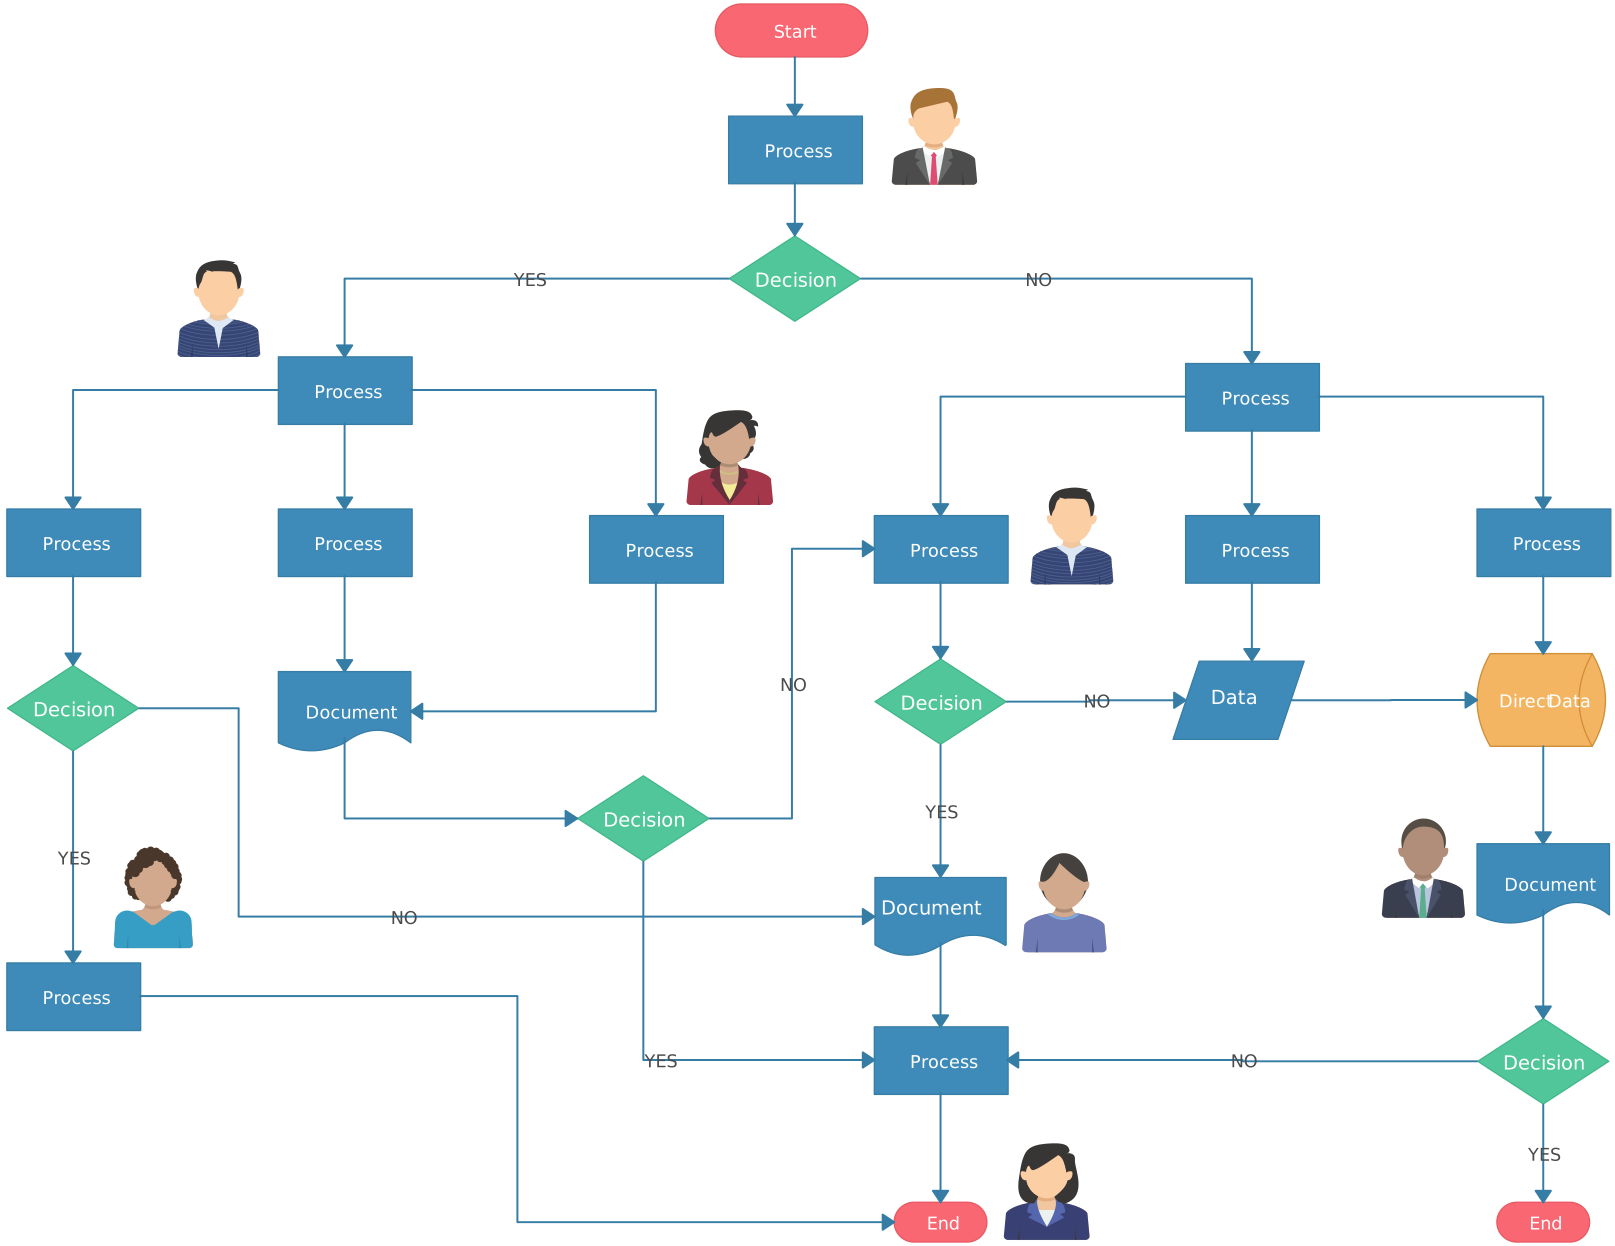
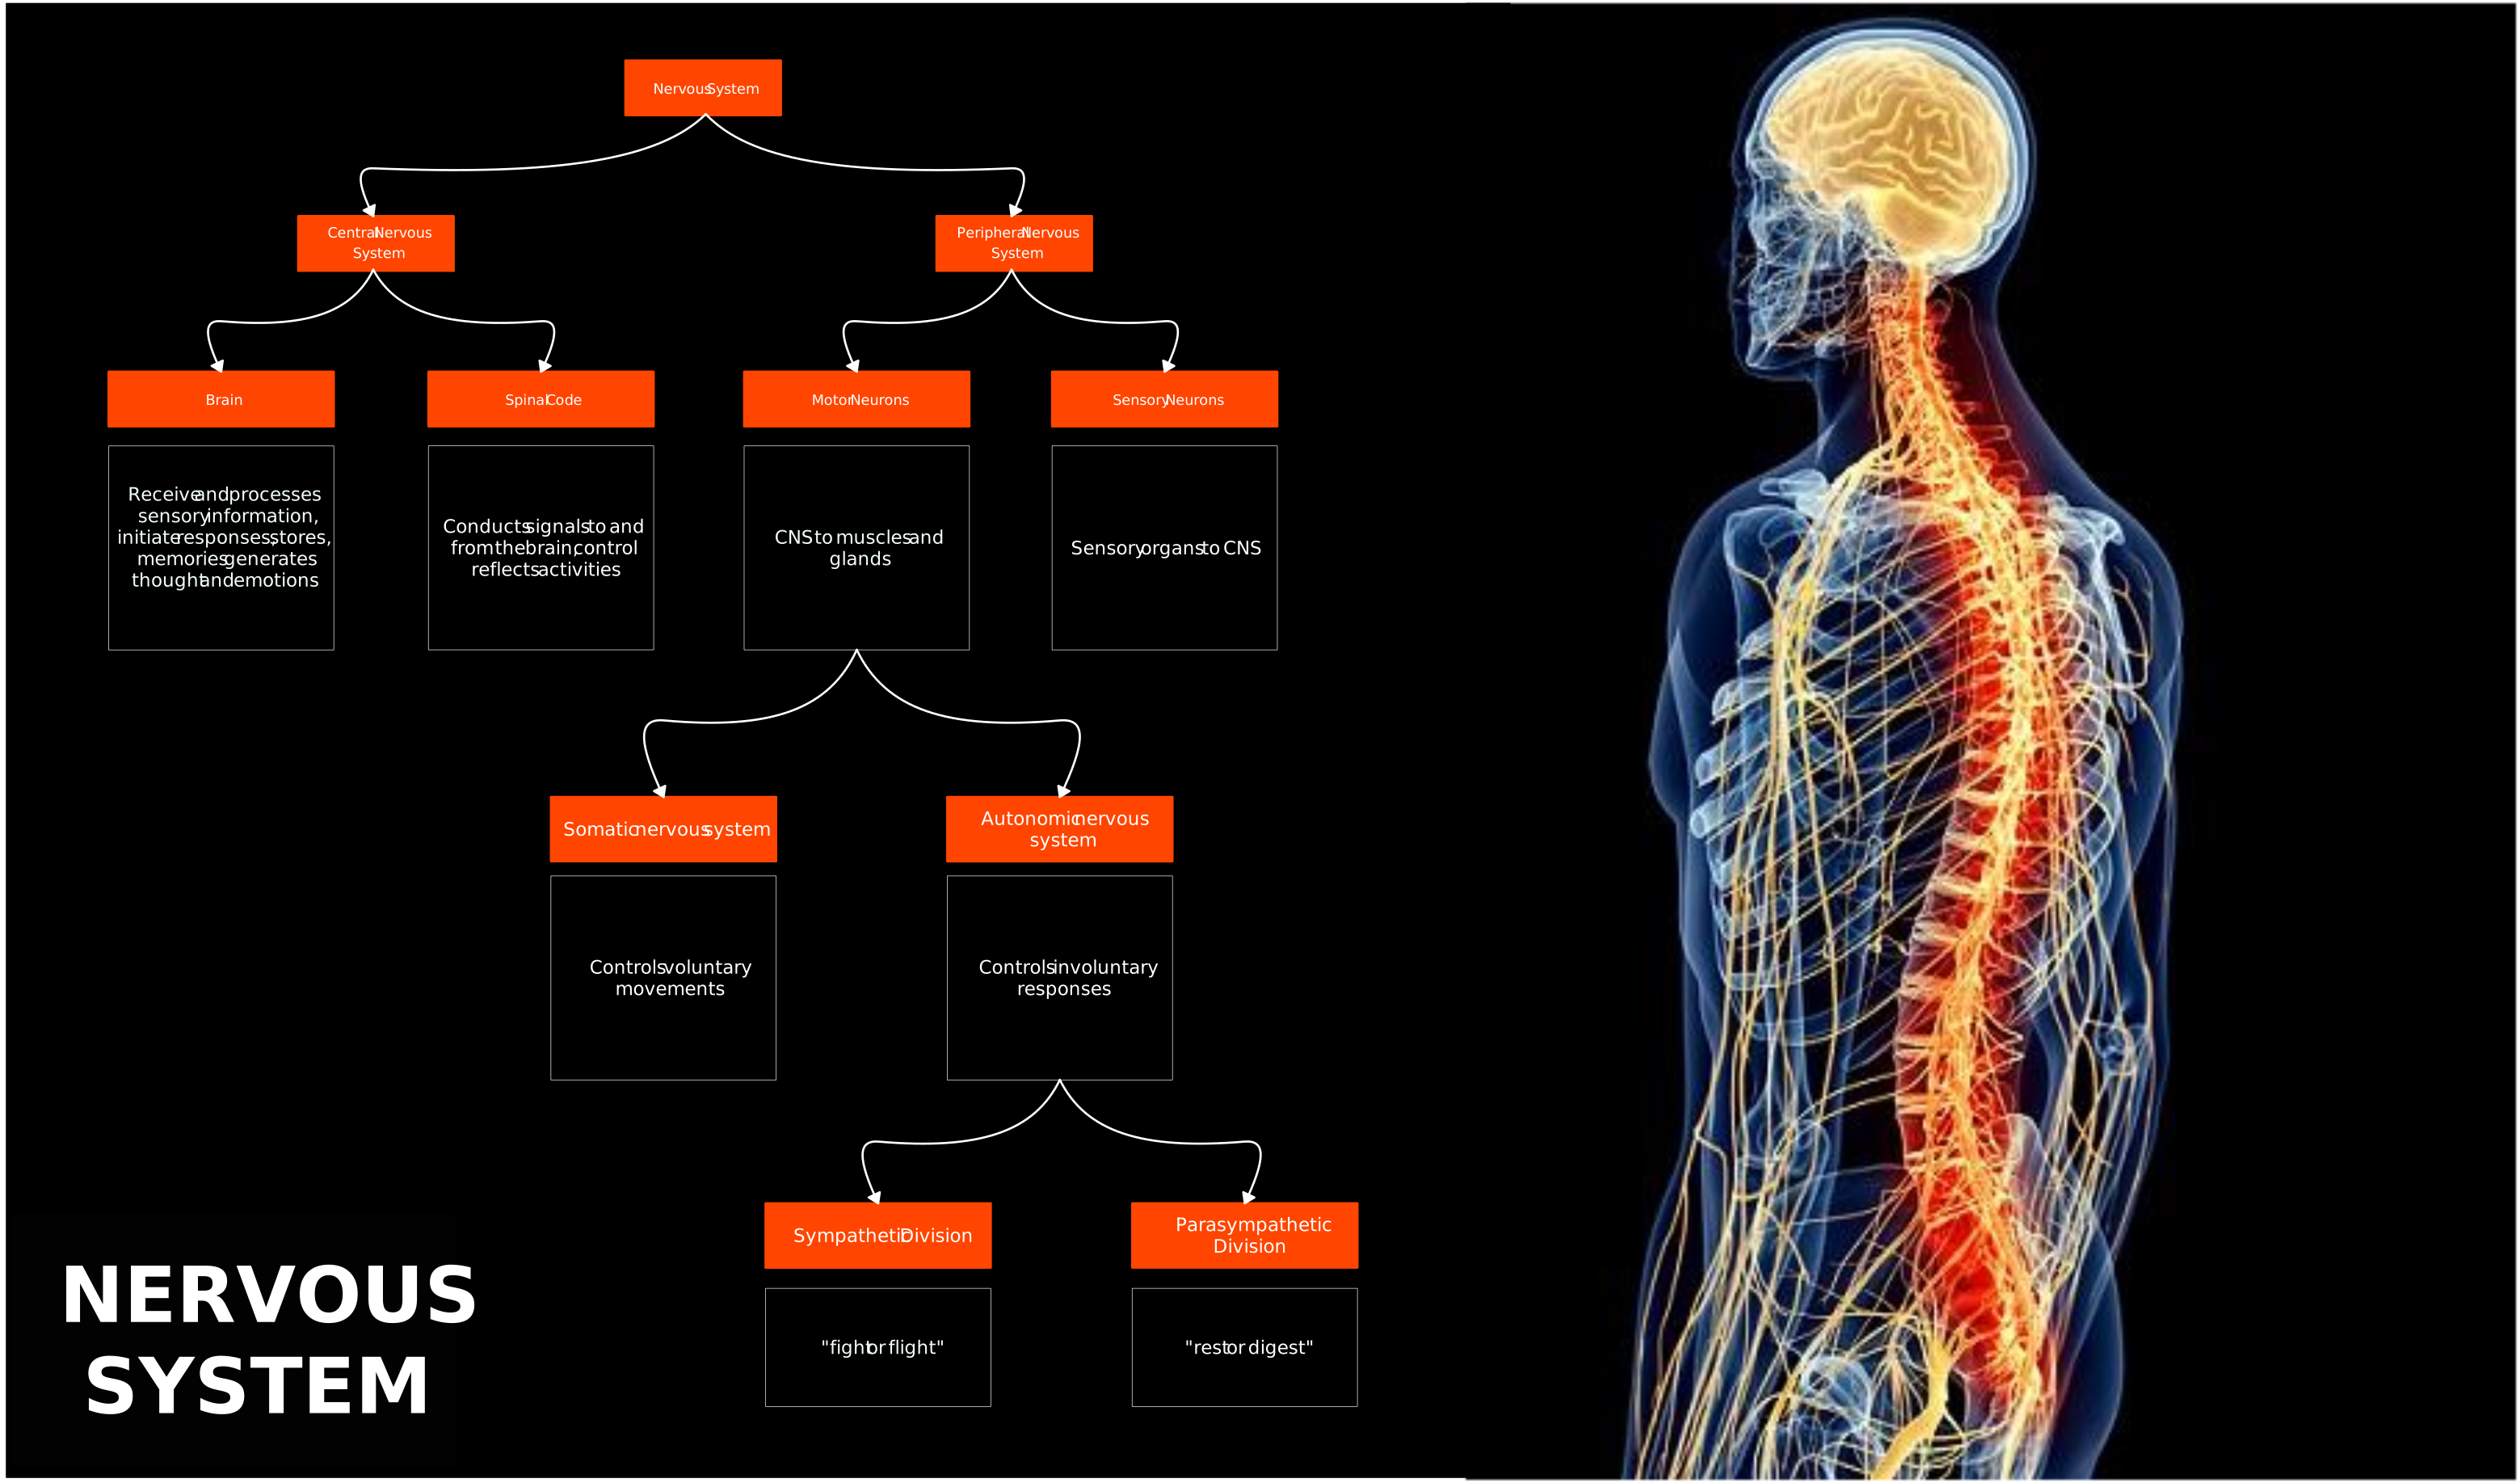
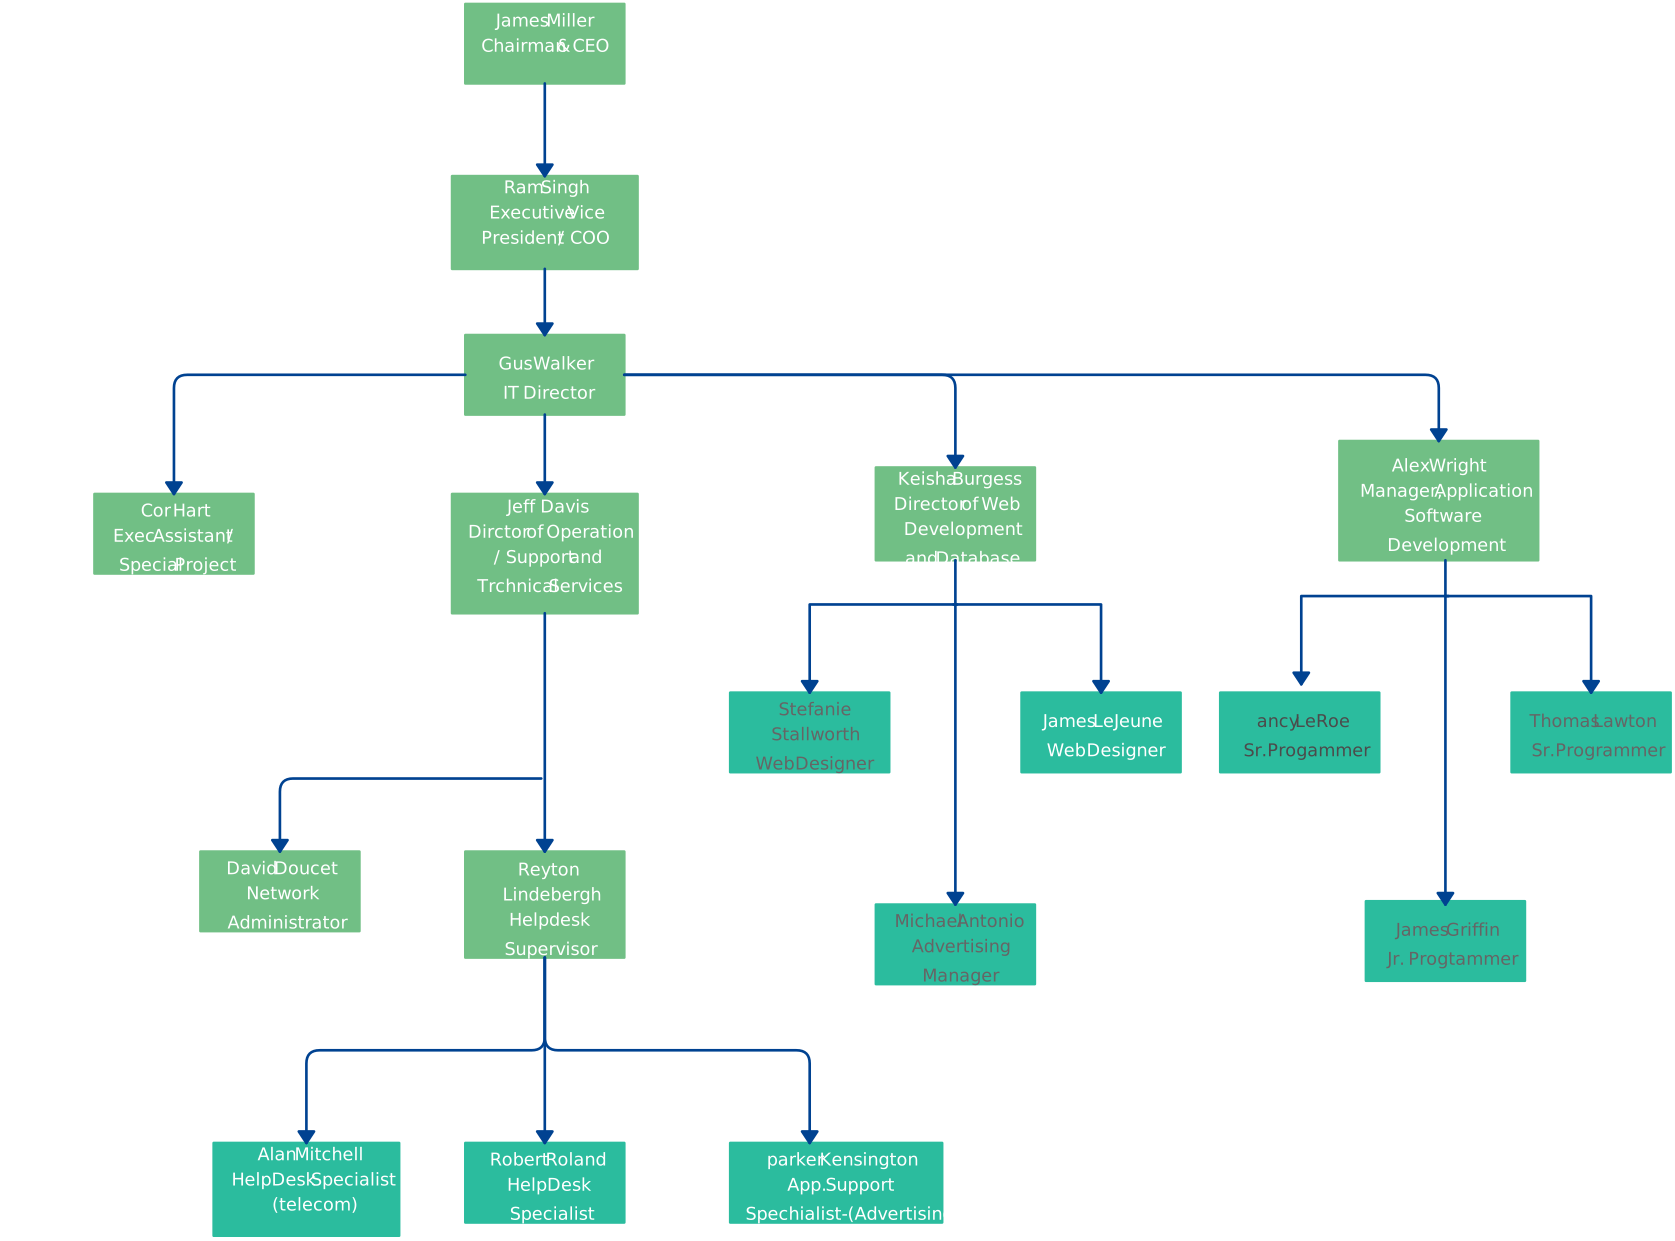
Try Creately’s Ready-Made Flowchart Templates for Quick & Easy Diagramming


Resources
Shneiderman, B. (1977) ‘Experimental investigations of the utility of detailed flowcharts in programming’, Communications of the ACM, 20(6), pp. 373–381. Available at: https://en.wikipedia.org/wiki/Ben_Shneiderman
Koylu, C. and Guo, D. (2017) ‘Design and evaluation of line symbolizations for origin–destination flow maps’, Information Visualization, 16(3), pp. 219–233. Available at: https://journals.sagepub.com/doi/full/10.1177/1473871616681375
Shneiderman, B. and Nassi, I. (1973) ‘Flowchart techniques for structured programming’, SIGPLAN Notices, 8(8), pp. 12–26. Available at: https://www.researchgate.net/publication/234805404_Flowchart_techniques_for_structured_programming
Kuo, Y.C. and Zhuo, M.J. (2024) ‘The effect of flipped classroom integrated with the POEWSQ learning model on programming learning’, Educational Technology & Society, 27(1), pp. 461–465. Available at: https://www.researchgate.net/publication/373995678_Effectiveness_and_utility_of_flowcharts_on_learning_in_a_classroom_setting_A_mixed_methods_study
Mukherjee, A., Garain, U. and Biswas, A. (2013) ‘Automatic text-to-diagram conversion: a novel teaching aid for the blind people’, Educational Technology & Society, 17(3), pp. 40–53. Available at: https://dl.acm.org/doi/abs/10.1504/IJAIP.2015.070343



Owen Parker
How could I show a nested loop in a flowchart? Any tips?
Amanda Athuraliya
Show each loop with its own decision point and flow path. The outer loop controls the first iteration, and inside that branch you place a second decision symbol for the inner loop before the process step. Use clear labels like “More items?” and “More values?” so the two loops are easy to distinguish. In Creately, you can keep the layout readable by using connectors, on-page connectors, and spacing the inner loop slightly to the right of the outer loop.