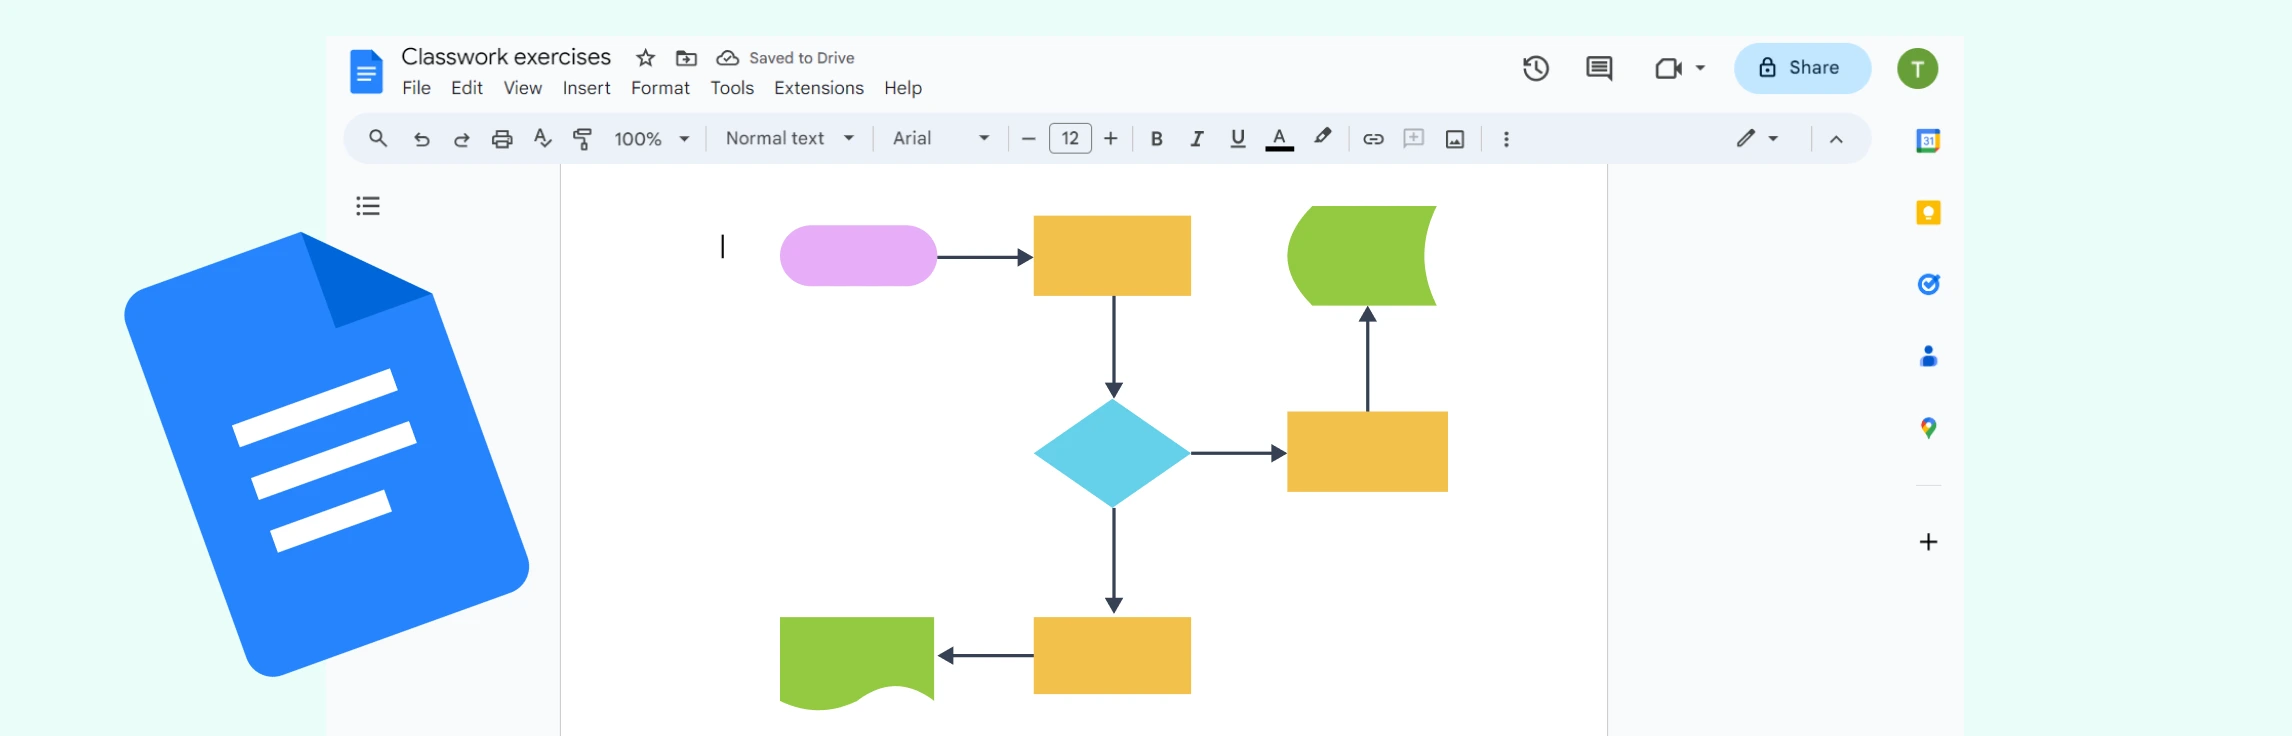
If you’ve been wondering “how do I make a flowchart in Google Docs”, then this is the guide for you. This tutorial covers how to build a flowchart in Google Docs in just six simple steps, go through the limitations, explore a better alternative, and compare its features to Google Docs.
What is a Flowchart?
A flowchart is a visual diagram that uses shapes, arrows, and text to illustrate the steps of a process. It helps map workflows, decisions, and task sequences in a clear, easy-to-understand format. Whether you’re documenting a business process, designing a system, or planning tasks, flowcharts make complex steps easier to visualize and communicate.
How to Create a Flowchart in Google Docs
Step 1: Open a Drawing Canvas in Google Docs
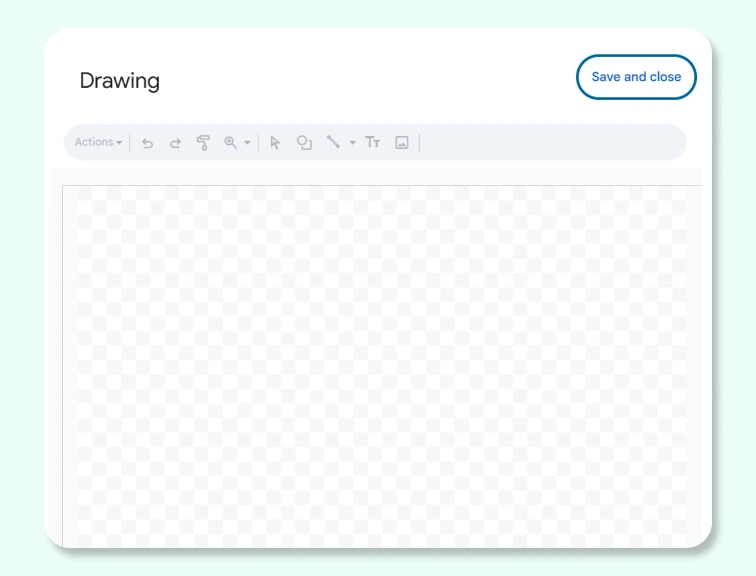
Start a new or existing document, then go to Insert → Drawing → + New to open the drawing editor.
Step 2: Add Flowchart Shapes
Click the Shapes icon and choose from Shapes, Arrows, or Flowchart symbols like process boxes or decision diamonds. Since Google Docs has only a basic set of shapes, you may need to manually adjust or recreate symbols that aren’t available. Read the flowchart symbols guide to learn about all the standard symbols that are used.
Step 3: Place and Duplicate Shapes
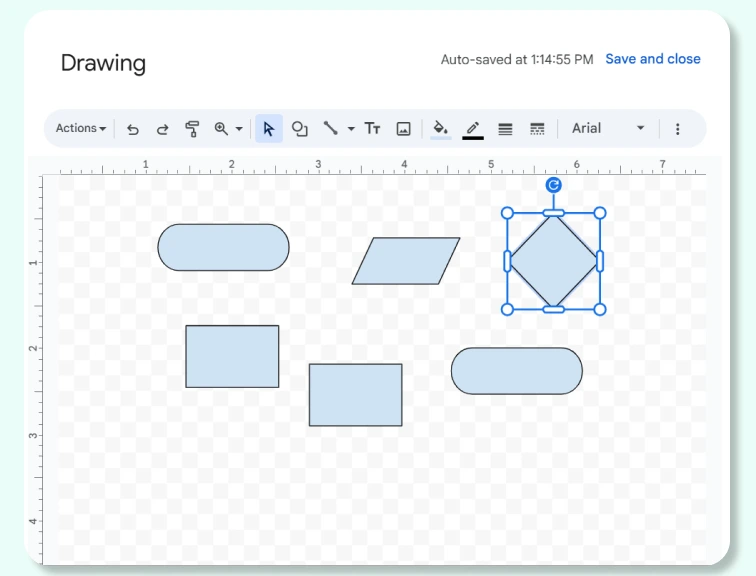
Click and drag to draw your first shape, then double-click to add text. Use Ctrl + D (Windows) or Cmd + D (Mac) to duplicate shapes for consistent sizing and formatting.
Step 4: Connect Shapes with Arrows
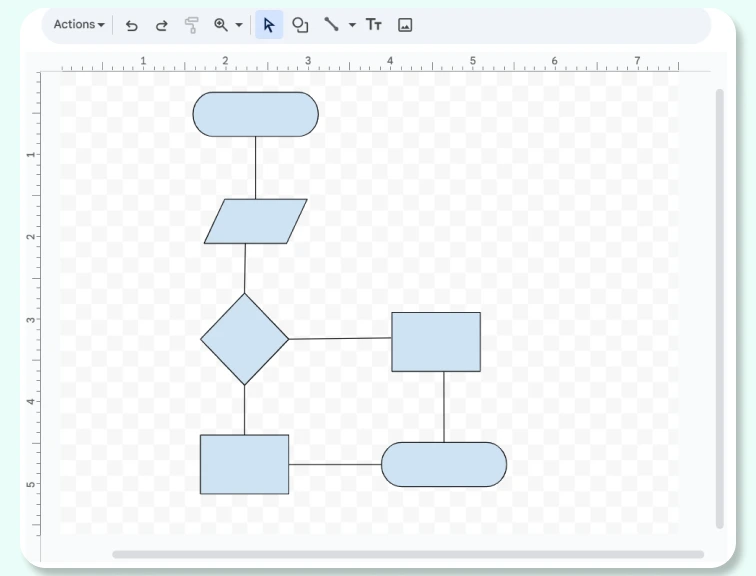
Select the Line tool → choose Arrow, then drag between shapes to show the process flow. Alignment can be tricky here, as Google Docs doesn’t have smart connectors that move with shapes automatically.
Step 5: Format the Diagram
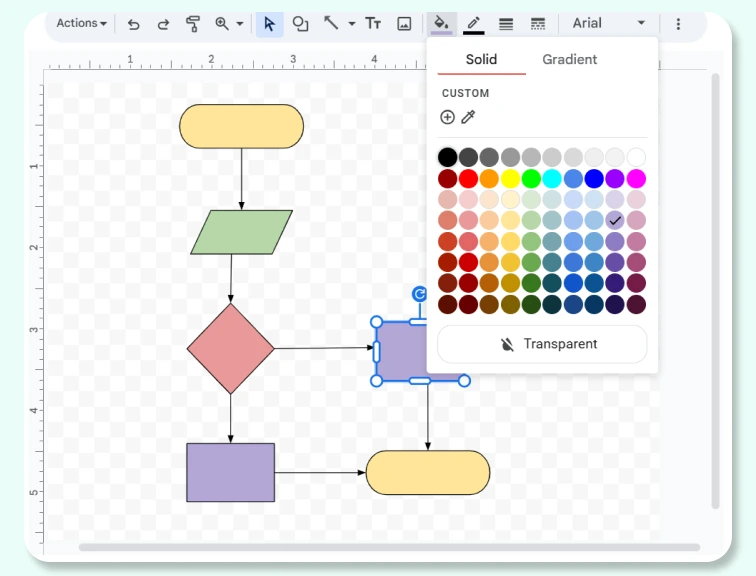
Customize colors, borders, fonts, and arrow styles using the toolbar to make your flowchart clear and visually aligned. Formatting options are limited compared to dedicated diagram tools, so complex flows may require extra manual adjustments.
Step 6: Save, Insert, and Share
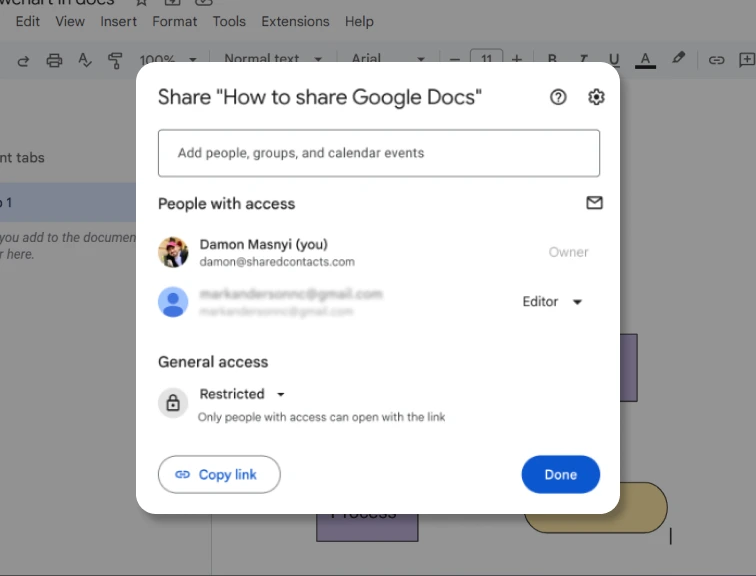
Click Save and Close to add the flowchart to your document. Use the Share button in the top-right corner to collaborate with your team. Remember that once inserted, the diagram has to be reopened in the Drawing popup for any edits.
Limitations of Making a Flowchart in Google Docs
Google Docs can handle simple diagrams, but it has several constraints that become noticeable as your flowchart grows in size or complexity:
No built-in flowcharting features: All diagrams must be created inside the separate Drawing popup, which interrupts the workflow and limits real-time editing.
Limited set of shapes and symbols: Only a basic collection of flowchart symbols is available, making it difficult to represent detailed or industry-standard processes.
No smart connectors: Arrows do not stay attached to shapes when you move them, so rearranging the diagram requires constant manual alignment.
Restricted styling and formatting options: Custom colors, fonts, line styles, and shapes are limited, which can make diagrams look inconsistent or require extra time to adjust.
Challenging to scale or update: Large flowcharts become hard to manage because the Drawing canvas doesn’t expand smoothly, and every edit requires reopening the editor.
Not ideal for team collaboration on diagrams: While Docs supports document collaboration, multiple people cannot co-edit the diagram itself in real time within the Drawing tool.
These limitations mean Google Docs works fine for quick, basic flowcharts, but it can feel restrictive the moment your diagram gets bigger or you need to collaborate smoothly. If you want something faster, more flexible, and built specifically for diagramming, a dedicated tool makes all the difference. And that’s exactly where Creately stands out.
Why Creately is the Best Alternative for Creating Flowcharts
If you want a smoother, more flexible way to build and manage flowcharts, try Creately’s flowchart software. Here’s what makes it the best alternative for making flowcharts.
Ease of Use & Editing Experience
No more fighting with pop-ups: Everything happens on a clean, infinite canvas with no separate Drawing window.
Smart connectors that actually stay connected: Move a shape and the arrows move with it automatically.
Faster to build, easier to update: Shapes snap, align, and adjust without manual fixes.
Templates & Standard Symbols
All the flowchart symbols you need: Full library of standard flowchart shapes.
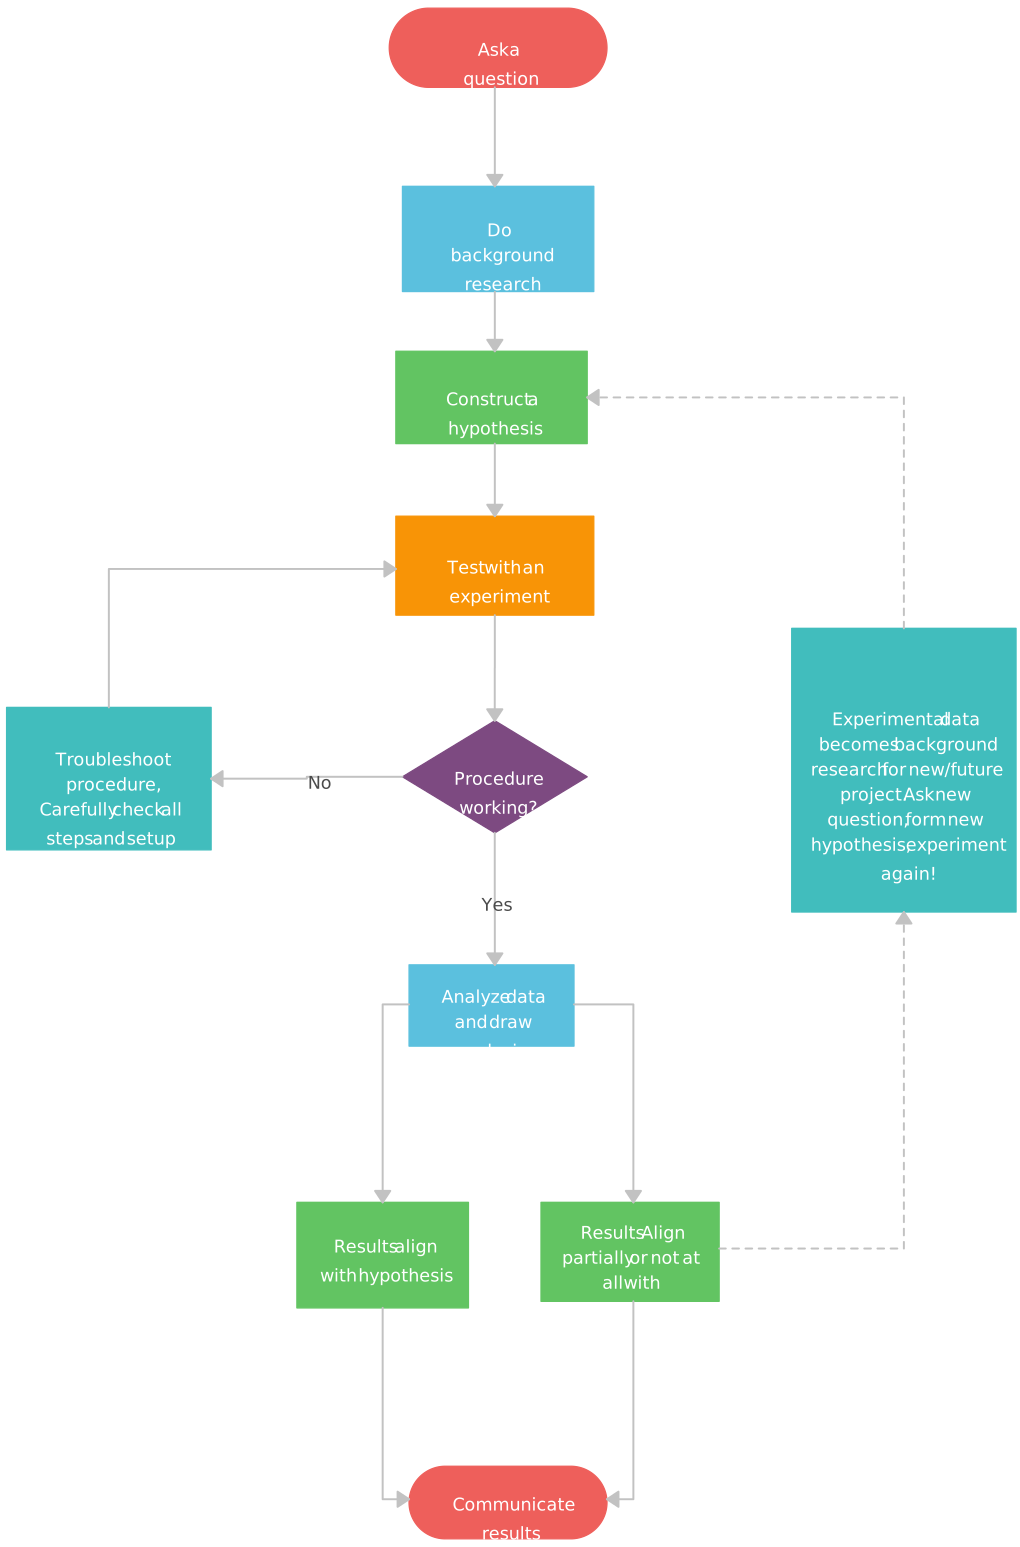
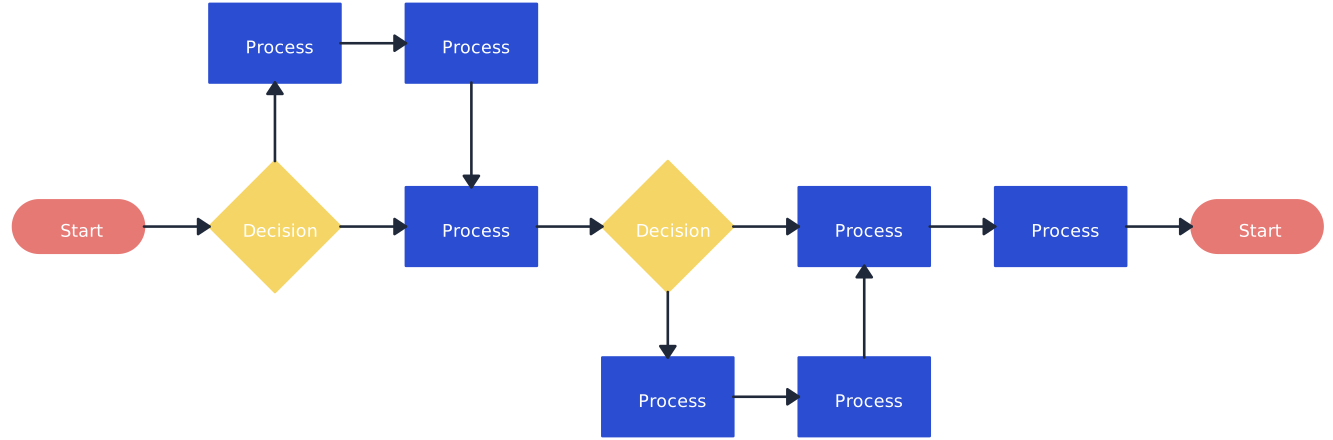
Ready-made flowchart templates: Start with templates for workflows, processes, decision trees, swimlanes, and more.
AI Flowchart Generator
Generate diagrams instantly: Start with AI-generated flowcharts from a simple prompt—no manual dragging or layout work required. Try Creately’s AI flowchart generator to build your first diagram in seconds.
Smart AI suggestions: Get automatic recommendations for missing steps, related actions, and logical groupings so your flow stays clear, organized, and complete.
Styling & Visual Quality
Looks polished automatically: Themes and styling tools help you create professional diagrams with minimal effort.
Consistent formatting every time: Auto-alignment, spacing guides, and reusable style presets keep diagrams clean and uniform.
Collaboration & Teamwork
Built for teamwork: Multiple people can edit, comment, and collaborate in real time with no lag or version conflicts.
Centralized workspace: Keep diagrams, notes, feedback, and related documents in one shared space so teams always stay aligned.
Scalability & Flexibility
Scales as your process grows: The infinite canvas supports simple to highly complex workflows.
Perfect for end-to-end process documentation: You can map a workflow, attach supporting diagrams, and build step-by-step SOPs side by side without switching tools.
Creately Vs Google Docs: Flowchart Features Comparison
Before you choose where to build your flowchart, it helps to see how the Google Docs flowchart features stack up against a purpose-built tool like Creately. Here’s a quick side-by-side comparison.
Feature | Google Docs | Creately |
Flowchart Symbols | Basic set only | Full library of standard flowchart symbols |
Smart Connectors | Not available (arrows don’t stay attached) | Auto-adjusting connectors that move with shapes |
Editing Experience | Requires a separate Drawing popup | Direct editing on an infinite canvas |
Styling & Formatting | Limited colors, shapes, and line options | Advanced styling, themes, and custom formatting |
Templates | No built-in templates | Multiple ready-made flowchart templates |
Collaboration | Document is collaborative, but diagrams aren’t | Real-time co-editing, comments, and multi-cursor presence |
Scalability | Small canvas; large diagrams get hard to manage | Infinite canvas for simple to complex workflows |
Export Options | Basic image export only | PNG, SVG, PDF, and embeddable formats |
Linking & Embedding | No diagram linking | Link flowcharts to SOPs, process maps, and related diagrams |
Usability for Process Documentation | Suitable only for simple flows | Ideal for detailed, interconnected process documentation |
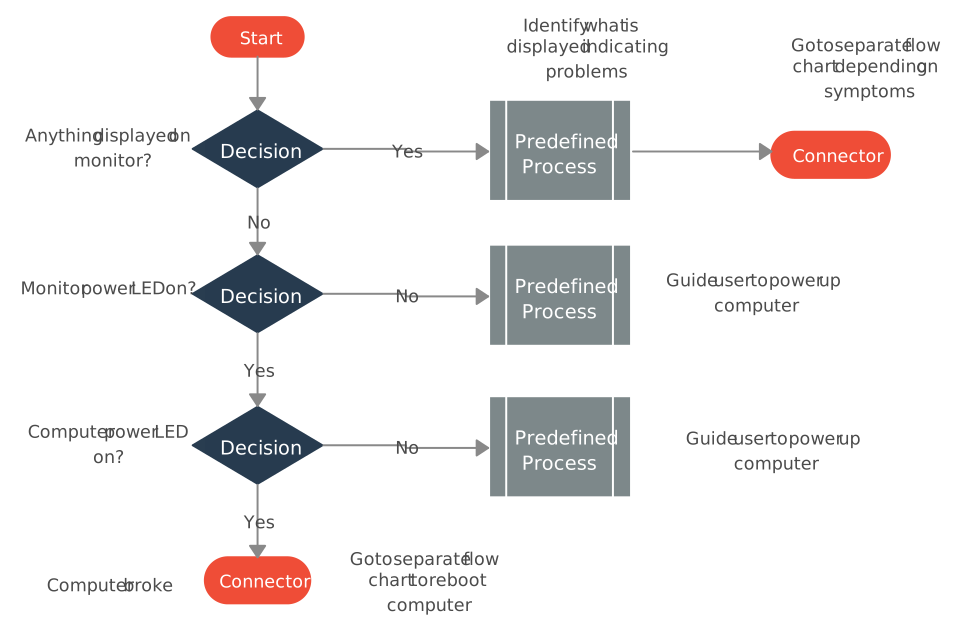
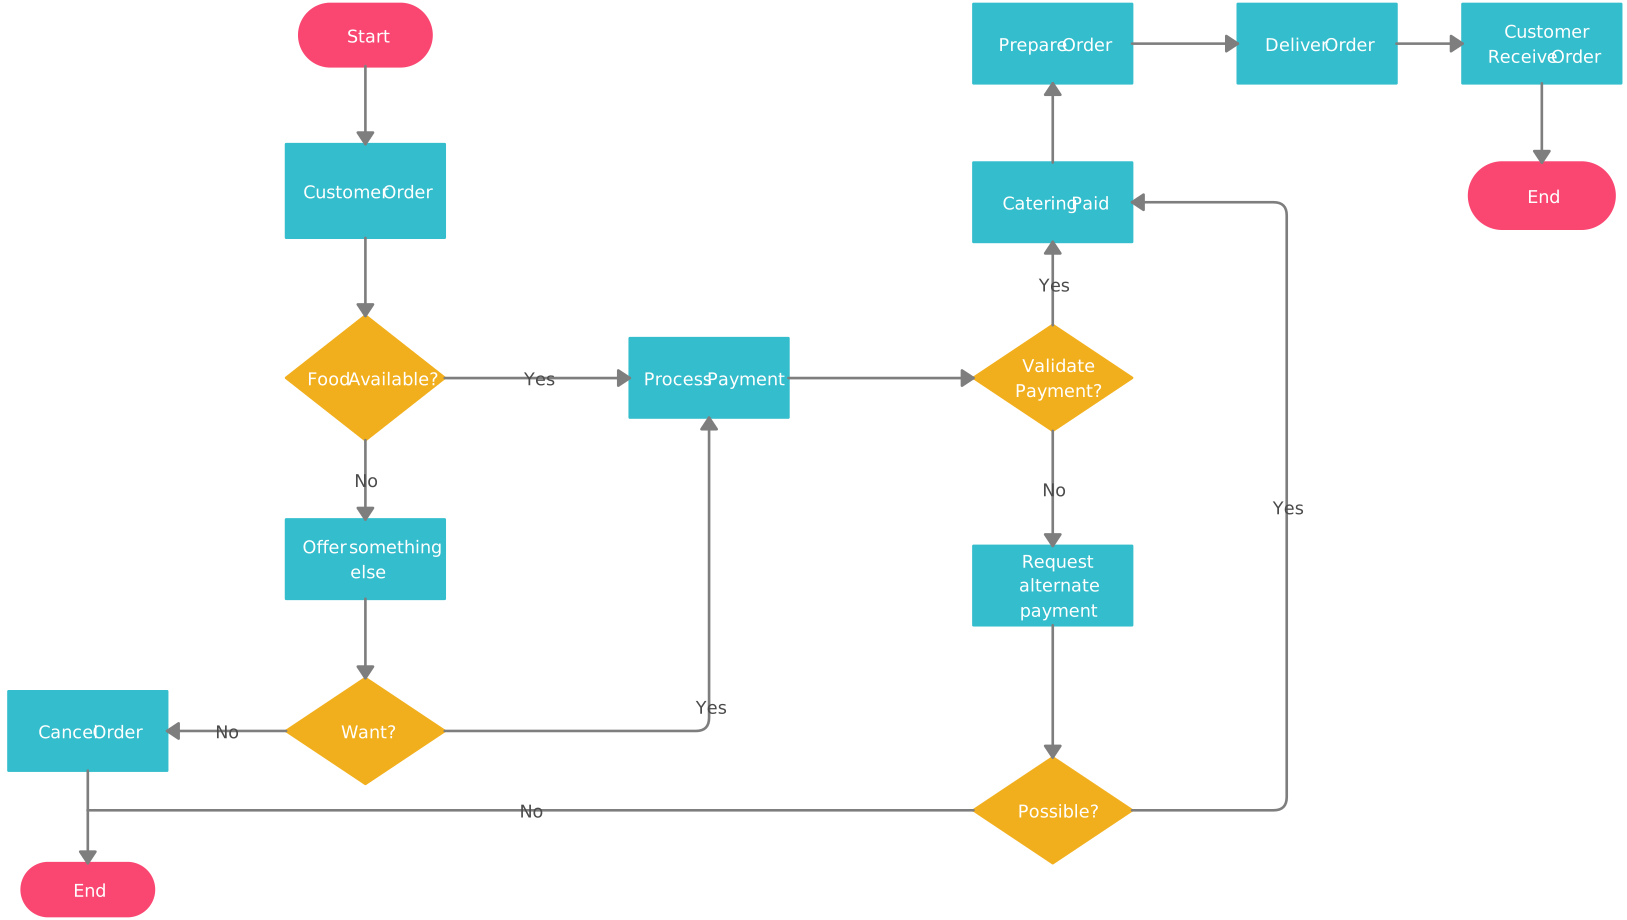
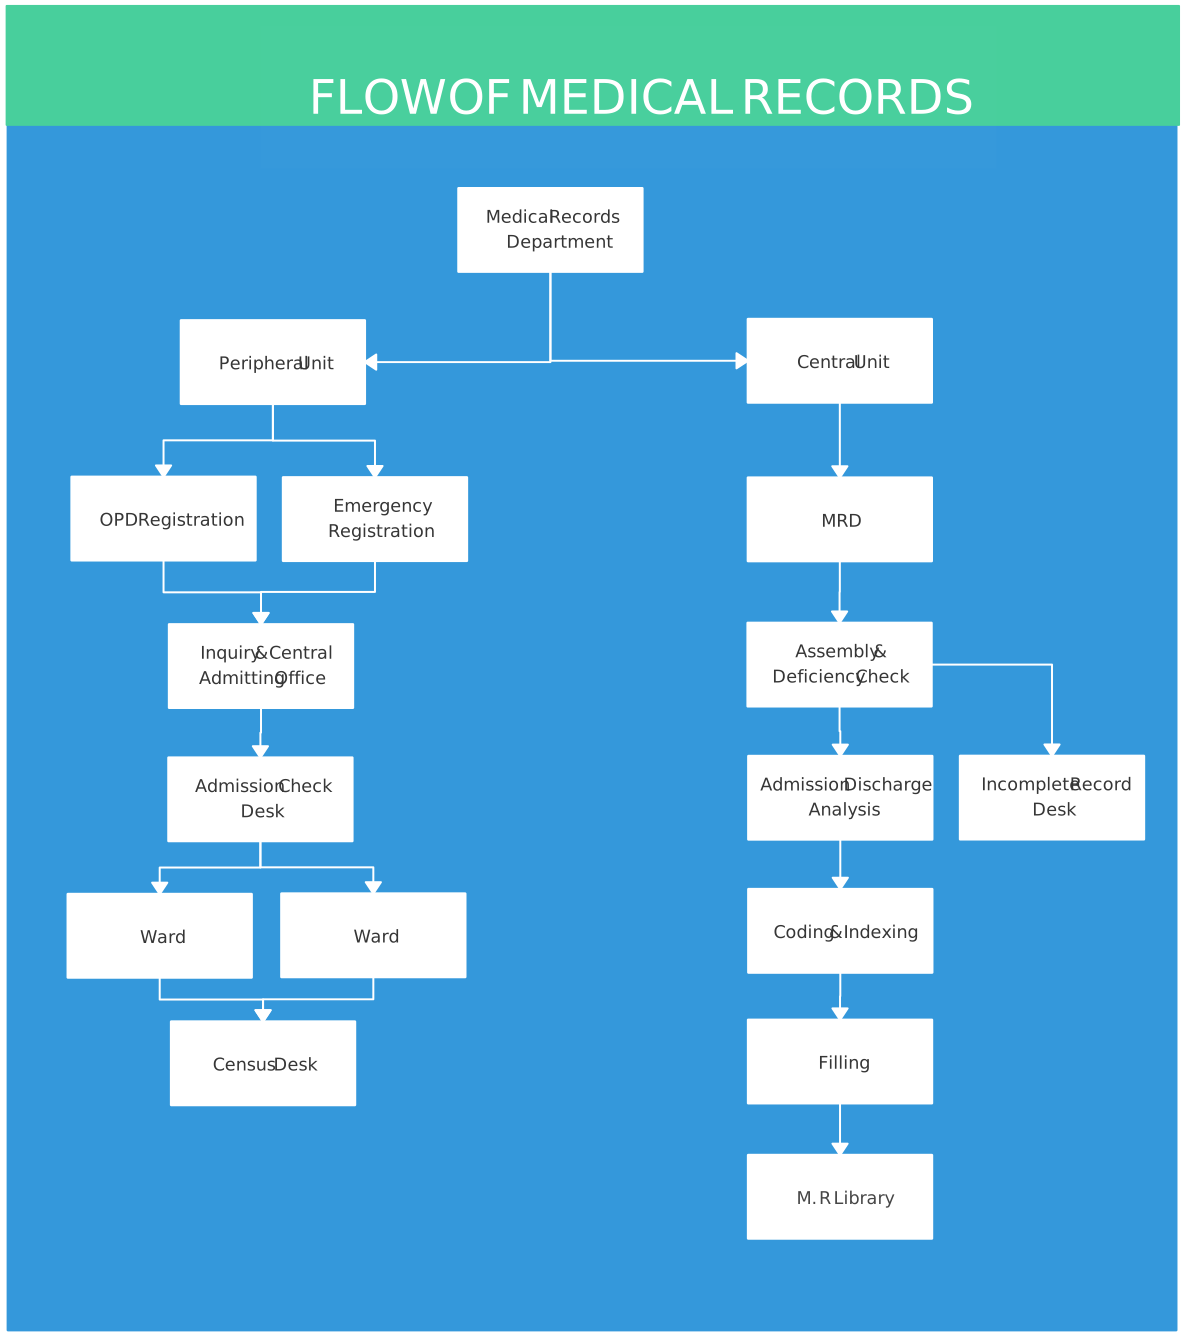
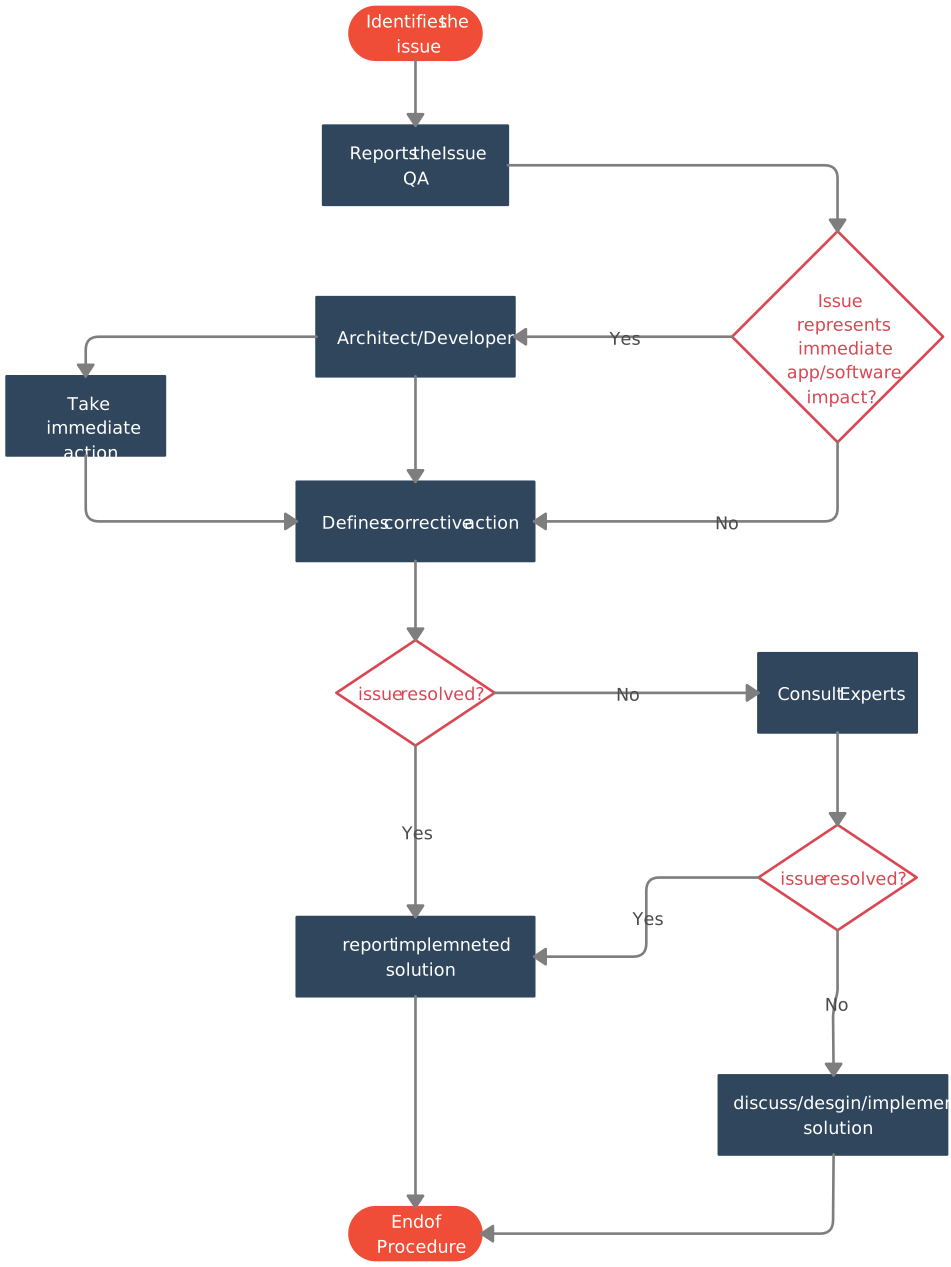
Free Flowchart Templates to Get Started


Helpful Resources for Making Flowcharts
A step-by-step guide to making flowcharts in Microsoft Word.
A step-by-step guide to making flowcharts in Microsoft PowerPoint.
Learn which symbols to use and best practices for using them when creating flowcharts.
Discover the flowchart creator tool to visualize your workflows.