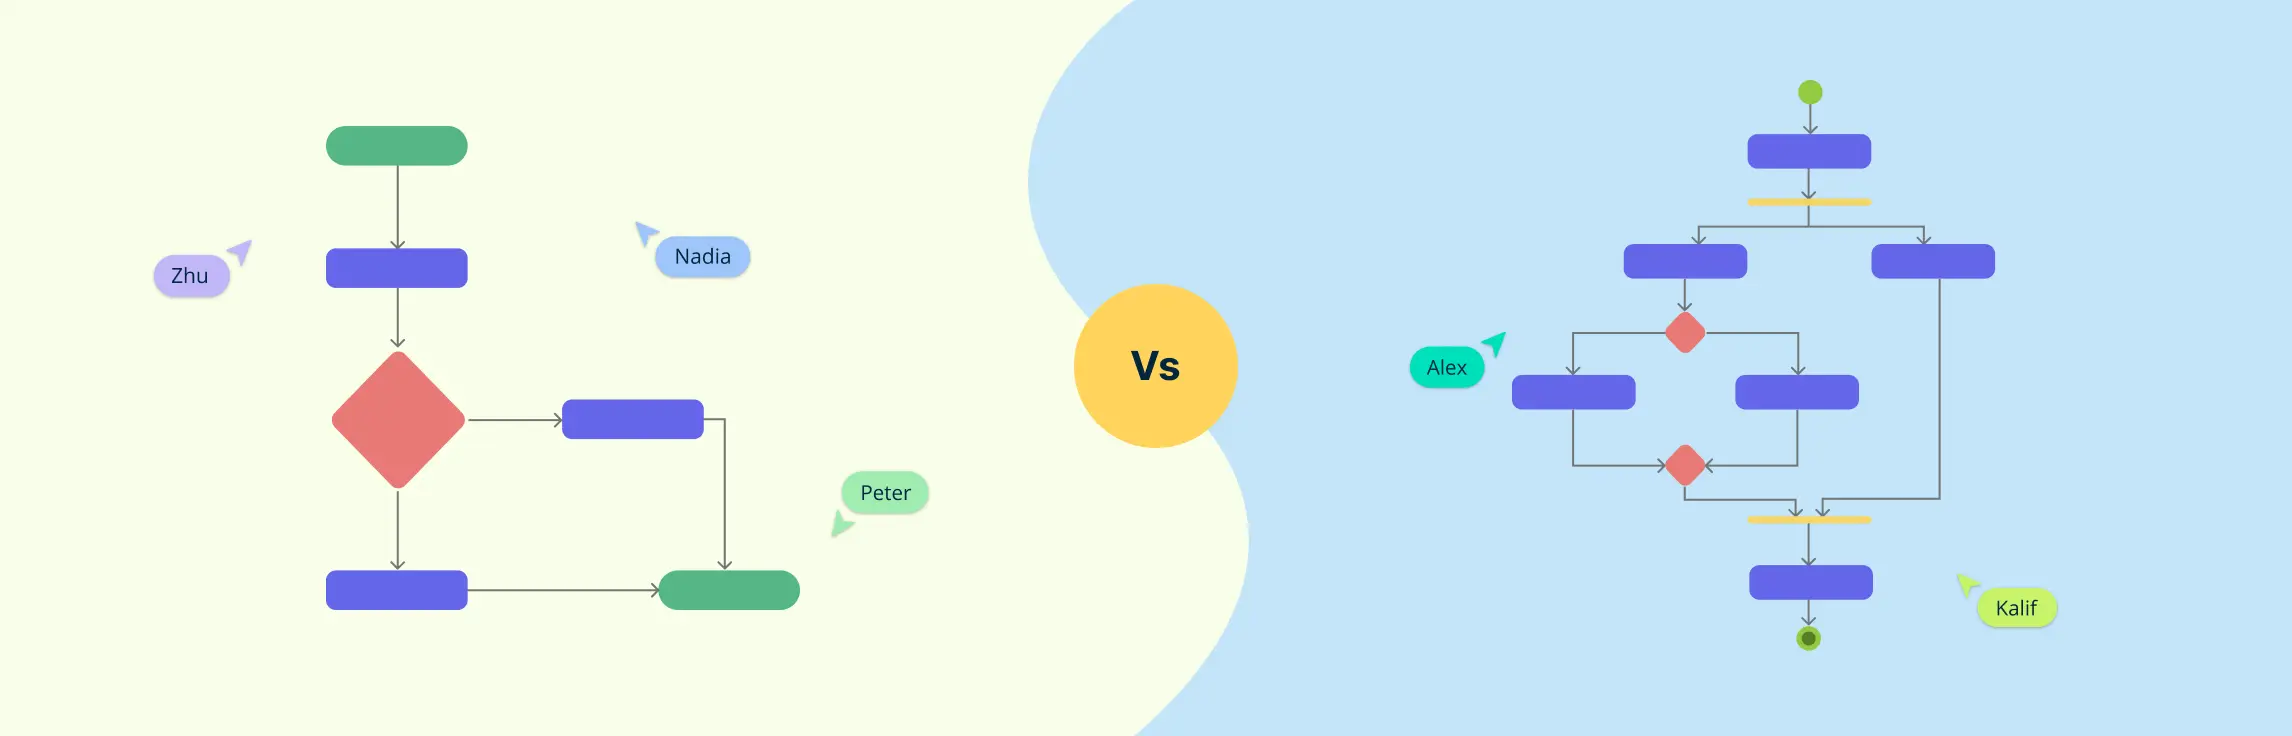
When mapping out processes, whether for business, software development, or everyday workflows, visual diagrams make things clearer. Two commonly used tools for this are flowcharts and activity diagrams. At first glance, they may seem similar—both show steps in a process—but they serve different purposes and are used in different fields.
If you’ve ever wondered when to use a flowchart and when an activity diagram is the better choice, this guide on flowchart vs activity diagram will help. We’ll break down their differences in a simple, practical way so you can confidently choose the right one for your needs.
Flowchart vs Activity Diagram: Quick Overview
Flowcharts are great for simple processes, while activity diagrams handle complex, concurrent workflows. Here’s a quick comparison of flowcharts vs activity diagrams:
| Aspect | Flowchart | Activity Diagram |
| Definition | Visualizes a process step-by-step. | Models workflows in a system or process. |
| Purpose | Used for process mapping and problem-solving. | Used for system behavior and process modeling. |
| Notation | Standard flowchart symbols (ovals, rectangles, diamonds). | UML-specific symbols (activities, forks, joins). |
| Concurrency | Mostly sequential processes. | Supports parallel/concurrent processes. |
| Standardization | No strict standard, varies by use. | Follow UML standards. |
| Use Cases | Business workflows, education, algorithms. | Software modeling, system workflows. |
What Are the Differences Between Flowcharts and Activity Diagrams
Flowcharts and activity diagrams are both tools used to visualize processes, but they serve different purposes and are used in different fields. Let’s explore their differences in a way that makes sense.
1. Purpose and Use Cases
Flowcharts are general-purpose diagrams used to represent any step-by-step process, from business workflows to simple algorithms. They help break down a process into easy-to-understand steps, making them useful for business professionals, students, and project managers.
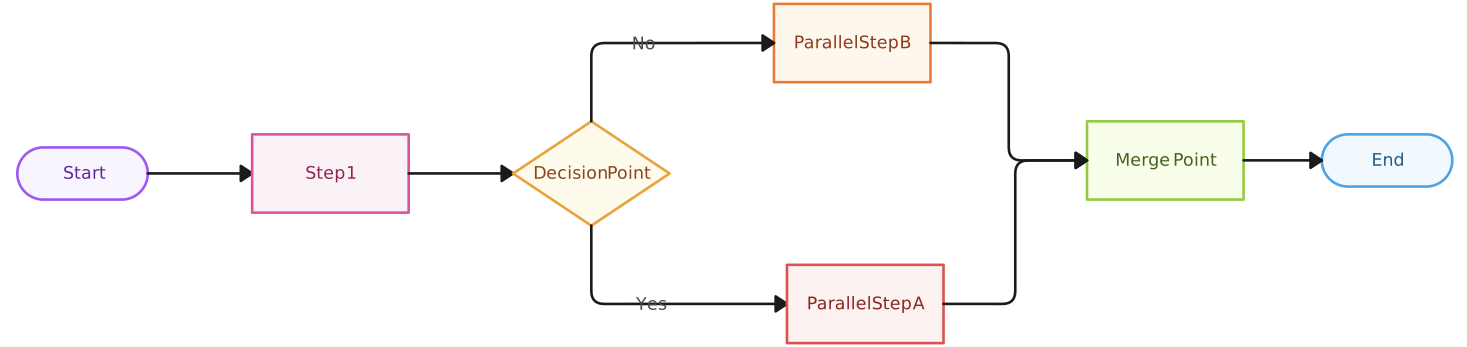

Activity diagrams, on the other hand, are part of the Unified Modeling Language (UML) and are specifically designed for modeling workflows in software systems. They are commonly used by software engineers and system designers to understand how different parts of a system interact and how processes flow between them.
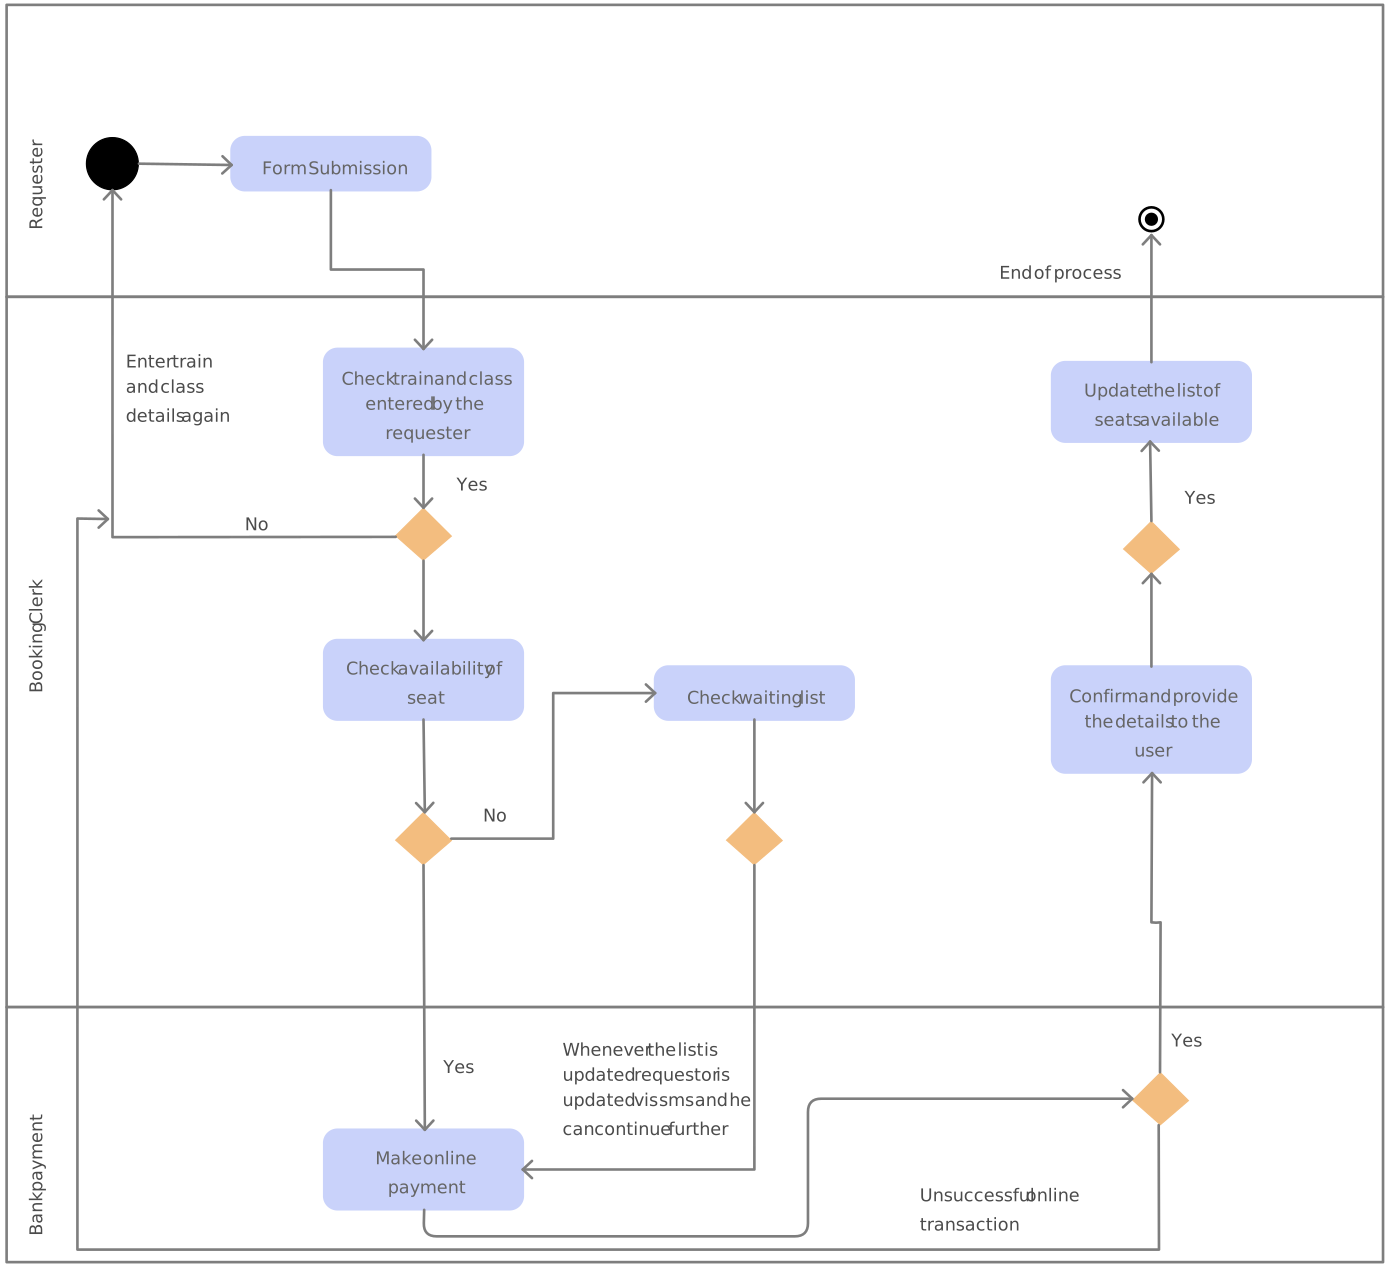
Example:
- A flowchart might be used by a restaurant to map out the steps for handling customer orders.
- An activity diagram might be used to show how an online shopping system processes a payment.
2. Symbols and Notation
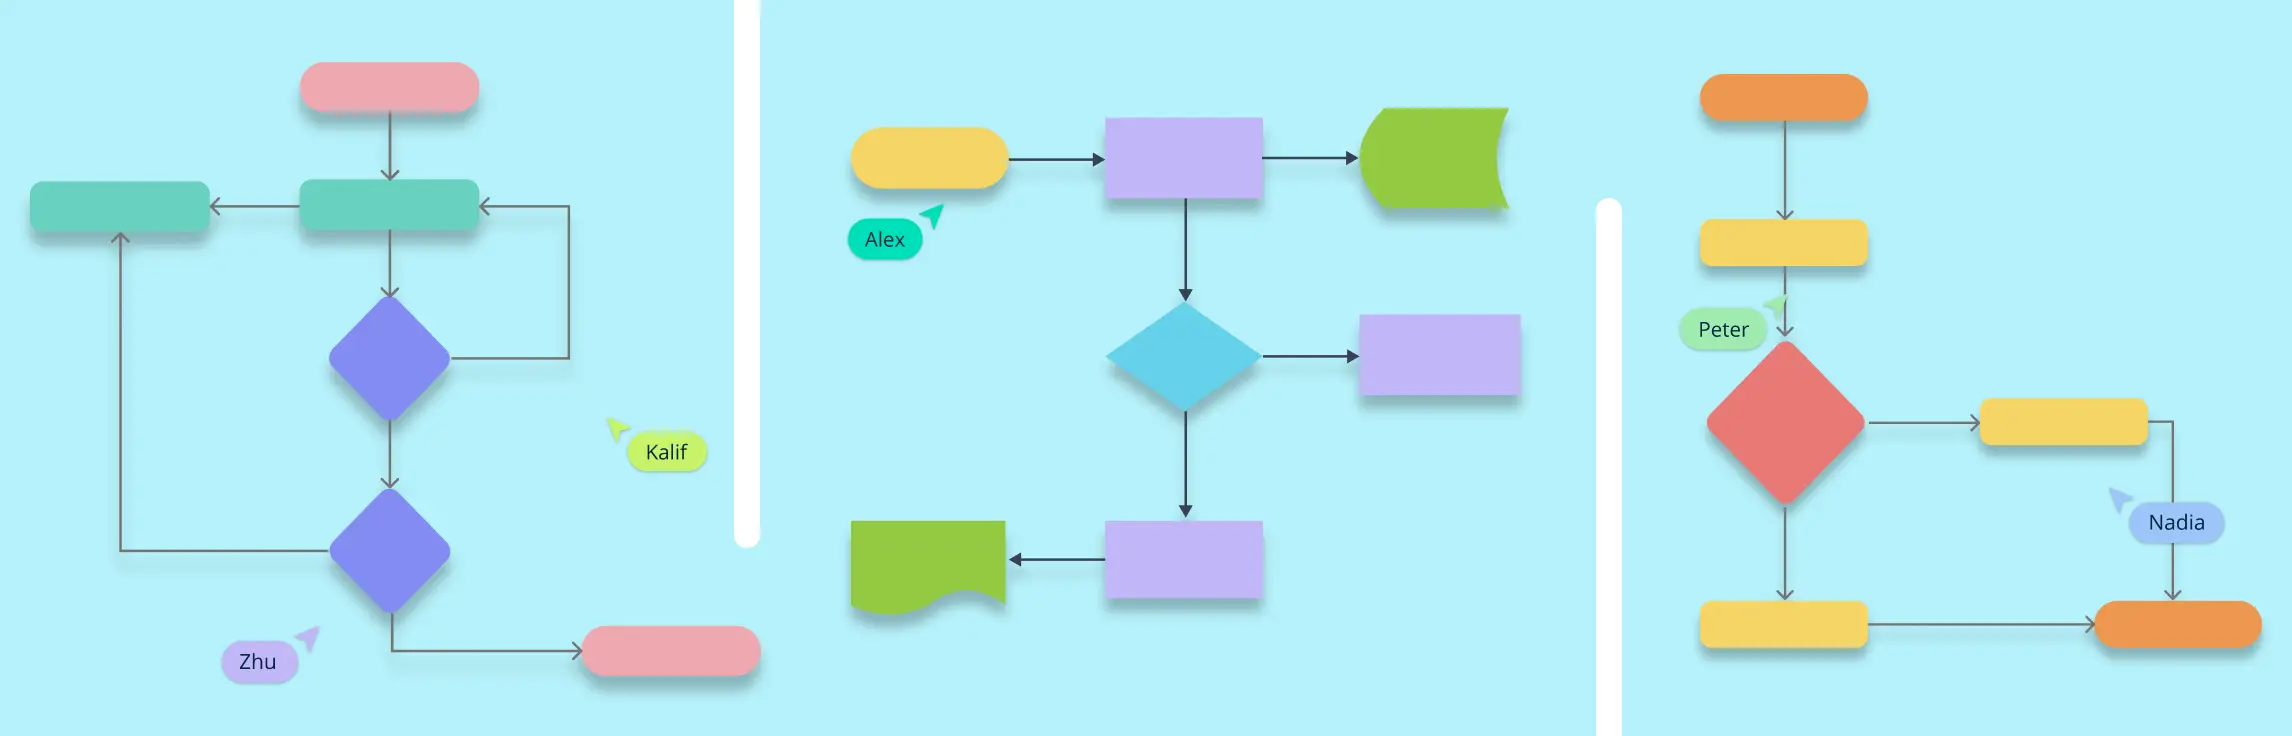
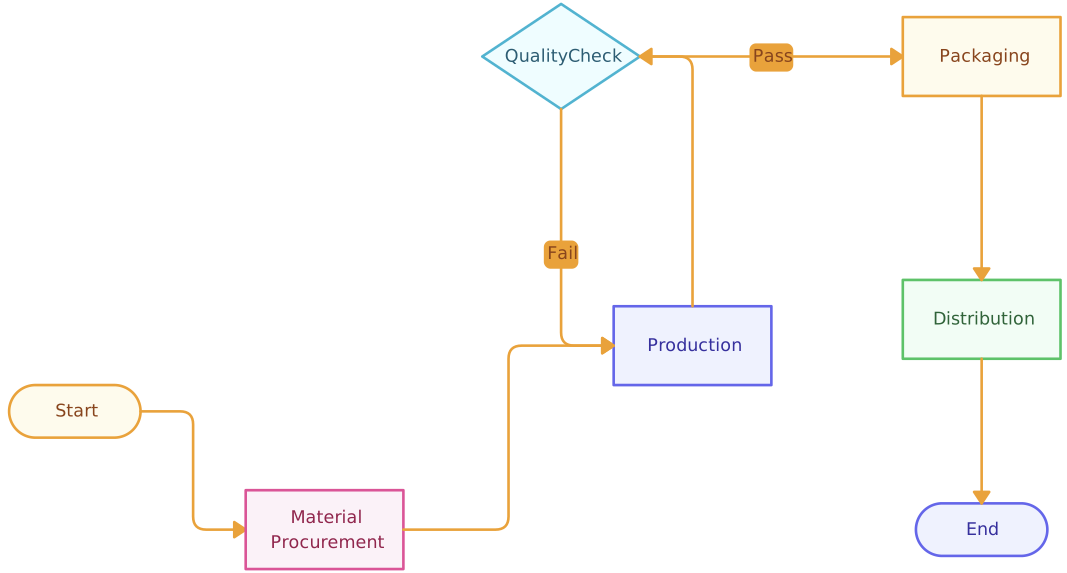
Flowchart symbols include simple shapes like:
- Ovals for start and end points
- Rectangles for process steps
- Diamonds for decision points
- Arrows to indicate the flow of steps
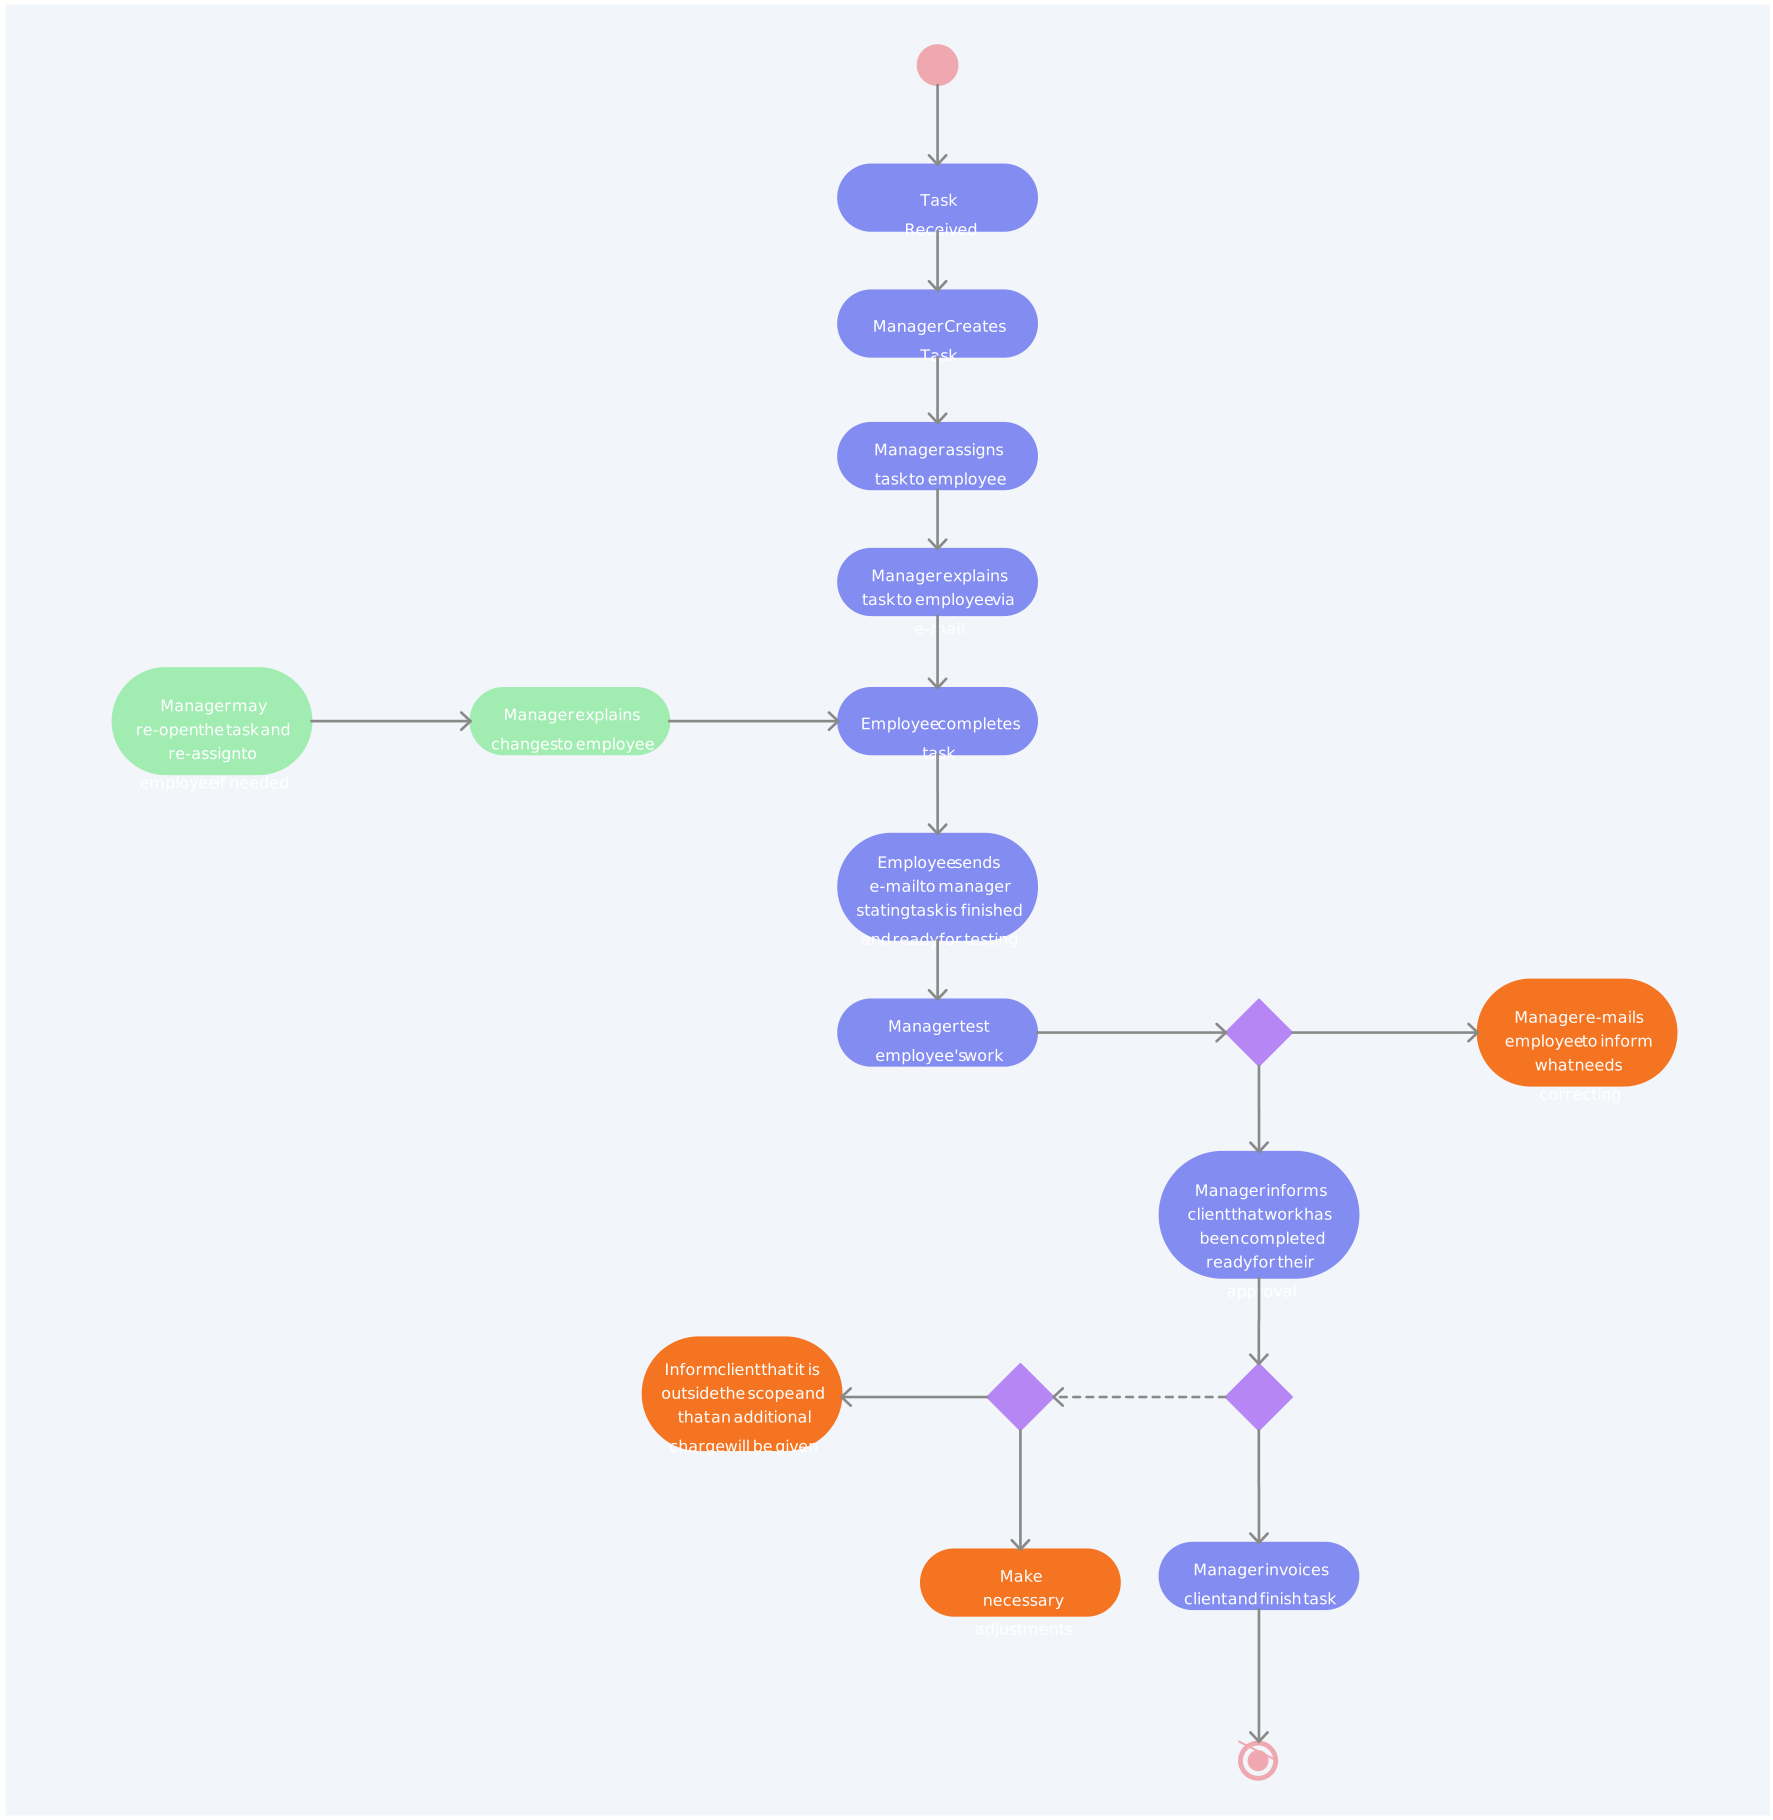
Activity diagrams use more advanced UML symbols, such as:
- Rounded rectangles for activities (actions or tasks)
- Diamonds for decision points
- Fork and join bars to show parallel processes
- Swimlanes to assign tasks to different roles or departments
Example:
- In a flowchart, you might see a decision diamond asking, “Is payment successful?” followed by “Yes” or “No” branches.
- In an activity diagram, the same decision could be placed inside a structured flow that includes multiple users and systems interacting at the same time.
3. Sequential vs. Concurrent Processes
One major limitation of flowcharts is that they work best for simple, step-by-step (sequential) processes. They aren’t ideal for showing multiple things happening at the same time.
Activity diagrams, however, are designed to handle complex workflows where multiple activities happen simultaneously. They can show parallel processes, making them useful for real-world systems where multiple users or systems interact.
Example:
- A flowchart for an online order might show a linear process: “Add item to cart → Checkout → Payment → Order confirmed.”
- An activity diagram could show how a system handles multiple things at once, such as sending an email confirmation while also updating inventory and notifying the shipping department.
4. Standardization and Complexity
Flowcharts don’t follow a strict standard, meaning different people or companies may use slightly different symbols or formats. This makes them flexible but sometimes inconsistent.
Activity diagrams follow the UML standard, meaning they use a structured format that is recognized globally for types of UML diagrams. This makes them more precise but also a bit more complex to learn and use.
Example:
- A flowchart can be drawn in different styles based on preference.
- An activity diagram must follow UML rules to ensure it is understood correctly by software developers and system architects.
5. Who Uses Them?
- Flowcharts are widely used in business, education, project management, and general problem-solving. They’re a go-to tool for explaining processes to people without technical backgrounds.
- Activity diagrams are mostly used in software engineering and system design, where complex interactions between different components need to be visualized.
What Are the Similarities Between a Flowchart and Activity Diagram
Flowcharts and activity diagrams are both visual tools used to represent processes, and they share several similarities:
1. Both help visualize processes
One of the biggest similarities between flowcharts and activity diagrams is that they both graphically represent a process or workflow. Instead of reading a long, text-based explanation, people can quickly grasp how a process works by looking at a diagram.
Example:
- A flowchart can show the step-by-step process of troubleshooting a computer issue.
- An activity diagram can illustrate how a customer interacts with an online shopping system from login to checkout.
In both cases, the diagrams provide a clear and structured way to understand the flow of actions.
2. Both use decision points to show different paths
Flowcharts and activity diagrams both include decision points where different choices lead to different outcomes. This is useful for mapping out processes that have multiple possible directions based on conditions.
3. Both show the flow of actions sequentially
Flowcharts and activity diagrams use arrows to indicate the flow from one step to the next. This makes it easy to follow the logical progression of activities.
4. Both help identify bottlenecks and inefficiencies
Since both diagrams break down processes into individual steps, they help businesses and teams analyze inefficiencies, redundancies, and areas for improvement.
Example:
- A flowchart of a manual invoice approval process might reveal unnecessary steps that slow things down.
- An activity diagram for a software application might highlight delays in data processing or parallel activities that cause conflicts.
By mapping out processes visually, teams can make better decisions about optimizing workflows.
5. Both are used in business and technology
While activity diagrams are more common in software development, and flowcharts are widely used in business, both can be used across different fields. Engineers, business analysts, educators, and project managers all rely on these tools to document and improve processes.
Flowchart: Definition, Purpose and Uses
A flowchart is a visual representation that maps out the steps of a process or system using standardized symbols connected by arrows. This diagrammatic approach provides a clear and concise way to understand complex procedures, making it easier to analyze, design, document, or manage processes across various fields.

Purpose of flowcharts
The primary purposes of flowcharts include:
Process visualization: They offer a clear depiction of how a process unfolds, making it easier to comprehend the sequence of actions.
Problem solving: By laying out each step, flowcharts help identify inefficiencies, redundancies, or potential problem areas within a process.
Documentation: They serve as valuable tools for process documentation, ensuring consistency and clarity in operations.
Communication: Flowcharts facilitate better understanding among team members, stakeholders, or clients by providing a straightforward visual representation of processes.
Common use cases for flowcharts
Flowcharts are utilized in various scenarios, such as:
Business process mapping: Documenting workflows to enhance efficiency and identify improvement areas.
Software development: Designing algorithms and program logic before actual coding begins.
Project management: Planning tasks and timelines to ensure project milestones are met.
Decision making: Outlining possible outcomes based on different decision paths to aid in strategic planning.
Activity Diagram: Definition, Purpose and Uses
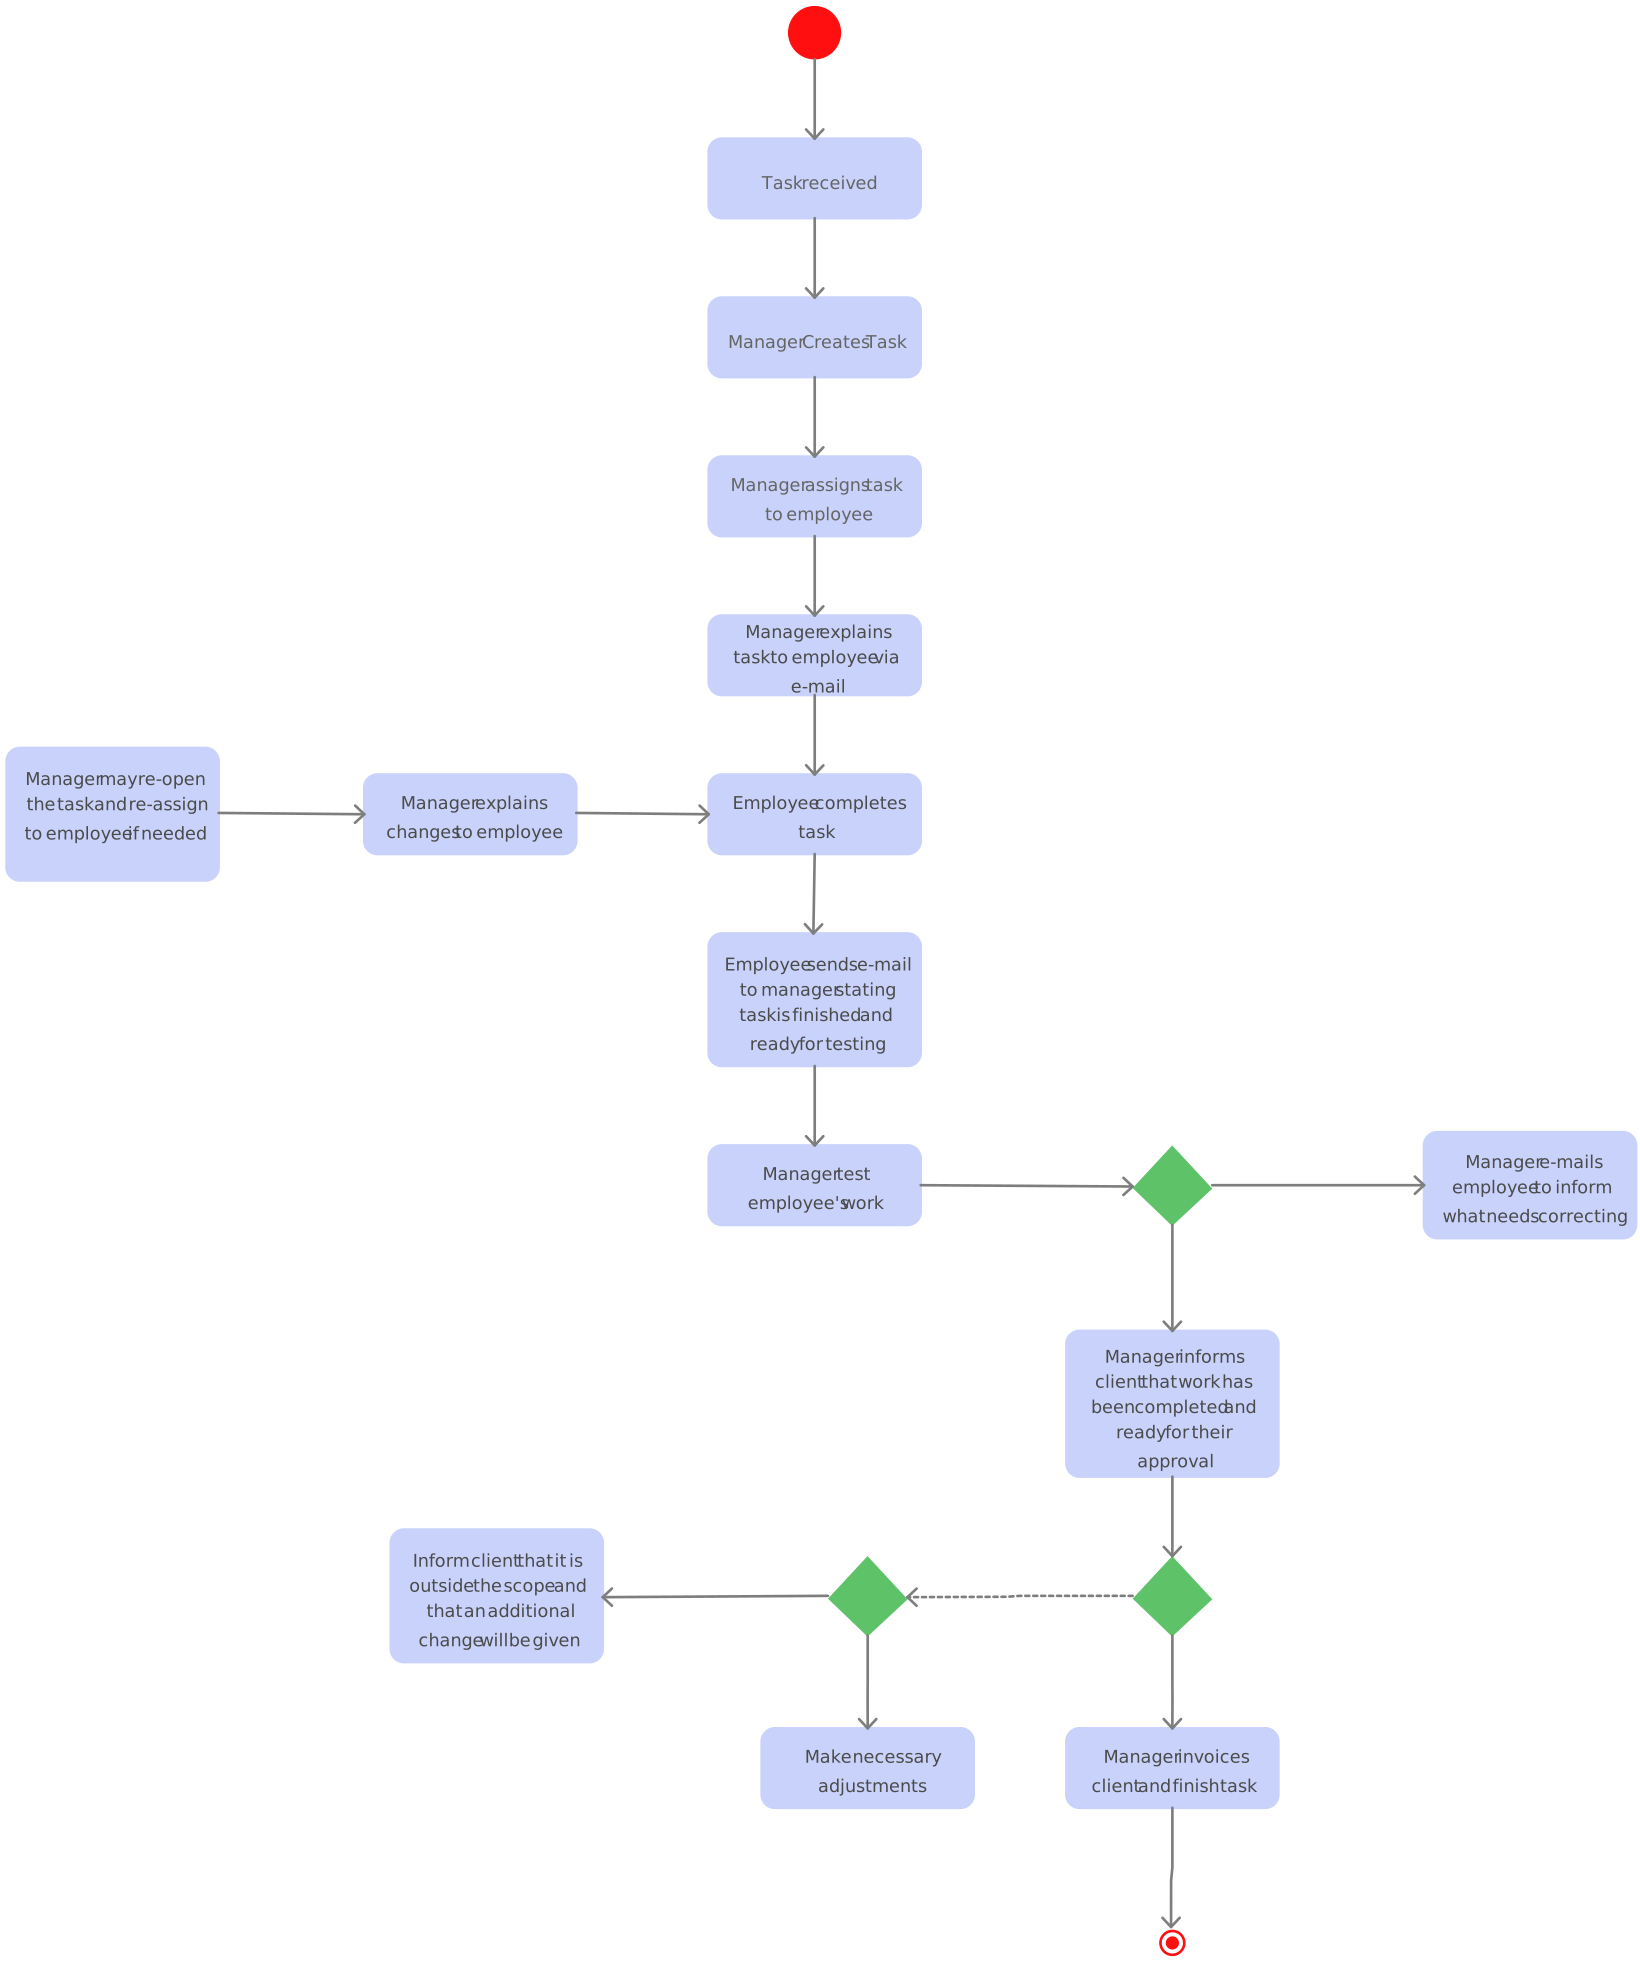
An activity diagram is a type of behavioral diagram within the Unified Modeling Language (UML) that visually represents the workflow of a system or process. It illustrates the sequence of activities, decision points, and parallel processes, providing a clear depiction of dynamic aspects of systems.
Purpose of activity diagrams
The primary purpose of an activity diagram is to model the dynamic behavior of a system by showcasing the flow of control and data among various activities. This includes:
Describing workflows: They capture both computational and organizational processes, detailing how tasks are carried out and how they interact.
Visualizing concurrent processes: Activity diagrams can represent parallel activities, making them useful for understanding systems with simultaneous operations.
Decision modeling: They incorporate decision points, illustrating where choices affect the flow of activities.
Common use cases of activity diagrams
Activity diagrams are utilized in various contexts, including:
Business process modeling: Documenting and analyzing business workflows to identify improvements.
Software development: Designing and visualizing the flow of control and data within software systems.
System design: Representing the interactions between different components or actors within a system.
When to Use a Flowchart vs Activity Diagram
Choosing between a flowchart vs activity diagram depends on the specific needs of your project and the complexity of the process you’re aiming to represent. Here’s a guide to help you decide which tool is more appropriate for your situation:
When to use a flowchart
Simple process representation: Flowcharts are ideal for illustrating straightforward, linear processes where the sequence of steps is clear and uncomplicated.
General process documentation: If you’re documenting a process for a broad audience without the need for specialized notation, flowcharts provide an accessible and easily understandable format.
Quick visualization: For brainstorming sessions or initial process mapping, flowcharts allow for rapid creation and modification, facilitating immediate understanding and discussion.
When to use an activity diagram
Complex system modeling: Activity diagrams are suited for modeling intricate workflows, especially those involving concurrent or parallel processes. They can depict multiple activities happening simultaneously, providing a comprehensive view of the system’s behavior.
Standardized notation: As part of the Unified Modeling Language (UML), activity diagrams use standardized symbols and semantics, making them suitable for projects that require adherence to modeling standards, particularly in software development and engineering.
Detailed behavioral analysis: If your goal is to analyze the dynamic aspects of a system, such as the flow of control and data among various activities, activity diagrams offer the necessary depth and detail.
In summary, opt for a flowchart when you need a simple, quick, and general representation of a process. Choose an activity diagram when dealing with complex workflows that require standardization and detailed behavioral modeling.
References
Ensmenger, N. (2016). The Multiple Meanings of a Flowchart. Information & Culture, [online] 51(3), pp.321–351. doi:https://doi.org/10.2307/44667617.
Bhattacharjee, A.K. and Shyamasundar, R.K. (2009). Activity Diagrams : A Formal Framework to Model Business Processes and Code Generation. The Journal of Object Technology, 8(1), p.189. doi:https://doi.org/10.5381/jot.2009.8.1.a3.
FAQs: Flowchart vs Activity Diagram
Can a flowchart represent complex systems with multiple activities?
Are flowcharts only used in business processes?
Can activity diagrams be used in non-technical fields?
What is the main advantage of using UML-based activity diagrams over flowcharts?
How do I decide which diagram to use when both seem applicable?