An order tracker can show status, owners, and deadlines, but a process diagram explains how those rows fit together. Placing the diagram beside the data gives readers context without making them reconstruct the workflow from a table.
To add diagrams in Google Sheets, export a diagram as a PNG and use Insert > Image. Place it over cells for a readable overview or inside a cell for a compact reference. Keep a link to the editable source alongside the image so the next person knows where to make changes.
This desktop guide covers image uploads, image formulas, source links, and native chart options. It also explains what changes when you export a Creately diagram and what needs to be updated separately.
Choose the Right Way to Add a Diagram
The best method depends on whether readers need an overview, a thumbnail, a chart based on cell data, or access to the editable diagram.
| Method | Useful for | What readers get | How to maintain it |
|---|---|---|---|
| Image over cells | Flowcharts and process maps beside a tracker | A visual overview that can be positioned independently | Replace the exported image after source changes |
| Image in a cell | Compact references in a catalog or register | An image contained in a cell | Keep the cell large enough to read and update its image when needed |
| IMAGE formula | Displaying a supported image from a URL | An image rendered from the supplied URL | Maintain the image file and URL; do not assume immediate refresh |
| Native Sheets chart | Data-driven visualizations, including org charts | A chart built from selected sheet data | Maintain the data range and chart settings |
| Link to the source | Reviewing or editing a larger diagram | Access to the diagram in its original tool | Keep the link and source permissions current |
A common combination is an image over cells for context and a source link for editing. You can keep the spreadsheet focused on tracking while maintaining diagram structure in Creately.
How to Insert a Creately Diagram in Google Sheets
Before following the export steps, check your Creately plan: PNG export is available on Pro, Business, and Enterprise, according to the current plan comparison.
Step 1: Create and Review Your Diagram in Creately
Start with a template or a blank canvas in Creately’s flowchart software. Add the steps, decisions, and connections relevant to the spreadsheet’s purpose.
For an order tracker, show the journey from order received to completion, including the outcomes that affect the tracked status. Review the sequence with someone who owns the process before exporting it.
Use this existing template as a starting point. The preview below shows the editable template, not a screenshot of an image inserted into Sheets.


Step 2: Export the Diagram as a PNG
Use the export control in Creately’s header and choose PNG. You can export the workspace or select the relevant shapes or section first. Creately’s export guide explains both options.
Export the portion readers need, with enough space around labels and connectors. Open the downloaded file and check that the smallest text is readable before inserting it.
PNG is a practical choice for this workflow. Although Creately also exports SVG and PDF, those formats are not image-upload options for Sheets.
Step 3: Insert the Image in Google Sheets
Open your spreadsheet and choose Insert > Image, then select Image over cells or Image in cell. Upload the PNG and confirm the insertion.
Google’s image guidance supports PNG, JPEG, and GIF files under 50 MB. SVG is not supported. A cell containing an image cannot also contain text.
For a full process diagram, start with Image over cells. For a compact reference, use Image in cell and keep its description in a neighboring cell.
Step 4: Arrange the Diagram Beside Its Supporting Data
Give the diagram a clear area, such as an overview tab or space beside the tracker. Resize the image using its corner handles and check readability at your team’s usual zoom level.
Add a short title and a description of what the diagram covers. For accessibility, add alt text to the image. Avoid covering column headers or the fields people need to update.
For a large workflow, an overview in Sheets and a source link may be easier to use than shrinking the entire process into a narrow space. Keep detailed explanations in the source diagram or supporting documentation.
Step 5: Link to the Editable Source and Record the Version
Copy the diagram’s share link from Creately and put it in a nearby cell with a clear label, such as Open editable order process. Make sure the intended readers have the required source access.
You can also use Sheets’ HYPERLINK function. If B2 contains the source URL:
=HYPERLINK(B2,"Open editable diagram")
Keep a diagram owner and review date nearby. This helps readers distinguish the spreadsheet preview from the version currently maintained in Creately.
Use the IMAGE Function for an Image URL
If a supported image file is already available through a suitable URL, you can display it in a cell with IMAGE. For example, if A2 contains the image URL:
=IMAGE(A2)
The default mode preserves the image’s proportions while fitting it inside the cell. Mode 4 lets you specify dimensions:
=IMAGE(A2,4,180,300)
Here, 180 is the height and 300 is the width in pixels. Adjust the cell dimensions separately; IMAGE does not resize the cell for you. Formula separators can vary with spreadsheet locale.
Use a direct image-file URL, not a Creately workspace page, template page, or sharing-page URL. Google excludes URLs hosted at drive.google.com from IMAGE, and SVG is unsupported. Uploading the exported PNG is often simpler for a diagram that does not need URL-based placement.
Do not treat IMAGE as a synchronization feature between Creately and Sheets. It renders the image referenced by the URL, not the editable shapes and relationships in the original workspace.
Can You Embed an Editable Diagram in Google Sheets?
Image placement, linking, and interactive embedding are different workflows:
- Insert an image: Readers see a picture of the diagram.
- Add a source link: Readers open the diagram in its original tool, subject to its permissions.
- Use an interactive embed: Readers interact with content inside a host that supports that embed.
The image-and-link method in this guide gives you the first two. Pasting an embed code into a cell does not turn the image into an editable Creately canvas. Make structural edits in Creately, then update the preview when it needs to reflect those changes.
If you choose an add-on, check that its current listing specifically supports Google Sheets and the behavior you need. A Google Drive connection or an integration for Docs or Slides does not establish the same capabilities in Sheets. This workflow requires no add-on installation.
Other Ways to Create Diagrams in Google Sheets
Use a Native Chart for Spreadsheet Data
For a chart based on cell values, select the data and choose Insert > Chart, then select an appropriate chart type in the editor. Use a native chart when the relationship you need is supported by Sheets’ chart options.
For example, an organizational chart uses names in the first column and managers or parent relationships in the second. An optional third column provides hover notes. See the dedicated guide to making an org chart in Google Sheets for that workflow.
A native org chart is different from an uploaded picture of an org chart. Choose between them according to whether you need Sheets’ supported chart behavior or a diagram maintained in another tool.
Use a Drawing for a Small Manual Diagram
Sheets also supports drawings placed over a sheet. A small diagram with a few shapes may be manageable in its drawing editor, but complex decision paths and detailed notation are easier to maintain in a dedicated diagramming workspace.
For a flowchart, use the flowchart guide to check symbols and decision paths before choosing where to build it. The spreadsheet is most useful when the visual helps explain the data rather than competing with it for space.
Keep the Spreadsheet Preview Current
An exported image has no connection back to its source shapes. Decide who owns the diagram and when the preview needs replacing.
For the order-tracker example, a useful maintenance routine is:
- Review changes to the process with its owner.
- Update the source diagram in Creately.
- Export the revised diagram as a PNG.
- Replace the spreadsheet image and update the review date.
- Open the source link as a reader to confirm access still works.
For an over-cell image, Sheets provides Replace image in the image’s menu. Keep a short change note when the update alters how people interpret statuses, responsibilities, or exceptions.
Exporting a diagram into Sheets is also different from importing spreadsheet data into a diagramming tool. If your starting point is a table of employees and managers, use a supported org-chart import workflow rather than expecting an image export to create a data connection.
Troubleshooting Diagrams in Google Sheets
| Problem | What to check |
|---|---|
| Labels are too small | Export a focused overview or split the workflow into sections instead of shrinking every detail |
| IMAGE shows an error or no useful preview | Check that the URL points to a supported image file, not a workspace or sharing page |
| The source link asks for access | Review permissions on the source diagram; access to the spreadsheet does not grant access elsewhere |
| The preview shows an old process | Compare its review date with the source, then export and replace the image |
| You cannot edit individual diagram shapes | Open the editable source; the uploaded PNG contains pixels rather than separate nodes and connectors |
| The picture covers important cells | Move it to an overview area or a separate tab and keep the tracker readable |
Templates to Create Diagrams for Your Spreadsheet
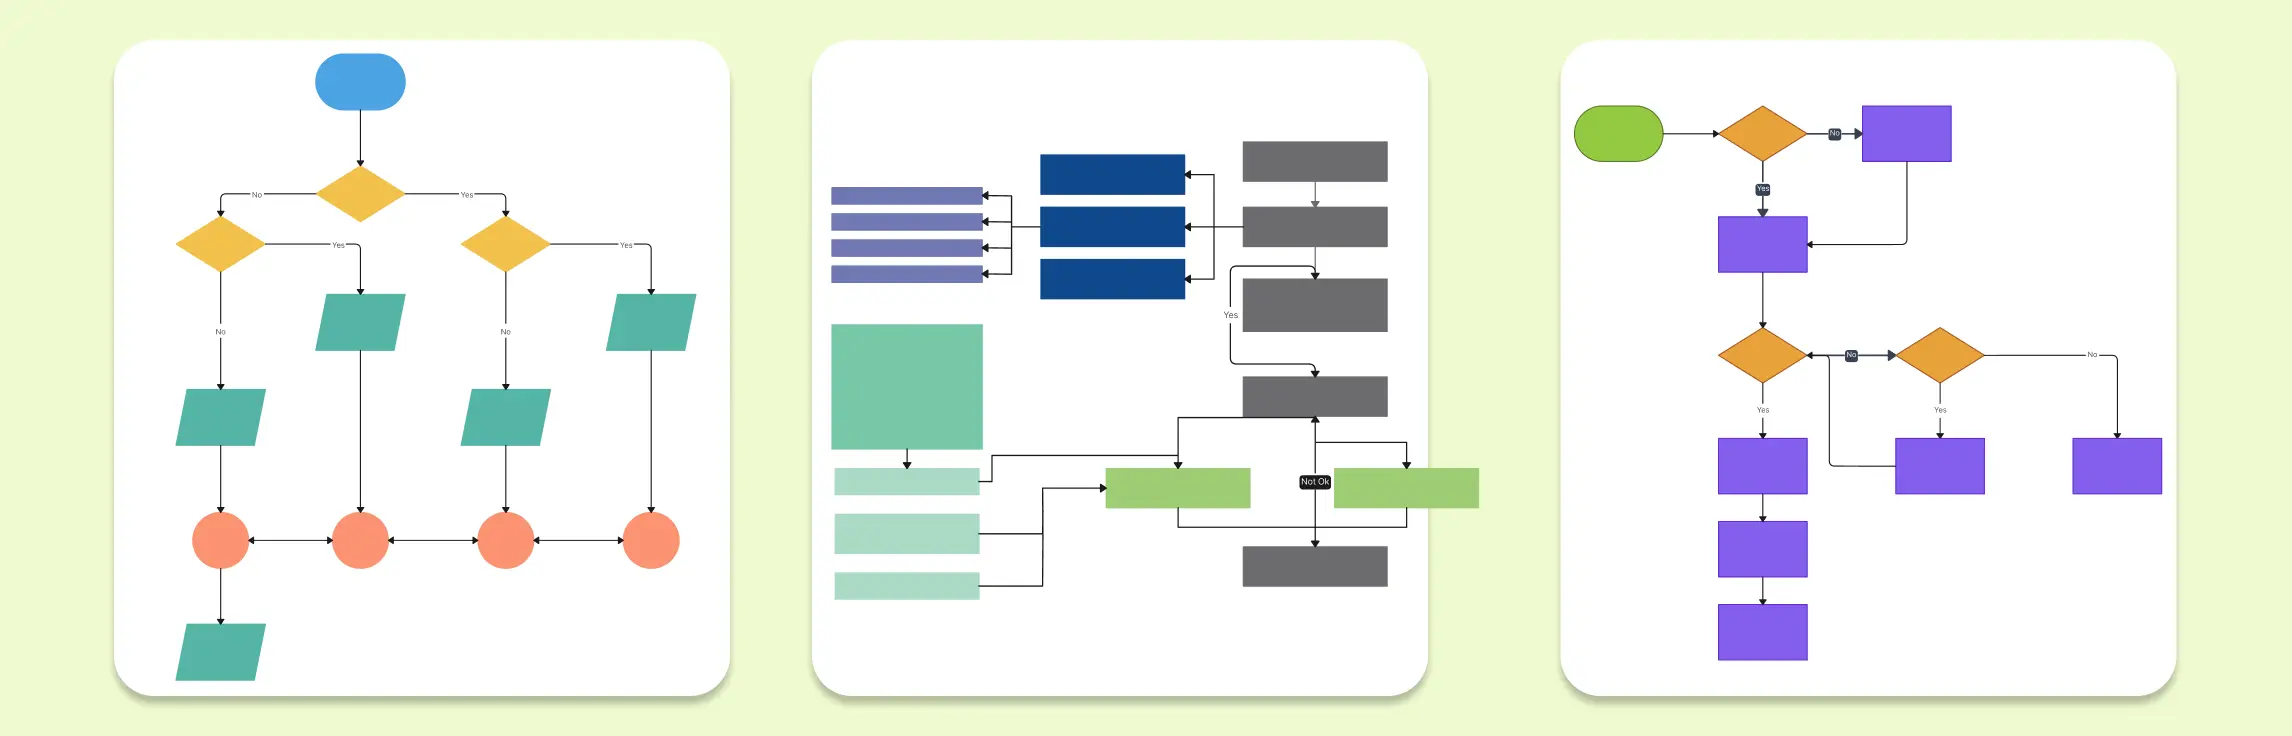
These templates offer alternatives to the order-process example in the body. Customize them in Creately, review the diagram, then export a PNG for placement in Sheets. The SVG files below are website previews; use a supported image format for the spreadsheet.