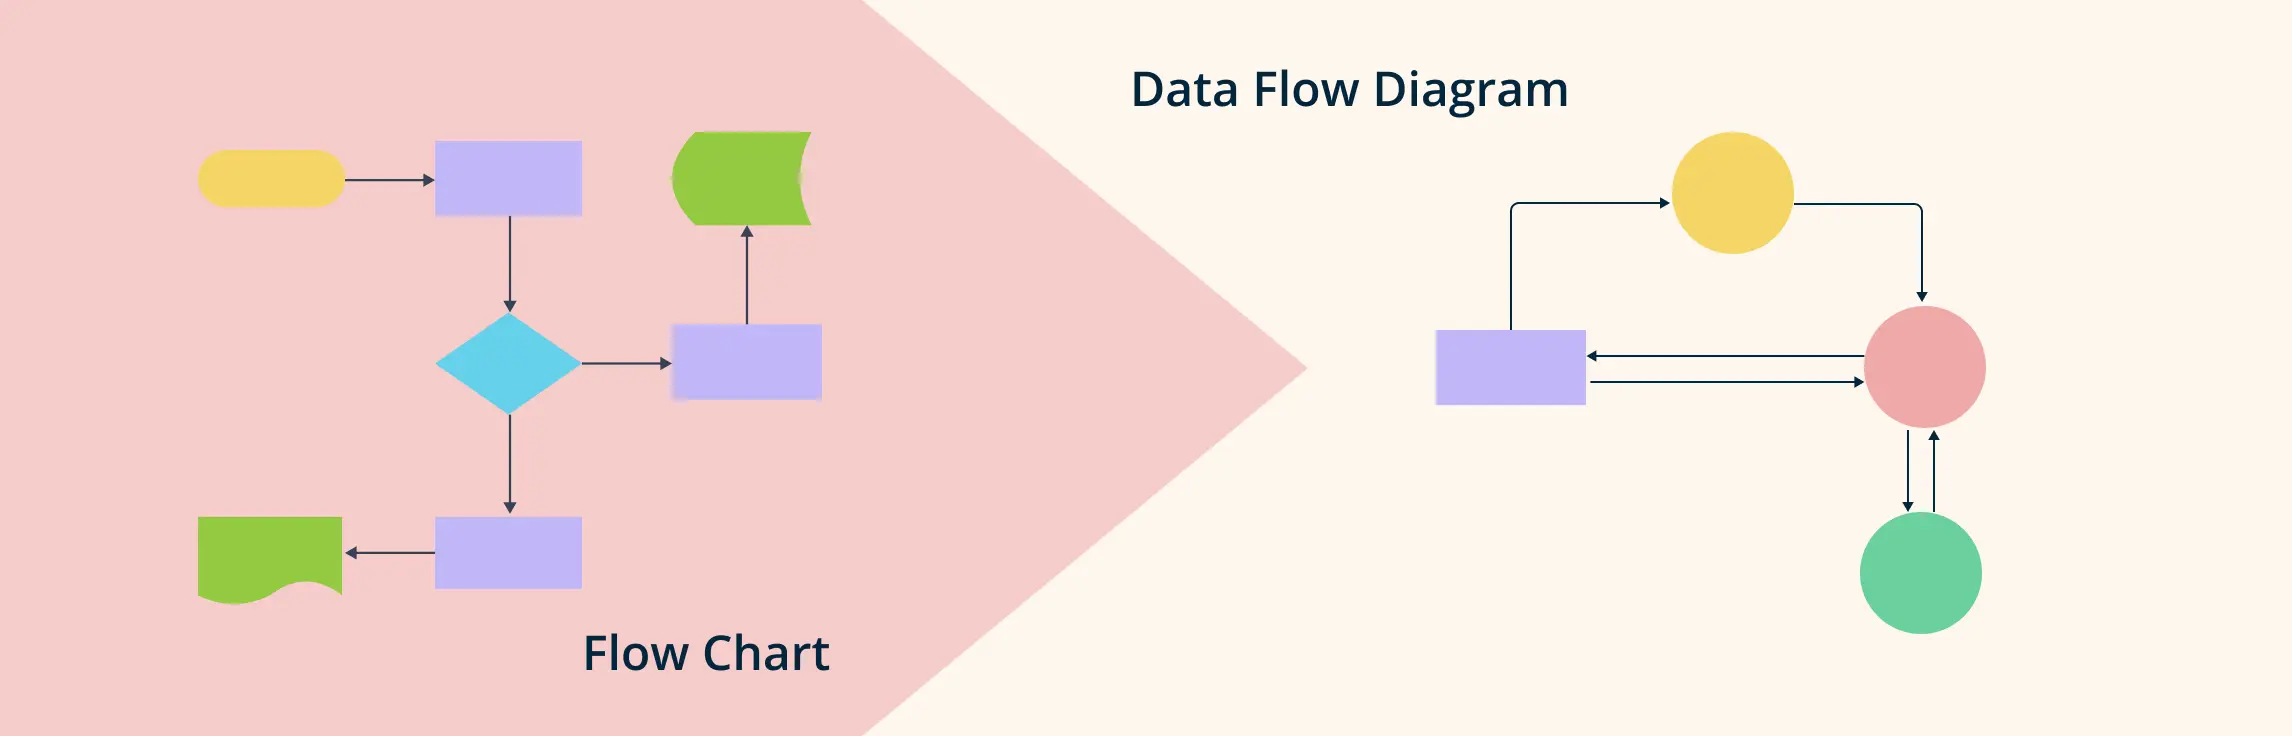
Flowcharts and data flow diagrams (DFDs) visualize different aspects of a system. A flowchart shows the sequence of activities and decisions in a workflow, while a DFD shows how data moves between external entities, processes, and data stores. Choosing the right diagram helps teams answer the right question without mixing operational flow with information flow.
This guide explains the components, uses, benefits, and limitations of both diagram types. It also compares flowcharts and DFDs side by side and uses business-process and online-banking examples to show when each one is appropriate.
Here’s a quick summary of the key differences between flowcharts and DFDs:
| Feature | Flowchart | Data Flow Diagram (DFD) |
| Focus | Sequence of actions and decisions | Flow of data within a system |
| Purpose | Process analysis, documentation, and communication | System analysis, system design, and understanding data dependencies |
| Key Elements | Processes, decision points, control flow | Processes, data stores, data flow |
| Control Flow | Explicitly shown | Not explicitly shown |
What Are Flowcharts?
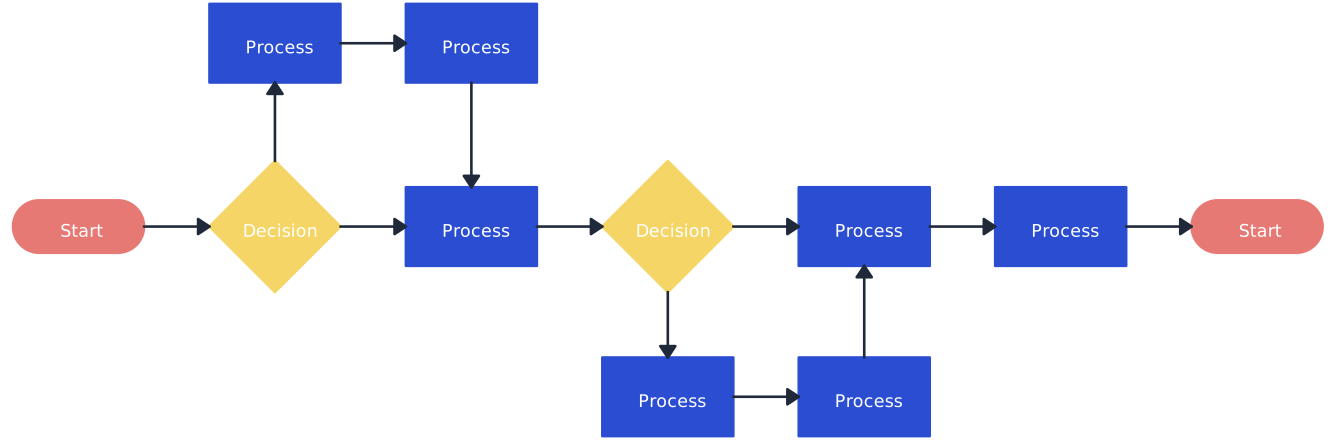
A flowchart is a visual representation of a process, showing the sequence of steps and decisions involved in completing a task or solving a problem. Flowcharts use a variety of standardized symbols and arrows to illustrate processes, making complex workflows easier to understand and communicate.
Key Components of a Flowchart
- Flowchart Symbols: Each step in the process is represented by a specific shape, such as ovals for start/end points, rectangles for processes, diamonds for decisions, and arrows for connections.
- Connectors: Arrows that show the direction of flow, guiding users through the steps of the process.
- Decision Points: Diamonds represent decision points where the process can branch based on different outcomes.
Common Use Cases for Flowcharts
- Process Flow: Mapping out workflows in business operations or manufacturing.
- Decision-Making: Clarifying choices and potential outcomes in a decision-making process.
- Troubleshooting: Identifying problems and their potential causes in troubleshooting or diagnostic scenarios.

What Are Data Flow Diagrams?
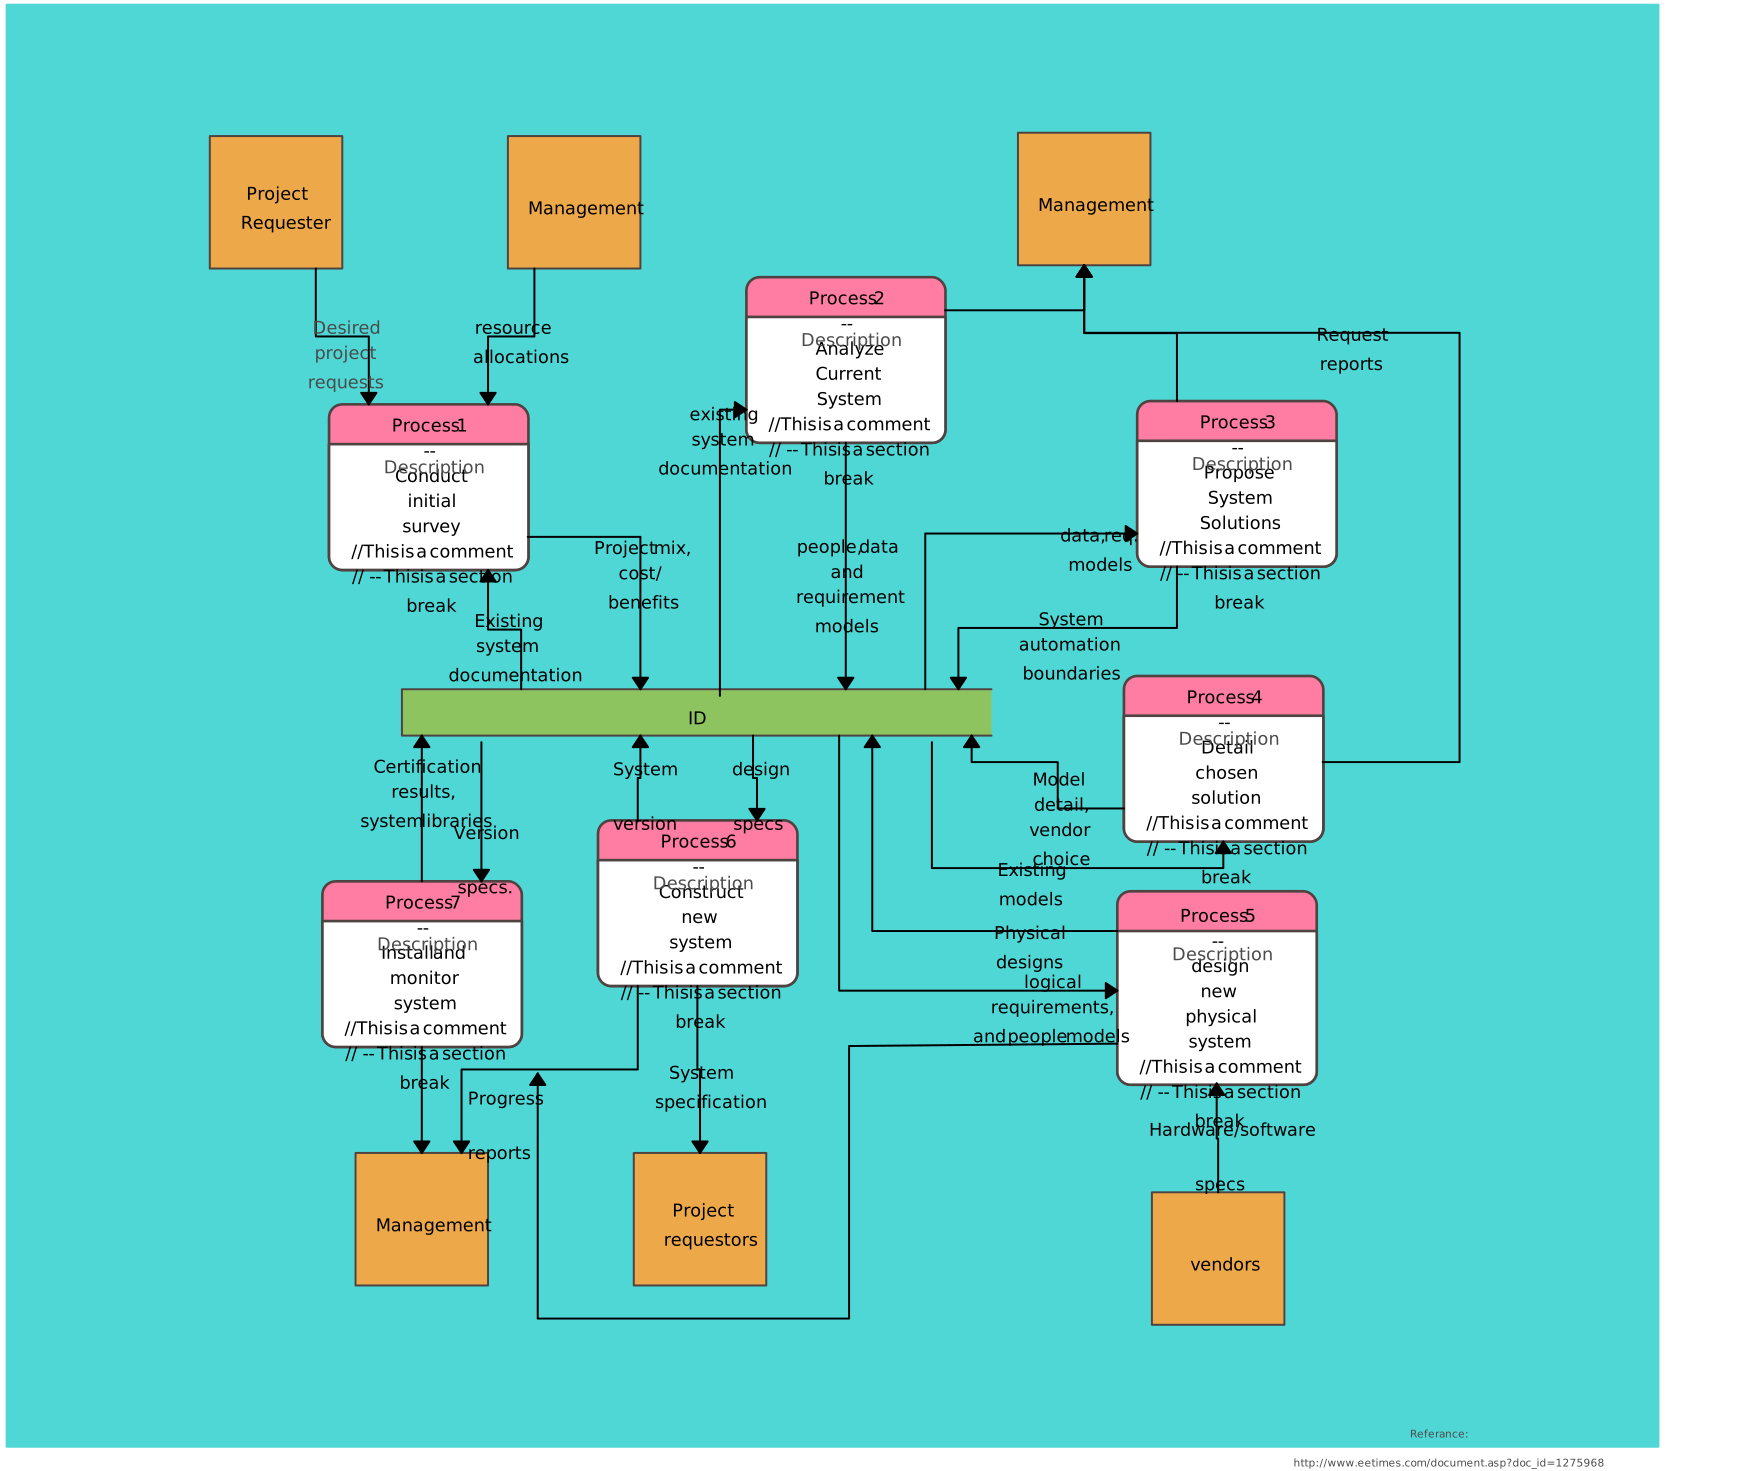
A data flow diagram (DFD) represents how data moves through a system. It shows external entities that send or receive data, processes that transform it, data stores that retain it, and labeled data flows between those elements. Unlike a flowchart, a DFD does not show control flow, timing, or the order in which activities execute.
Key Components of a DFD
- External Entities: Represent people, organizations, or systems outside the modeled boundary that send or receive data.
- Processes: Indicate how data is transformed. Depending on the DFD notation, processes may appear as circles, bubbles, or rounded rectangles.
- Data Stores: Represent places where data is stored within the system, such as databases or files.
- Data Flows: Arrows that show the movement of data between entities, processes, and stores.
How DFDs Represent the Flow of Information
DFDs illustrate how data enters a system, how processes transform it, and where it is stored or sent. This makes them useful for requirements analysis, system design discussions, and identifying missing or unnecessary data flows.
Common Use Cases for DFDs
- System Analysis: DFDs are widely used to analyze existing systems, helping to understand data movement and identifying inefficiencies.
- Data Requirements: DFDs can inform database and interface requirements by showing which processes use or produce stored data, but they do not replace a data model or database schema.
- System Improvement: DFDs can reveal duplicated, missing, or unnecessary data movement that warrants further investigation.
DFDs give analysts, developers, and stakeholders a shared view of information movement. They document intended data flow; they do not monitor or guarantee system performance.
Flowcharts vs. Data Flow Diagrams
Flowcharts and data flow diagrams (DFDs) are visual modeling tools, but they answer different questions and use different elements. Understanding those differences helps you choose the right diagram for your analysis goal.
Differences in Structure, Purpose, and Usage | ||
Flowcharts | Data Flow Diagrams (DFD) | |
| Structure | Flowcharts focus on the sequence of steps in a process. They use simple, standardized symbols like ovals, rectangles, diamonds, and arrows to represent processes, decisions, and connections. | DFDs represent the flow of data between different parts of a system. They use entities, processes, data stores, and data flows to show how information moves and is processed. |
| Purpose | The main goal of a flowchart is to provide a clear, step-by-step illustration of a process, making it easy to understand the workflow, identify bottlenecks, and clarify decision points. | DFDs are designed to show how data is handled, stored, and processed within a system. They help analyze the movement and transformation of data, focusing on how different components interact with each other. |
| Usage | Flowcharts are often used for process mapping, decision-making, and troubleshooting. They're ideal for representing linear or branching workflows in a variety of industries, from business operations to software development. | DFDs are primarily used for system analysis, requirements discovery, and documenting information movement. They can inform interface and data-storage design but do not define a database schema. |
| When to Choose | When:
| When:
|
| Pros |
|
|
| Cons |
|
|
Flowcharts and DFDs answer different analysis questions. Use a flowchart to show what happens next in a workflow, including activities and decisions. Use a DFD to show where data comes from, how it is transformed, where it is stored, and where it goes. Some projects benefit from both views, but one should not be used as a substitute for the other.
Helpful Resources
Effortlessly create and share flowcharts, enhancing team communication and streamlining workflows with free flowchart software.
Explore everything you need to know about flowcharts in this comprehensive tutorial, from their history to their applications.
Learn the basics of how to create a simple flowchart and continue to expand your skills.
Learn the various symbols used in flowcharting, their meanings, and how to use them effectively.
Discover 10 practical flowchart ideas and try out the editable templates.
Examples of Flowcharts and Data Flow Diagrams
Flowcharts and data flow diagrams (DFDs) help teams examine different aspects of complex work and systems. The following examples show how a flowchart maps an operational sequence and how a DFD maps information movement.
1. Business Process Flowchart
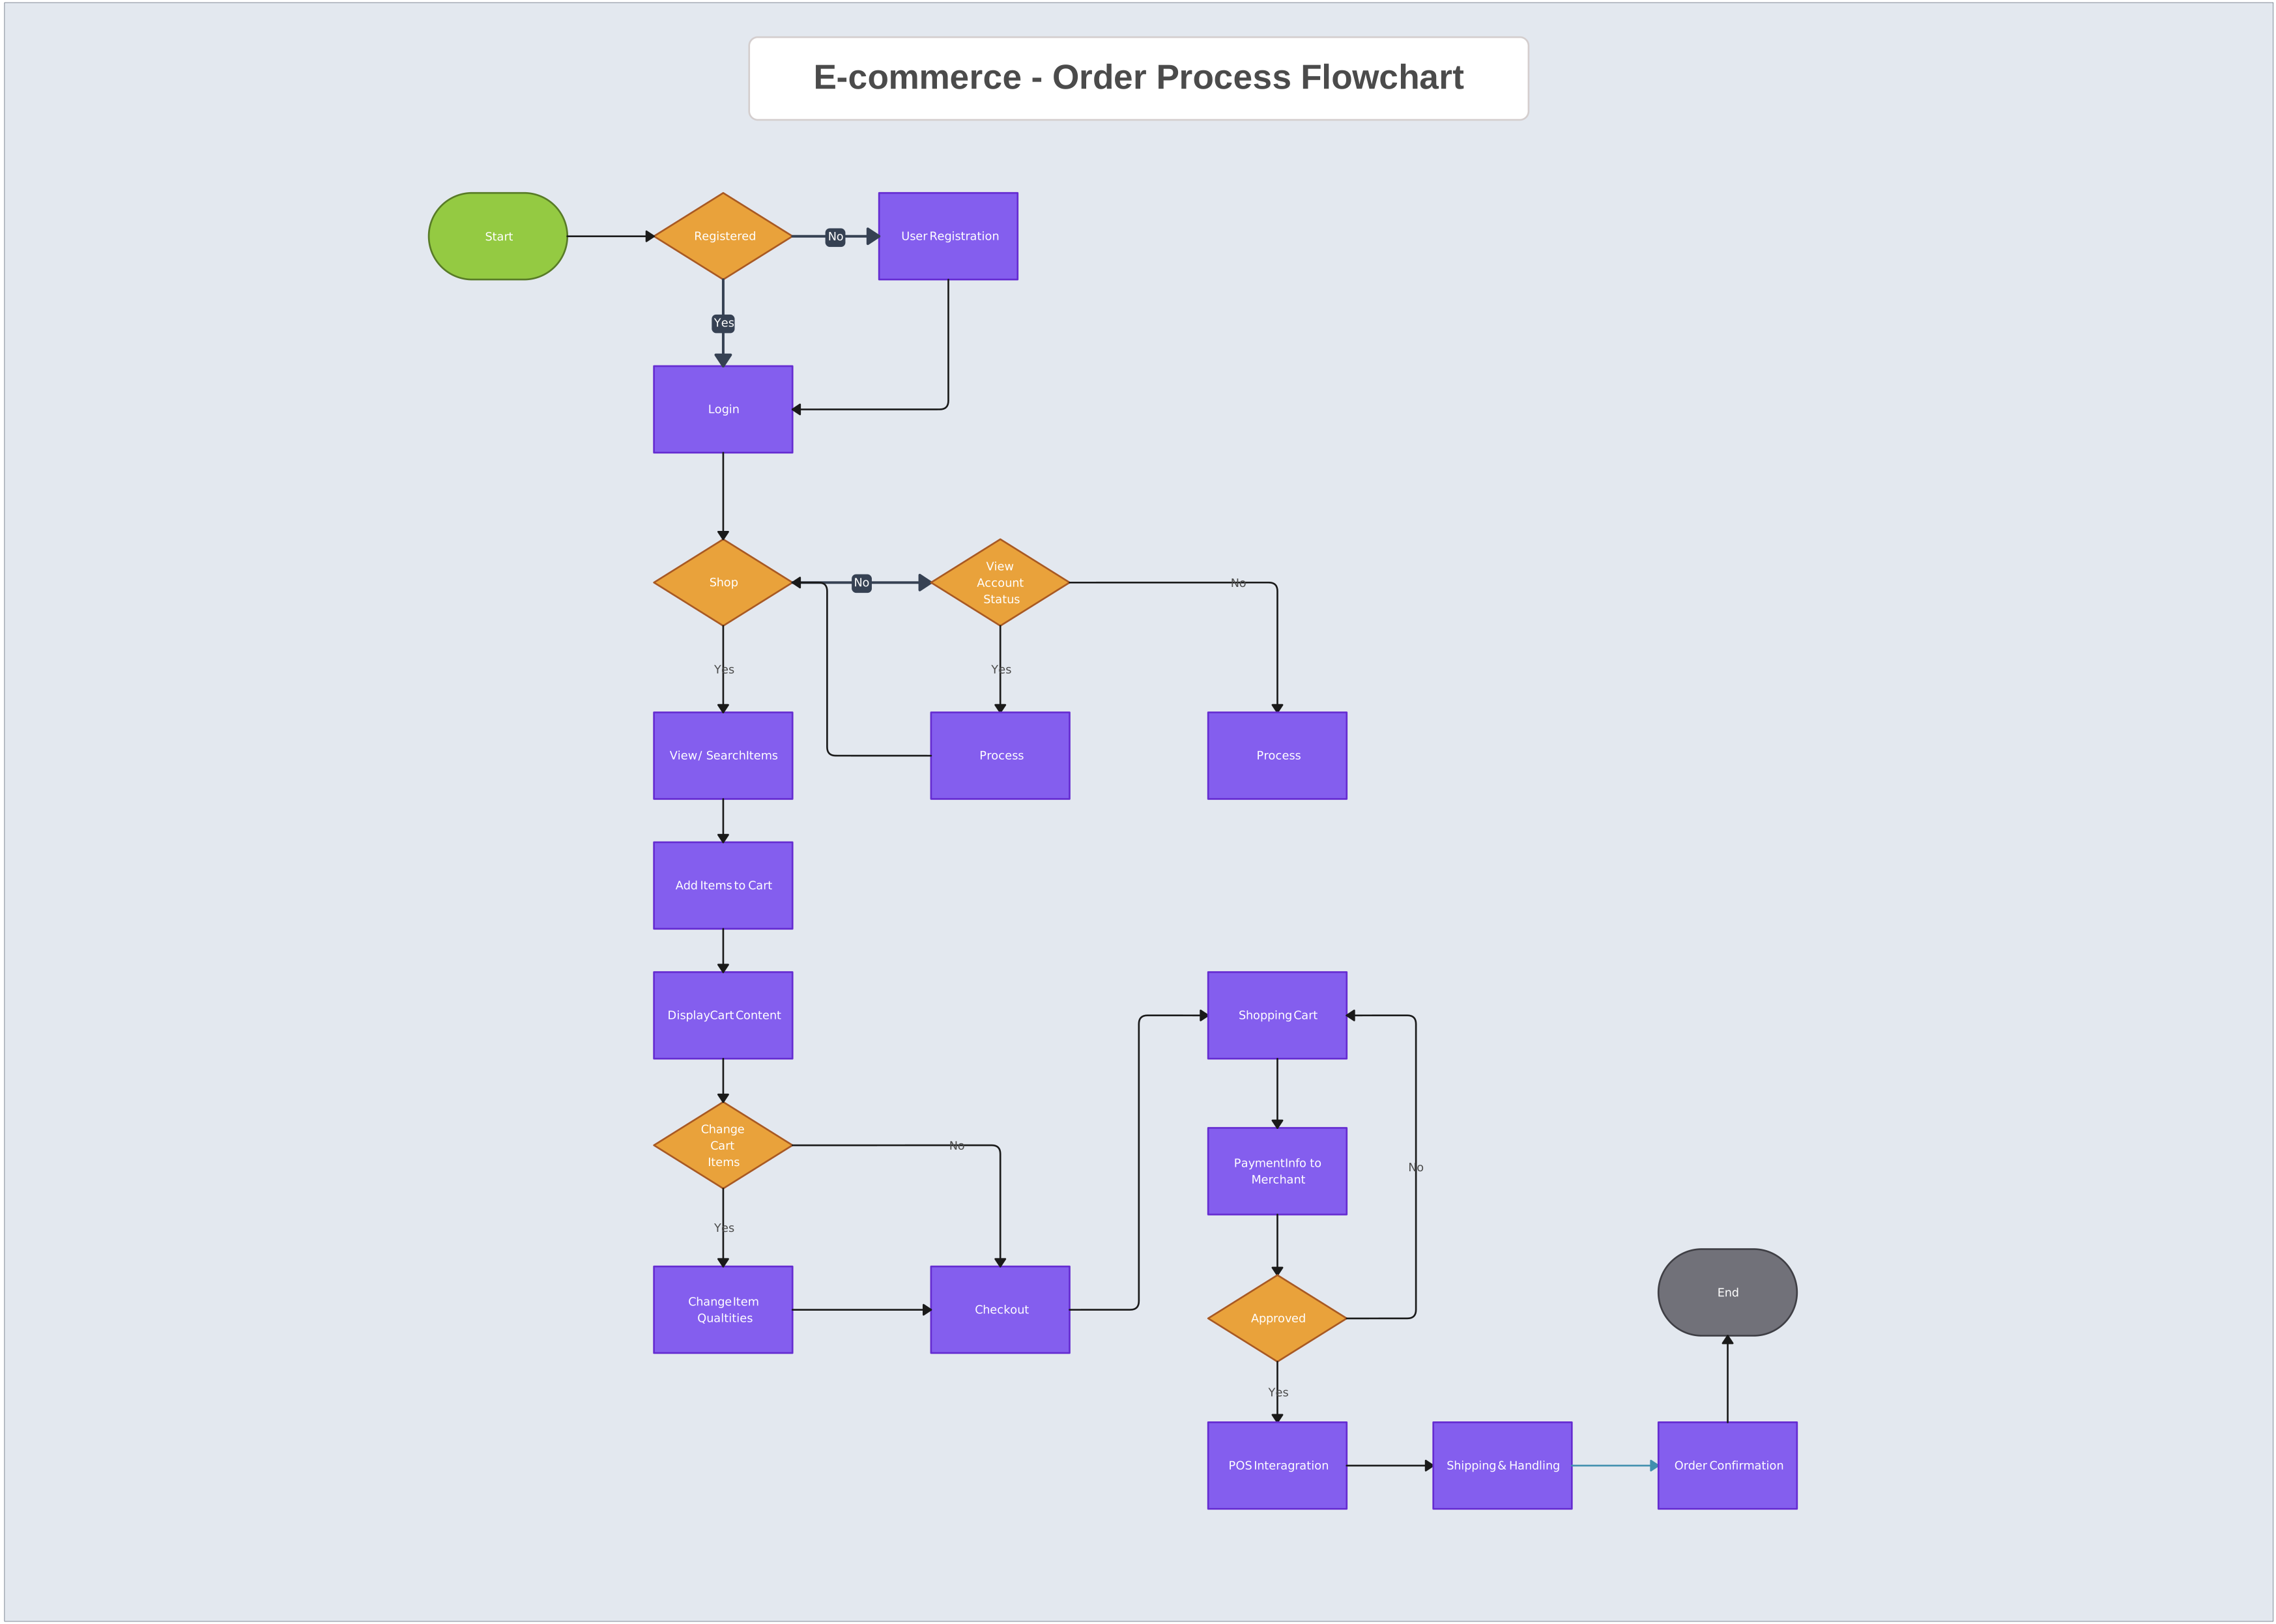
A business process flowchart is a visual representation of the steps involved in a business process from start to finish. These flowcharts help organizations streamline operations, identify inefficiencies, and optimize workflows.
Example: Order Processing System
- Step 1: A customer places an order on the website.
- Step 2: The order is sent to the sales department for verification.
- Step 3: The sales department verifies the order details (e.g., inventory check).
- Step 4: If the product is available, the order moves to the shipping department; if not, the order is canceled, and the customer is notified.
- Step 5: The shipping department prepares the order for delivery.
- Step 6: The order is shipped to the customer.
In this flowchart, the process starts with the customer order and flows through various decision points, where actions are taken based on conditions (e.g., availability of the product). Flowcharts are ideal here because they clearly visualize each step of the order process, showing decision points, actions, and outcomes.
Benefits of Using a Flowchart for Business Processes:
- Helps identify bottlenecks (e.g., delays in inventory checks).
- Enables quick understanding of the process by stakeholders and team members.
- Provides a shared reference for reviewing how orders should be handled.
You can create a flowchart like this using Creately’s free flowchart software. Creately AI can generate an editable flowchart draft from a plain-language process description. Teams can then add owners, clarify handoffs, connect relevant notes, links, or files, and use comments and @mentions to review the workflow before the process owner incorporates agreed changes.
Explore more flowchart templates in our diagram community.
2. IT System Data Flow Diagram (DFD)
A Data Flow Diagram (DFD) is ideal for visualizing how data moves within an IT system, identifying how it is processed and stored at various stages.
Example: Online Banking System
External Entities:
- Customer: Sends login credentials and transaction requests to the banking system and receives responses.
Processes:
- Authentication: The system checks the customer’s credentials (username and password).
- Transaction Processing: Validates and processes a fund transfer or bill payment request.
- Account Update: Updates the customer’s account balance after a successful transaction.
Data Stores:
- Customer Database: Stores customer credentials, account information, and transaction history.
- Transaction Database: Stores details of every transaction made.
Data Flows:
- Data flows from the Customer (login credentials, transaction details) to the Authentication process.
- After authentication, transaction data flows to the Transaction Processing process, which reads from or writes to the Transaction Database.
- The transaction’s result (e.g., successful or failed) is sent back to the Customer.
This DFD shows how data moves between the customer, authentication and transaction processes, and the relevant data stores. It focuses on information movement rather than the chronological sequence or user-interface steps of completing a transaction.
Benefits of Using a DFD for an IT system:
- Shows which processes transform data and which stores retain it.
- Helps analysts and developers identify data-flow gaps or unnecessary duplication.
- Enables better communication between stakeholders, such as business analysts and developers, by providing a clear picture of data flow.
You can map this system using Creately’s DFD software and its DFD shape libraries. Stakeholders can collaborate in real time and use comments and @mentions to review system boundaries, processes, stores, and data flows. Explore more DFD templates in the diagram community.
Conclusion: Streamline Your Processes with Flowcharts and DFDs
Flowcharts and data flow diagrams provide complementary views of a process or system. Flowcharts visualize activities, decisions, sequence, ownership, and handoffs. DFDs focus on how information moves between external entities, processes, and data stores. Understanding this distinction helps teams select the diagram that fits their analysis goal.
With Creately, teams can start from editable flowchart and DFD templates, collaborate in real time, and use comments and @mentions to gather feedback. For operational flowcharts, owners, handoffs, and supporting process context can stay connected to the visual so the process owner can maintain it as living documentation. For DFDs, keep the focus on system boundaries and data movement rather than treating the diagram as an execution or monitoring tool.
FAQs About Flowcharts and Data Flow Diagrams
What is the difference between flowcharts and data flow diagrams?
When should I use a flowchart instead of a data flow diagram?
How can flowcharts and data flow diagrams help improve my workflow?
Resources:
Davis, W.S. (2019). Data flow diagrams. The Information System Consultant’s Handbook, pp.175–188. doi:https://doi.org/10.1201/9781420049107-24.
Ensmenger, N. (2016). The Multiple Meanings of a Flowchart. Information & Culture, [online] 51(3), pp.321–351. doi:https://doi.org/10.2307/44667617.
Weng, W. (2024). Flowchart. A Beginner’s Guide to Informatics and Artificial Intelligence, pp.13–20. doi:https://doi.org/10.1007/978-981-97-1477-3_2.