
A logical data flow diagram (DFD) shows what information a system needs and how it moves, without committing to a particular technology. A physical DFD shows how a chosen implementation handles that information. For an online order, the logical view might show an order being validated and recorded; the physical view could name the checkout application, payment service, and order database that perform those activities.
Both are DFDs. They use the same basic building blocks, but answer different questions. This guide compares the two views, follows one order-processing example through each, and shows how to create a physical view without losing the business requirements captured in the logical one. For a comparison with process flowcharts, see flowcharts vs. data flow diagrams.
What Is a Logical Data Flow Diagram?
A logical DFD describes the business functions and information flows required to achieve an outcome. It names activities such as Validate order or Confirm payment, and data such as Order details or Payment status. It does not need to say which application, API, database table, or employee role implements each activity.
Use this view during discovery and requirements discussions. A business analyst can ask stakeholders whether the right data enters each process, whether a necessary data store is missing, and whether outputs reach the right recipient. Because the view is independent of the current technology, it also helps teams examine a future process before choosing a solution.
What Is a Physical Data Flow Diagram?
A physical DFD describes a particular way to carry out those flows. It can name the applications, services, files, databases, devices, and manual handoffs involved. For example, Validate order may become a checkout service that reads an inventory table, sends a payment request to a provider, and writes an order record to a database.
Use this view to document a current implementation or plan a proposed one. It gives developers, IT teams, and reviewers the detail they need to discuss interfaces, storage, ownership, and implementation constraints. A physical DFD still traces data movement; it is not a substitute for an infrastructure diagram, database schema, or step-by-step process flowchart.
Logical vs. Physical DFD: Key Differences
| Aspect | Logical DFD | Physical DFD |
|---|---|---|
| Main question | What data is needed and what happens to it? | How will a specific system handle that data? |
| Focus | Business functions and required information | Applications, services, files, databases, and manual handling |
| Typical audience | Business stakeholders, analysts, product teams | Developers, IT teams, system owners, technical reviewers |
| Process labels | “Validate order” or “Confirm payment” | “Checkout service validates order” or “Payment API returns status” |
| Data-store labels | “Orders” or “Inventory” | “Order database” or “Inventory table” |
| Most useful stage | Requirements discovery and business review | Implementation design, documentation, and change review |
| What it leaves open | Technology and operational details | The business rationale behind the chosen implementation |
The symbols do not change simply because a DFD is logical or physical. Both views use external entities, processes, data stores, and labeled data flows. The level of detail in their labels changes. Also, a logical or physical view is different from a DFD level: Level 0, Level 1, and Level 2 describe how far you decompose a system into processes. Either view can be drawn at more than one level. If you need to define the boundary before adding internal processes, start with a context diagram.
Example: The Same Online Order in Both Views
Imagine a customer placing an order in an online store. Keep the boundary and business outcome consistent across both diagrams: the store receives an order, checks that it can be fulfilled, confirms payment, records the order, and sends a confirmation.
Logical view: What must happen?
- External entities: Customer and payment provider.
- Processes: Receive order, check availability, confirm payment, record order, and send confirmation.
- Data stores: Product availability and orders.
- Labeled flows: Order details, availability result, payment request, payment status, and order confirmation.
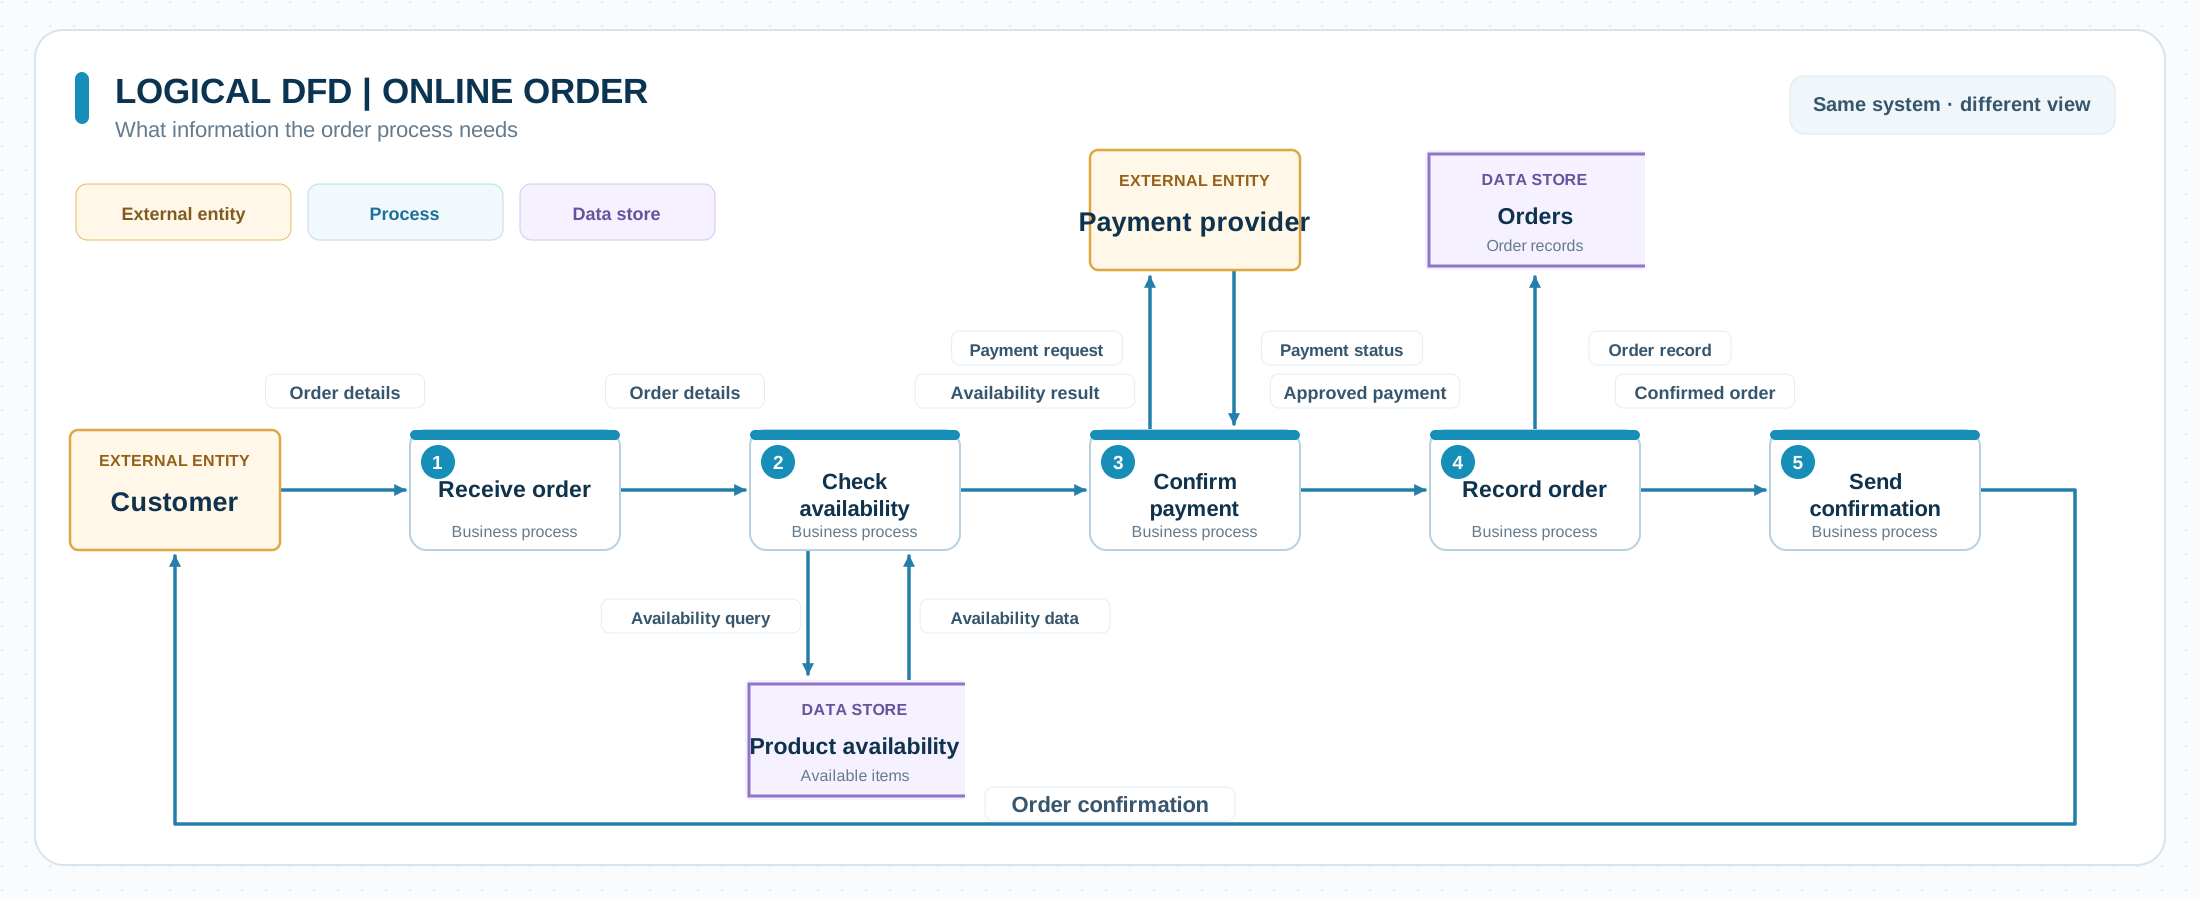
This view helps a stakeholder spot a missing requirement. For instance, what happens to the order information if an item is unavailable? It leaves open whether availability is checked in a database, spreadsheet, or separate service.
Physical view: How does the chosen system handle it?
- External entities: Customer and the external payment provider.
- Processes: Storefront sends order data to the checkout service; the checkout service requests stock and payment checks; the notification service sends the confirmation.
- Data stores: Inventory database and order database.
- Labeled flows: Checkout request, stock response, payment authorization request and response, saved order record, and confirmation message.
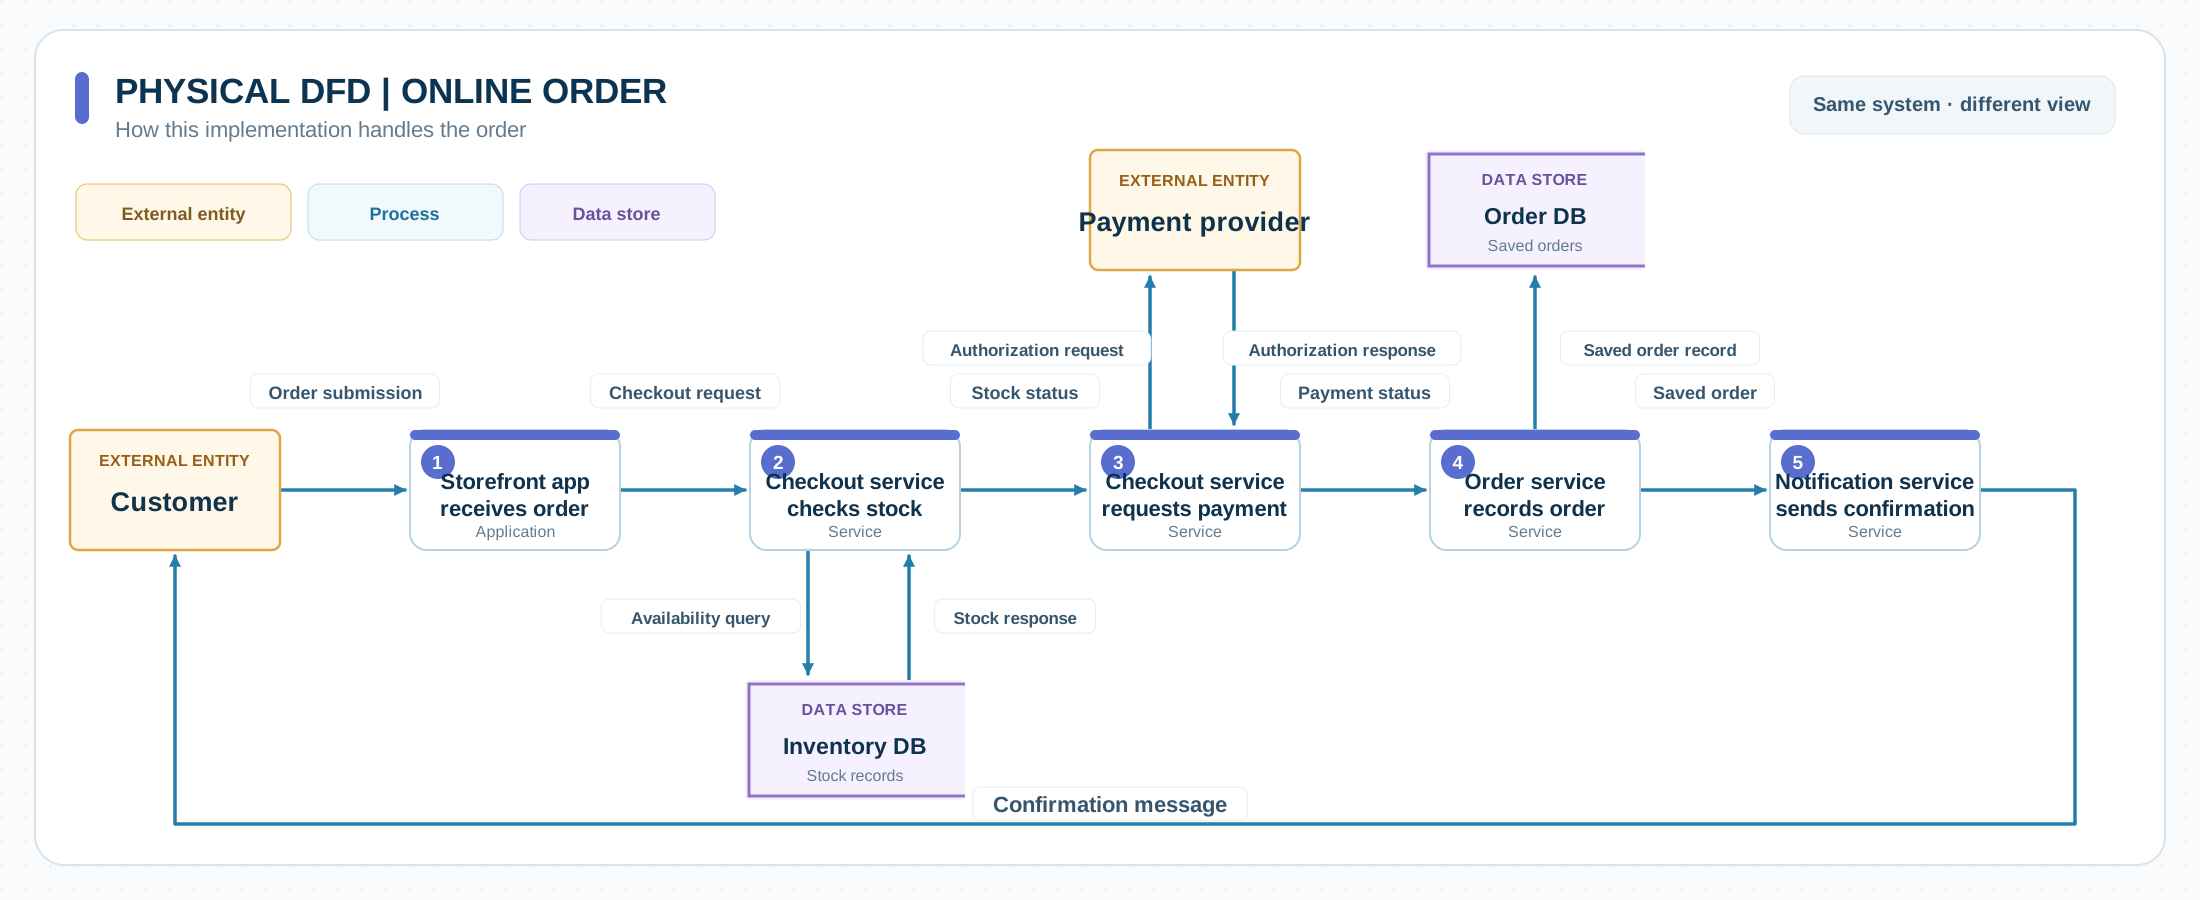
The physical view makes the implementation reviewable: it shows which component handles each flow and where information is stored. These component names are illustrative, not a required architecture. A different store could use a manual stock check or a single application. Whatever the design, each physical flow should still support the information exchange agreed in the logical view.
How to Move from a Logical to a Physical DFD
- Agree on the logical view. Confirm the system boundary, external entities, required processes, stores, and named data flows with business stakeholders. A DFD template gives you the core shapes to start with.
- Identify the actual handlers. For each logical process, record the application, service, person, or manual procedure that will perform it. A single logical process may require several physical components.
- Name storage and interfaces. Replace abstract stores with the relevant database, file, or other repository. Label data crossing system boundaries so reviewers can see what each interface sends or receives.
- Check correspondence. Trace every important logical input and output through the physical view. If a flow disappears, the design may be incomplete; if a new flow appears, ask whether it is required and where it belongs in the business view.
- Review both views together. Ask business stakeholders to confirm the outcome and technical owners to confirm the implementation. Keep the diagrams linked as the design changes.
Creately’s data flow diagram maker provides DFD shapes, connectors, notes, comments, and a shared workspace. You can keep the logical and physical views together, attach requirements or decisions to diagram elements, and share them for review. Use a logical DFD template to get started, then adapt its processes and flows to your system.
Common Mistakes to Avoid
- Adding technology too early to the logical view. If every process is named after an application, business reviewers may focus on the current solution instead of the information the process requires.
- Treating the physical view as a network map. Servers and devices belong only when they explain a data flow. The DFD should still show processes, stores, entities, and the data moving between them.
- Leaving flows unlabeled. An arrow alone does not tell a reviewer whether it carries an order, an approval, or a status response.
- Confusing DFD levels with DFD types. A more detailed Level 1 diagram is not automatically physical. It can still describe business functions without implementation detail.
- Letting the views drift apart. A physical design that no longer accounts for a required logical flow can hide a missing interface or output.
Editable Data Flow Diagram Templates
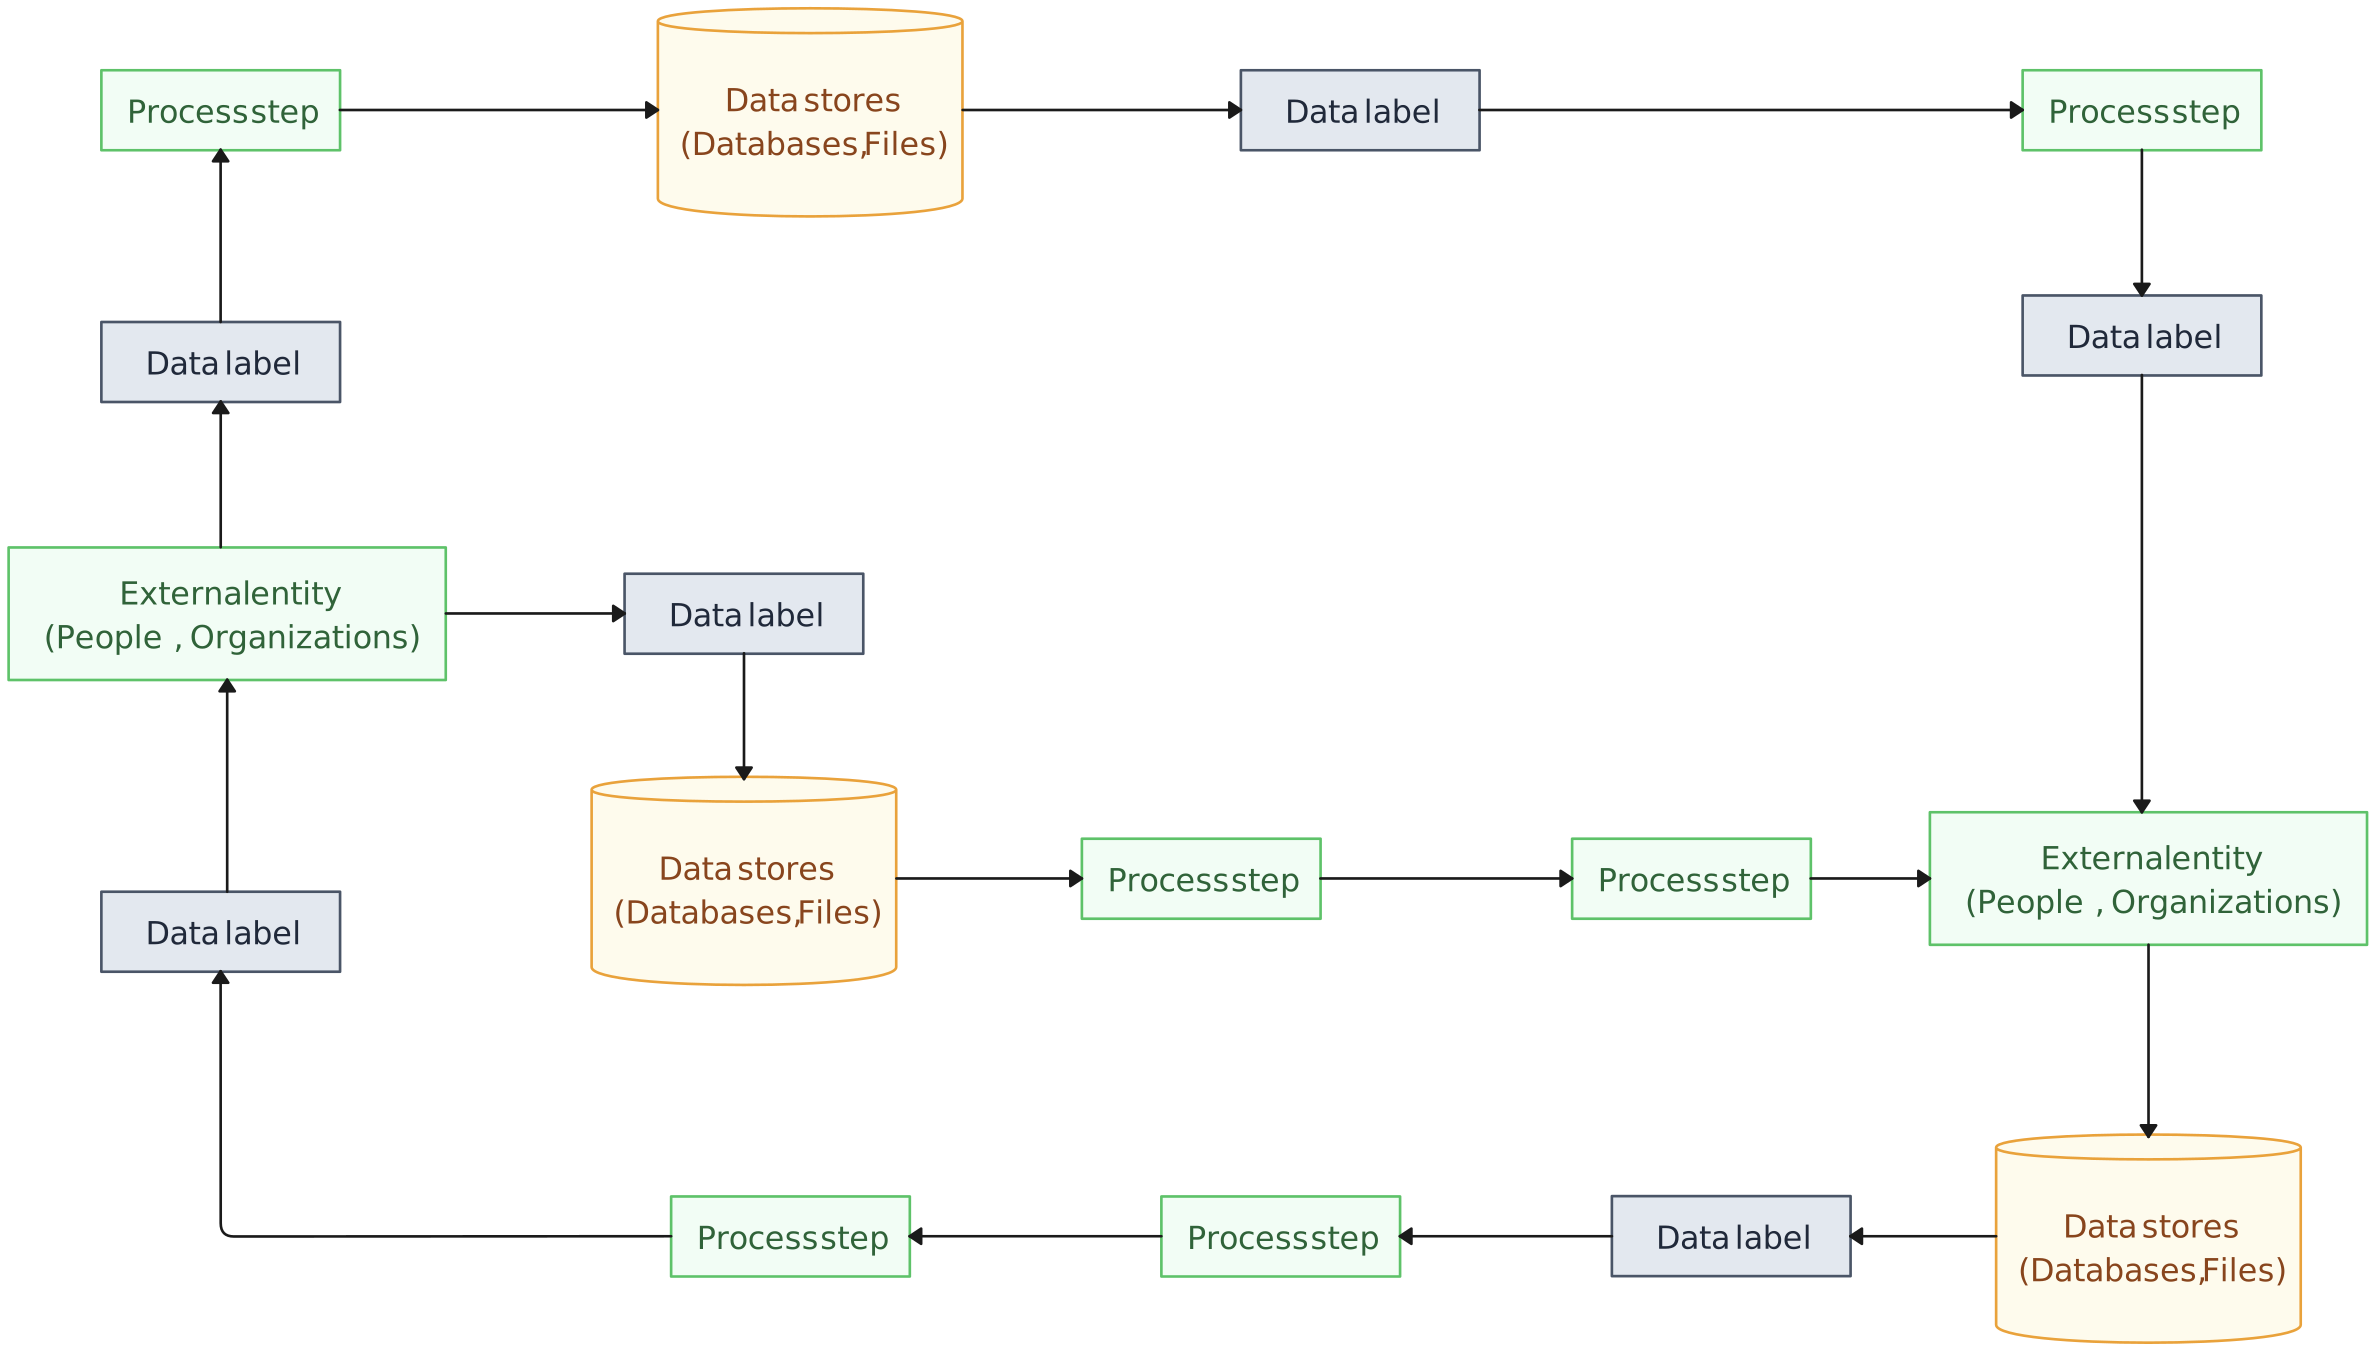
The existing templates below provide useful starting structures. They are not a matched logical-and-physical pair for the online-order example, so adapt their labels and flows rather than treating them as finished versions of that example.


More Guides on Mapping Data Flows
Choose the right visual for process steps or information movement.
Define a system boundary and its external data exchanges before adding internal detail.