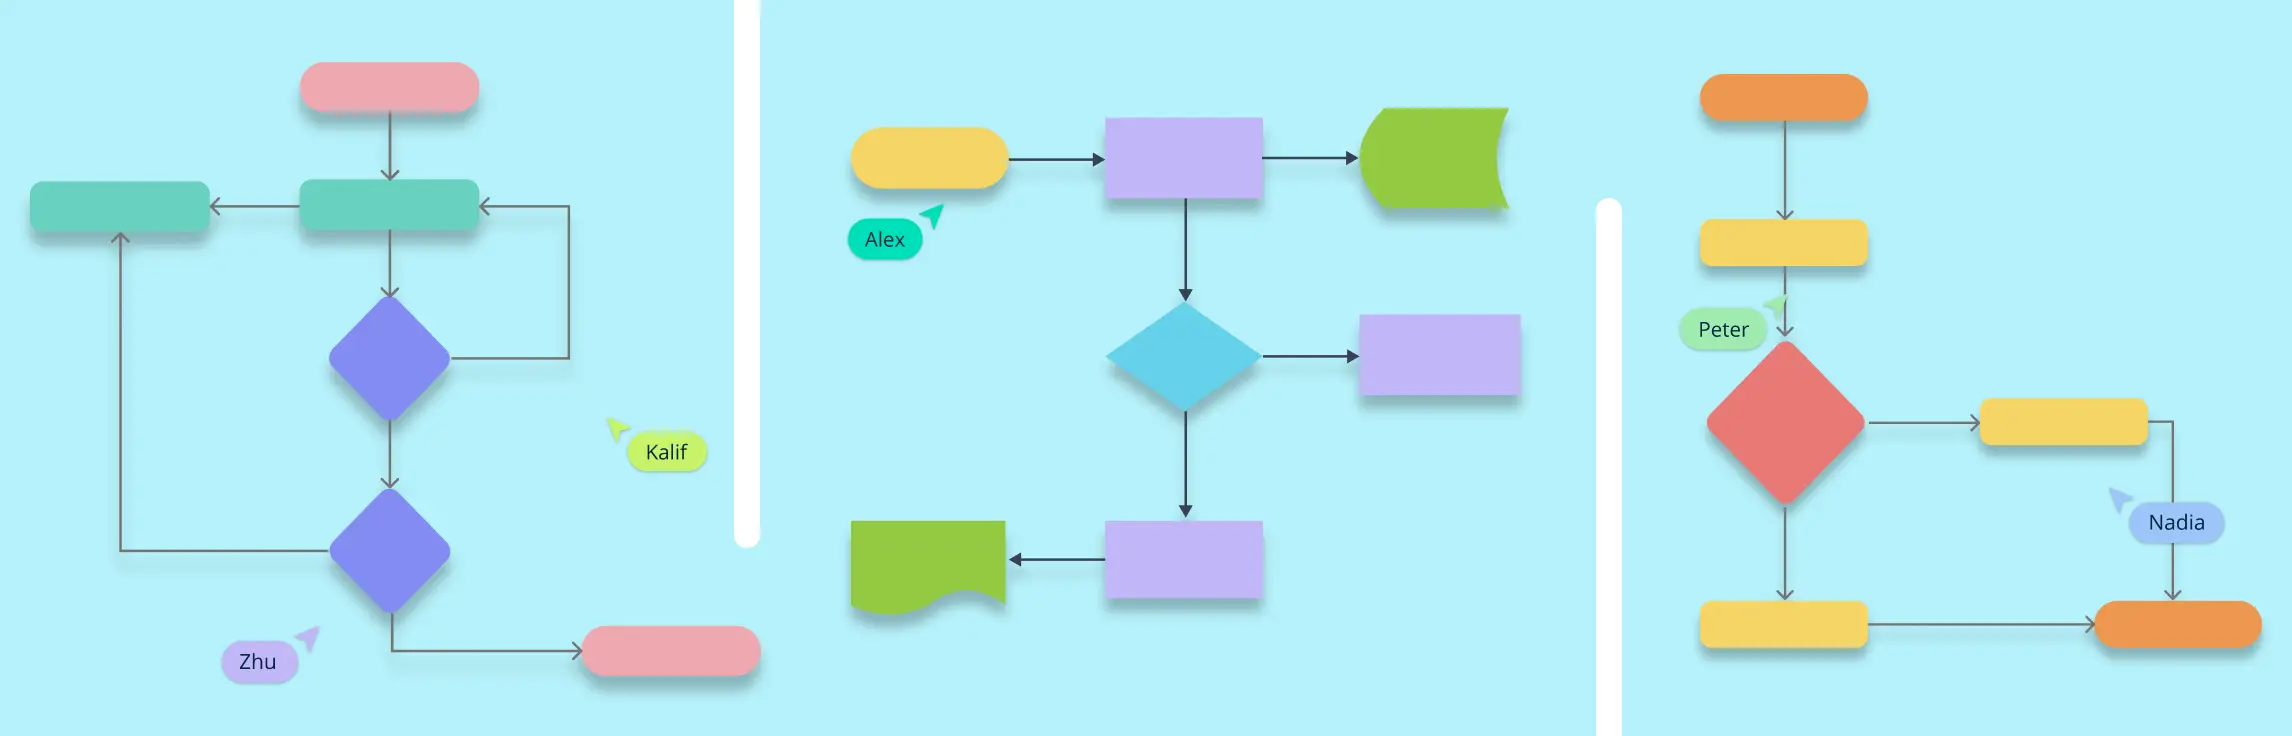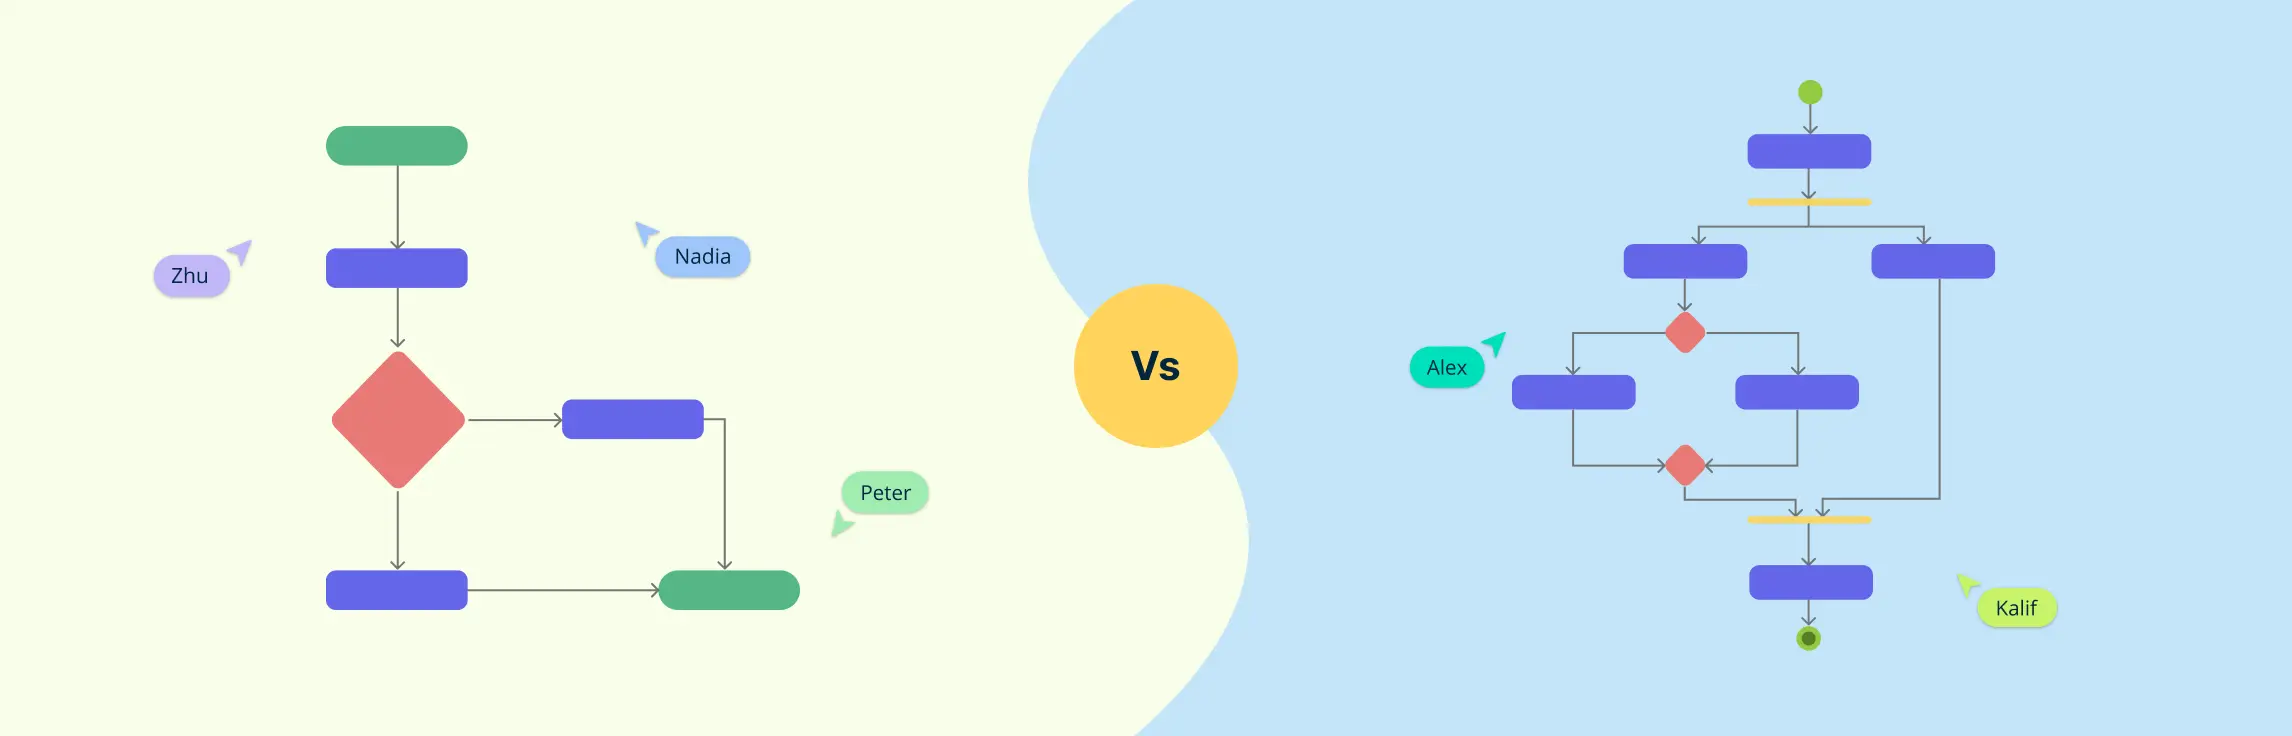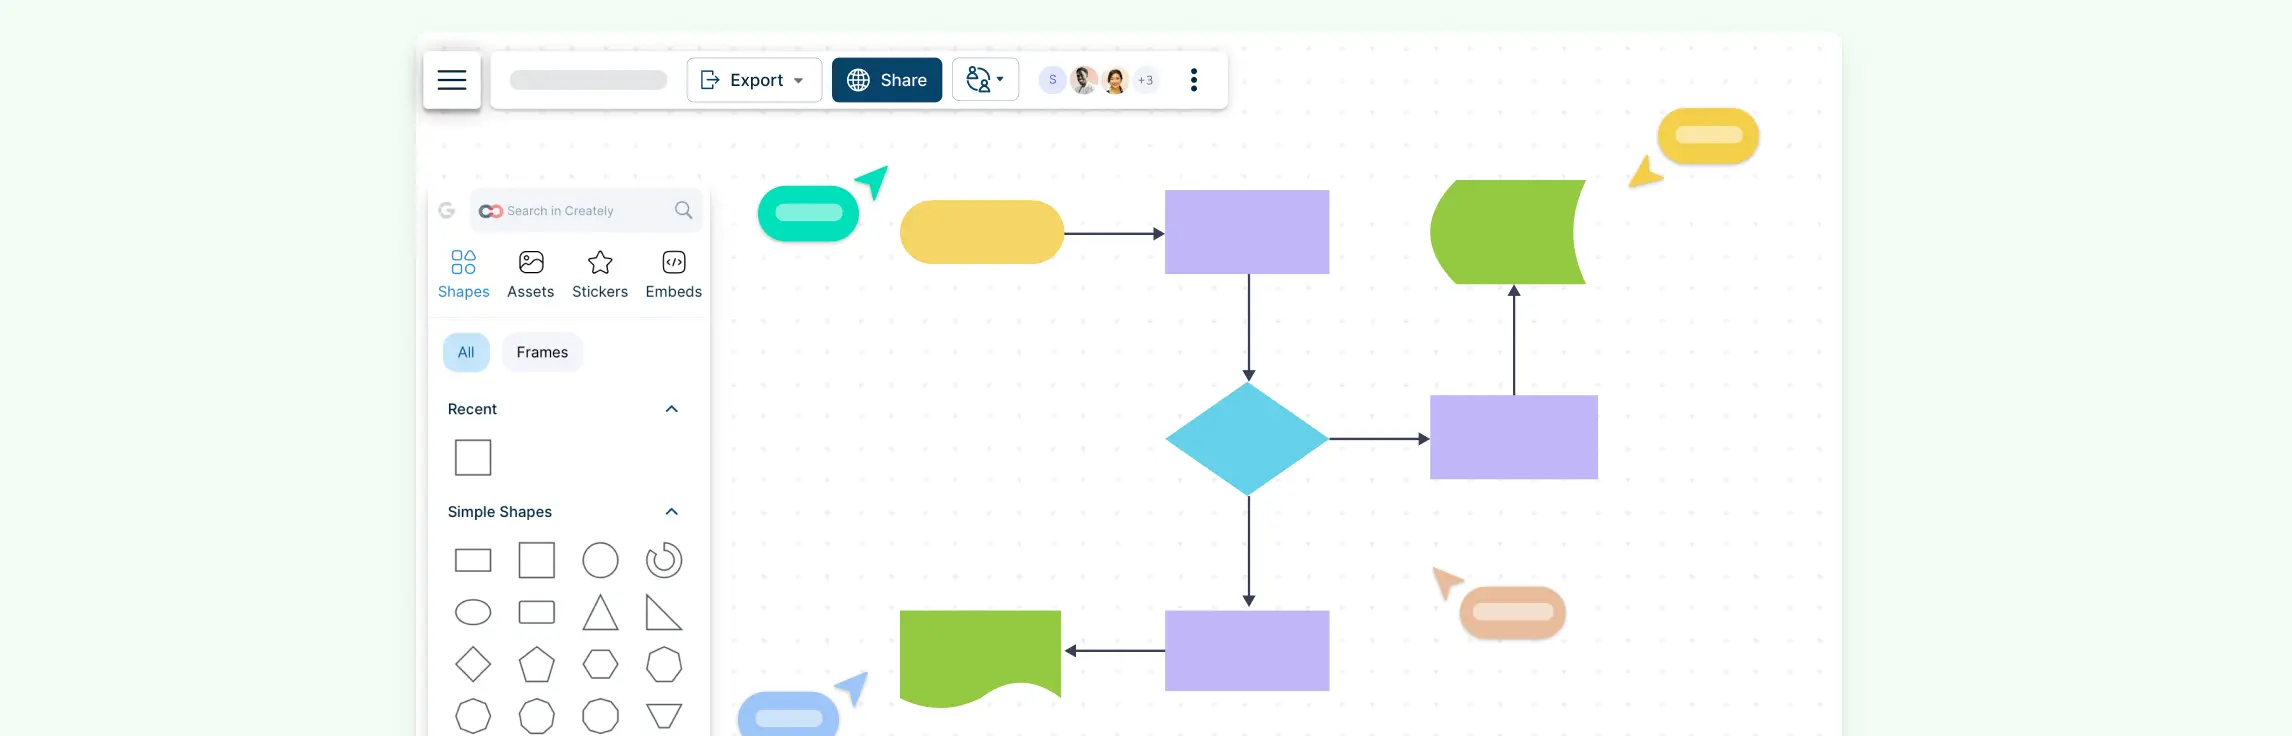
A decision flowchart is a simple yet powerful tool that visually maps out choices and outcomes, making decision-making easier. Whether for work, projects, or daily life, a decision-making flowchart helps clarify options and improve efficiency.
This guide explains what a decision flowchart is, why it’s useful, and how to create one. You’ll learn key elements, best practices, and tools to simplify choices and improve decision-making in any situation.
What Is a Decision Flowchart
A decision flowchart is a visual tool that maps out a decision-making process step by step. It uses symbols, such as rectangles for actions and diamonds for decision points, to show different choices and their potential outcomes. By clearly illustrating every “if/then”, a decision flowchart helps simplify complex logic, identify the best course of action, and reduce uncertainty.
These flowcharts are widely used in businesses, project management, and everyday problem-solving to improve efficiency and consistency. Whether choosing between multiple options, troubleshooting an issue, or streamlining a workflow, a decision-making flowchart provides a structured and logical framework for consistent and informed choices.
How to Create a Decision Flowchart
A well-structured decision-making chart clarifies the path forward and serves as a vital tool for effective communication and problem-solving within any organization. Follow these six steps to build a professional decision flowchart:
Step 1. Identify the Core Decision to be Made
Before creating a flowchart, clearly define the problem or decision you need to address. Ask yourself:
- What is the primary goal or desired outcome?
- What variables or factors influence the logic?
- Who are the stakeholders involved in the process?
A clear objective ensures that your decision-making chart remains focused and relevant. For example, if you are designing a flowchart for the hiring process, the decision could be whether to proceed with a candidate based on qualifications and interview performance.
Step 2. Break Down the Decision Points
List all possible options, criteria, and outcomes. This helps you understand the different branches your decision-making flowchart can take. Consider the available choices at each step and the specific consequences of every “Yes” or “No” path.
- What choices are available at each step?
- What criteria must be met to move forward?
- What are the possible consequences of each option?
For example, in a hiring process, potential outcomes might include hiring the candidate, scheduling a second interview, or rejecting the application.
Step 3. Determine the Sequence of Actions
Establish a logical order of steps leading to the final outcome. This ensures that each action flows smoothly into the next. To do this:
- Identify what happens first, next, and last.
- Arrange the decision points in a way that prevents confusion.
- Ensure that each action leads to a clear result or further decision.
For instance, in a hiring process, the sequence might start with reviewing resumes, followed by conducting interviews, then evaluating candidates, and finally making a hiring decision.
Step 4. Use Standard Flowchart Symbols
Flowcharts use universally recognized flowchart symbols to represent different types of actions and decisions. The most commonly used symbols include:
| Symbol | Name | Use in Decision Flowchart |
|---|---|---|
| Oval | Terminator | Represent the start and end of the process |
| Diamond | Decision | Indicate critical decisions in the flowchart, such as Yes/No or True/False choices. |
| Rectangle | Process | Indicates a specific action or task. |
| Arrow | Flowline | Connect steps and show the flow of the decision-making process. |
Using these symbols correctly makes the flowchart easy to read and understand.
Step 5. Connect the Symbols
Once your symbols are placed, use arrows to link them. Ensure that every decision-making flowchart path leads to a clear result and that there are no “orphaned” steps. The layout should be easy to follow, even for stakeholders who weren’t involved in the initial design. Make sure:
- Arrows clearly show how decisions lead to different paths.
- There are no disconnected steps.
- The layout is easy to follow, avoiding unnecessary complexity.
For example, if a candidate passes an interview, an arrow might lead to a job offer, while a failed interview might lead to a rejection letter.
Step 6. Review and Test the Flowchart
Walk through the finished decision flowchart as if you were following it in real life. Share the decision-making chart with your team for feedback to identify any logical gaps or unnecessary complexities. Testing ensures the tool is practical for guiding organizational choices. You can:
- Walk through the flowchart step by step as if following the process in real life.
- Share it with team members or stakeholders for feedback.
- Adjust or simplify parts that seem unclear or overly complicated.
Testing ensures that the decision-making flowchart is practical and effective in guiding choices.
Decision-Making Flowchart Examples
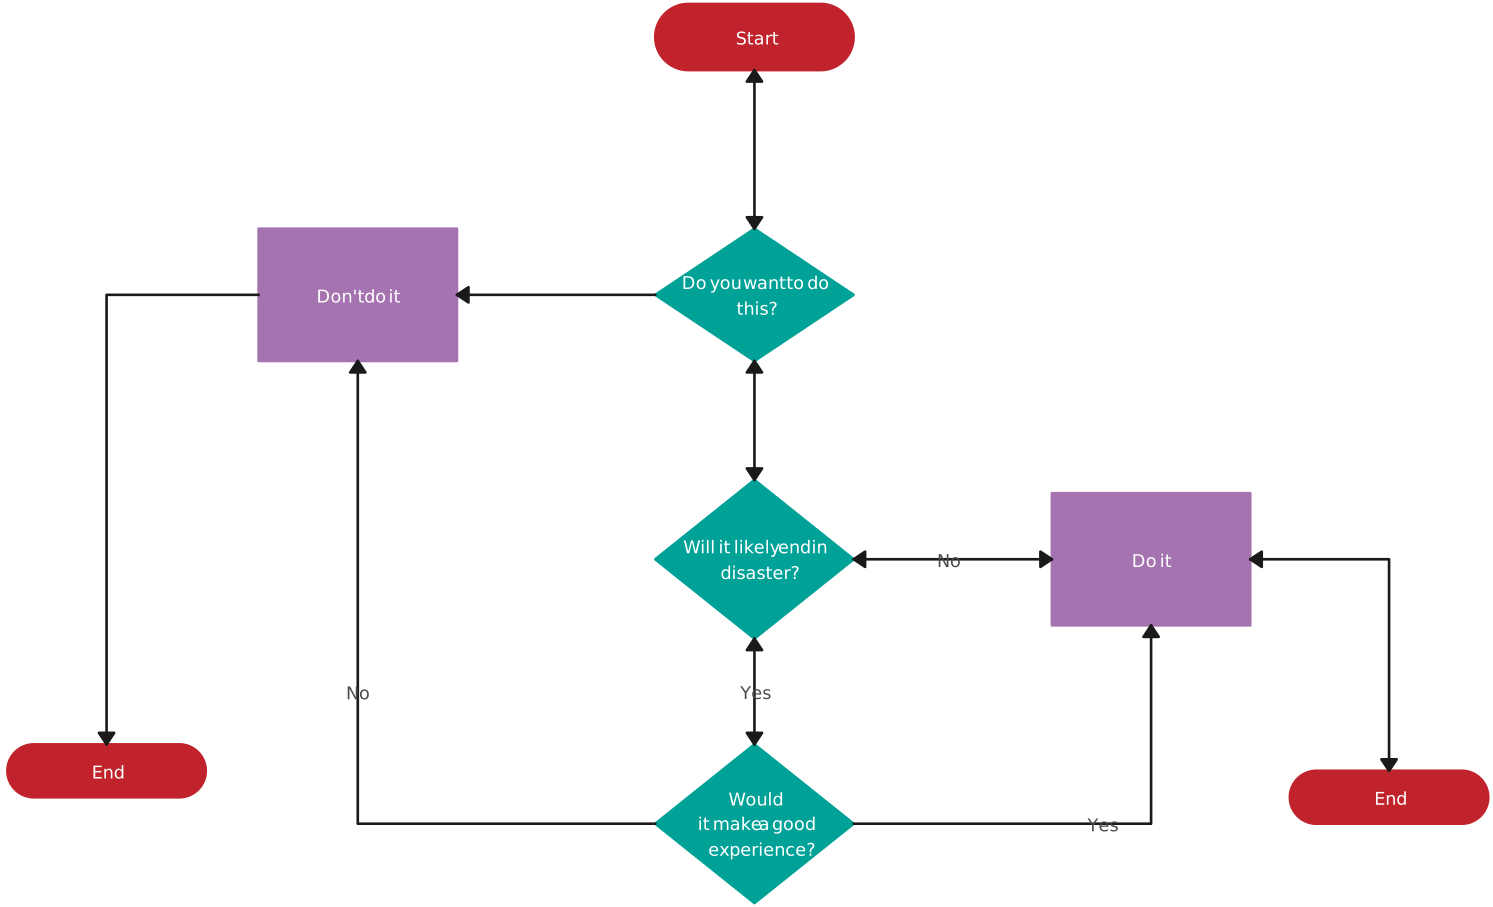
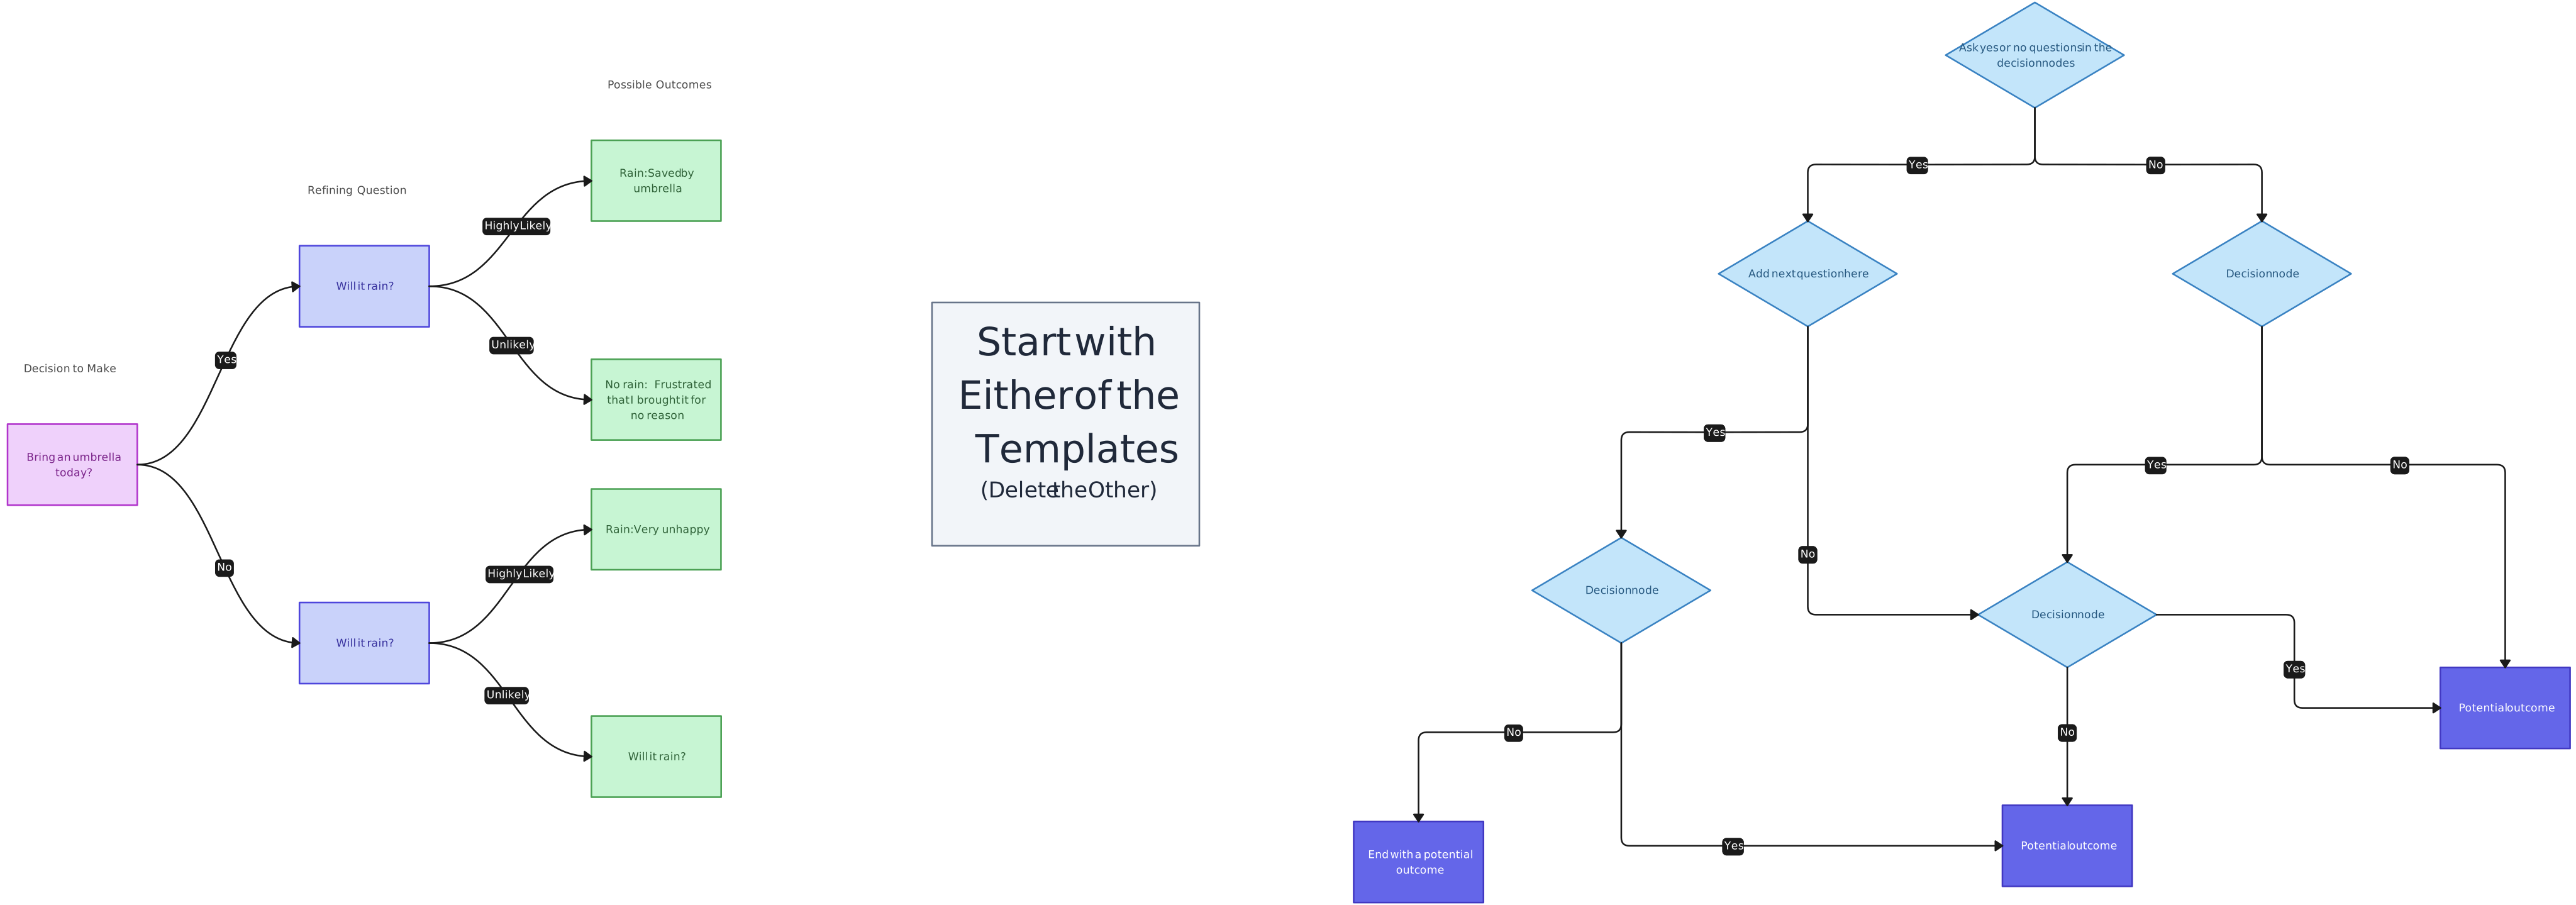
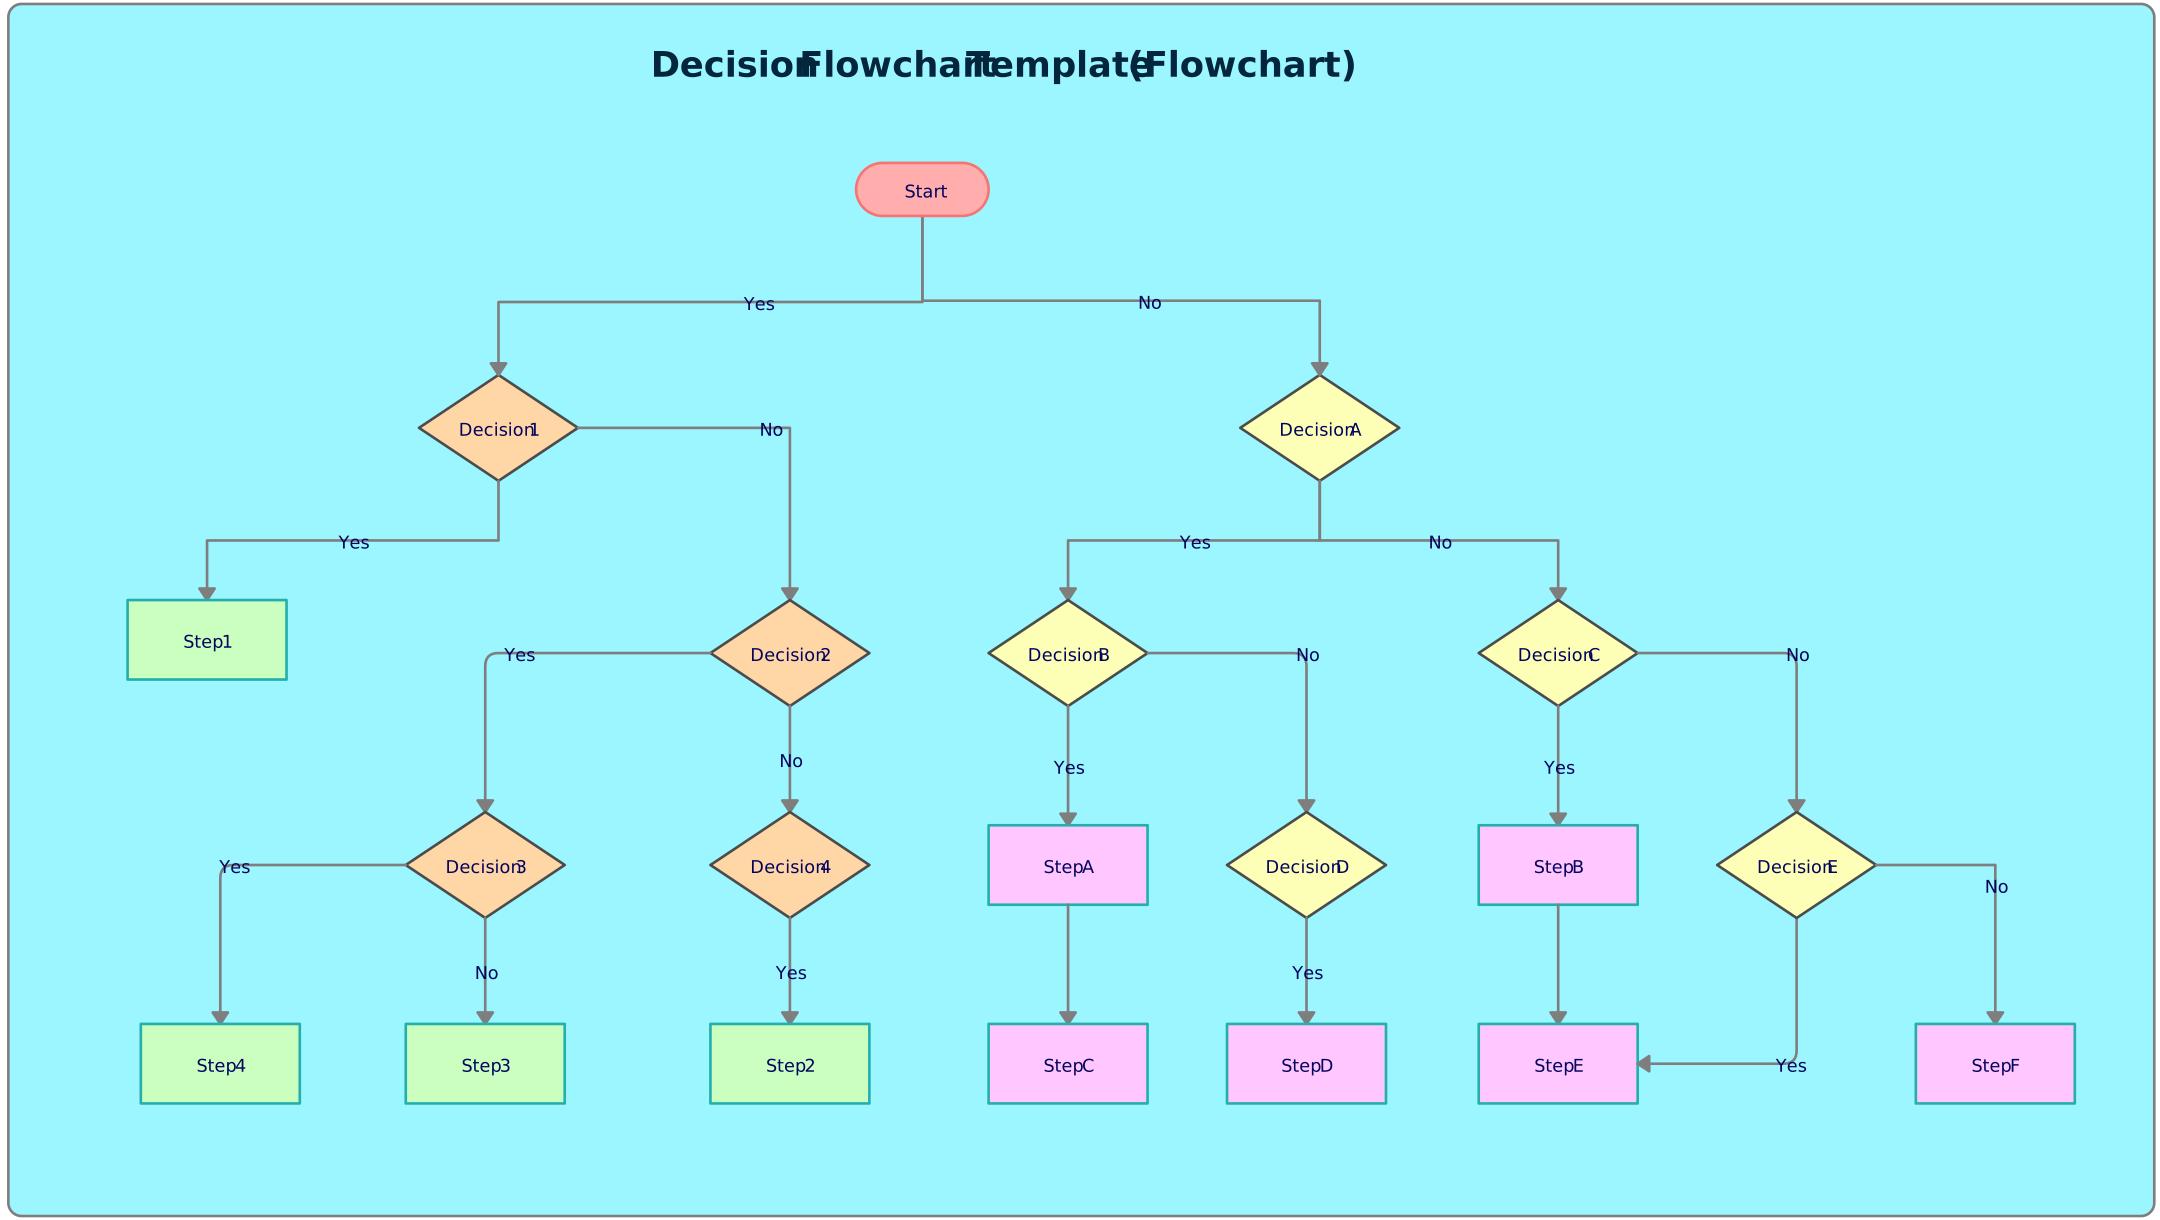
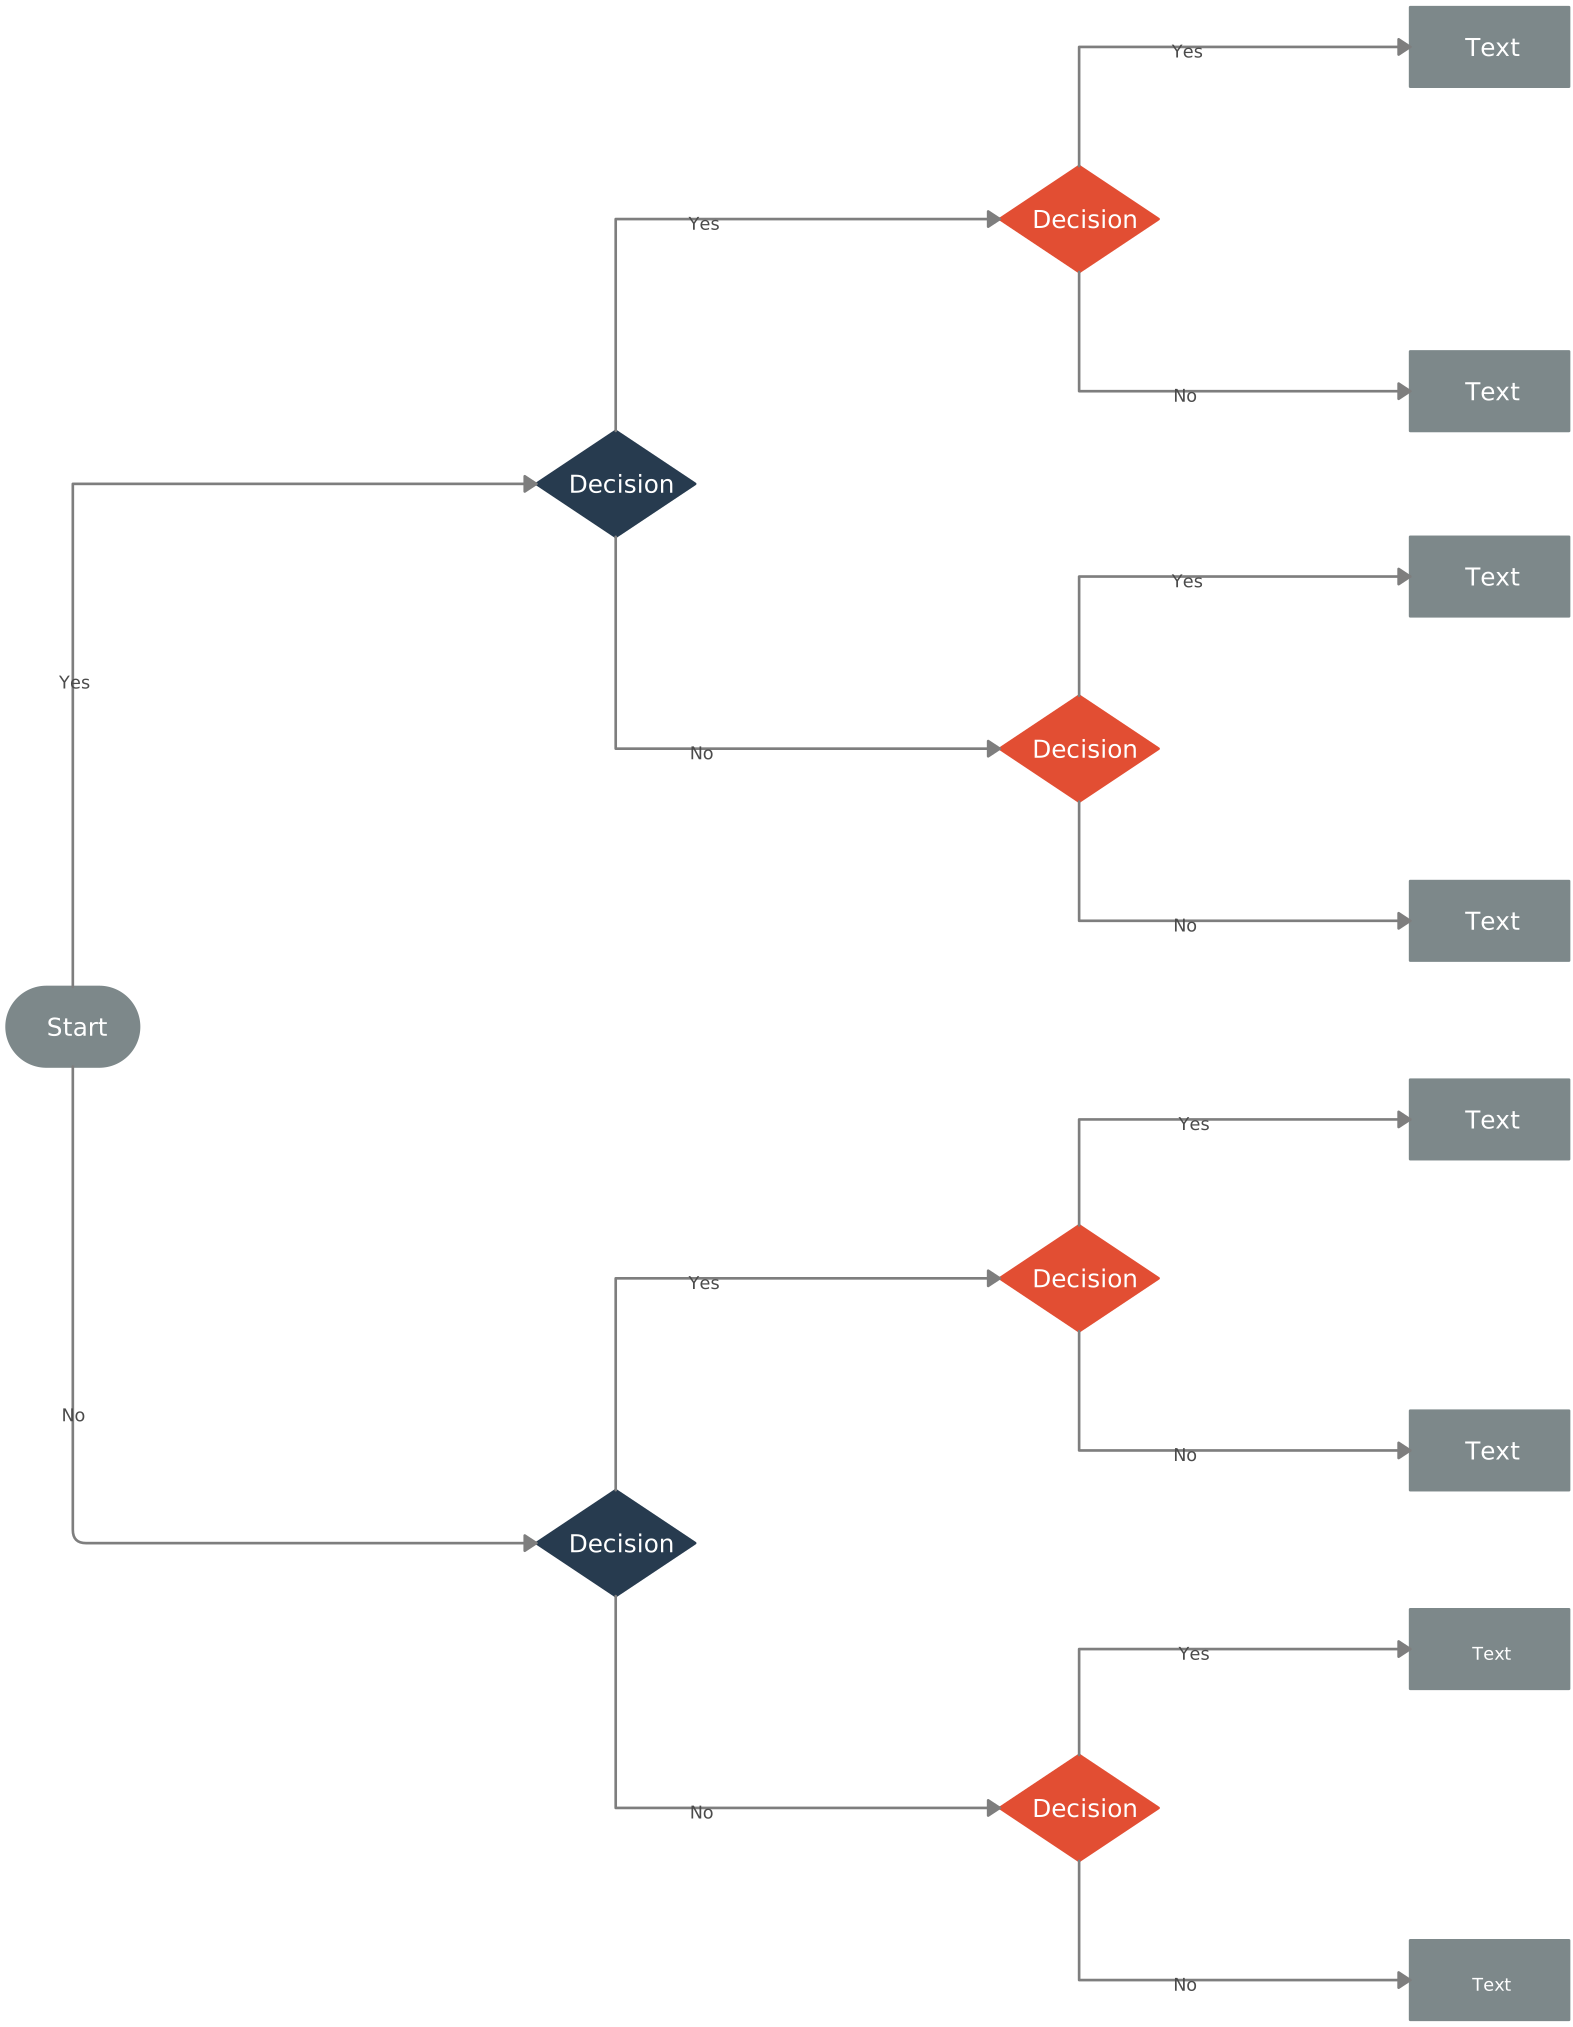
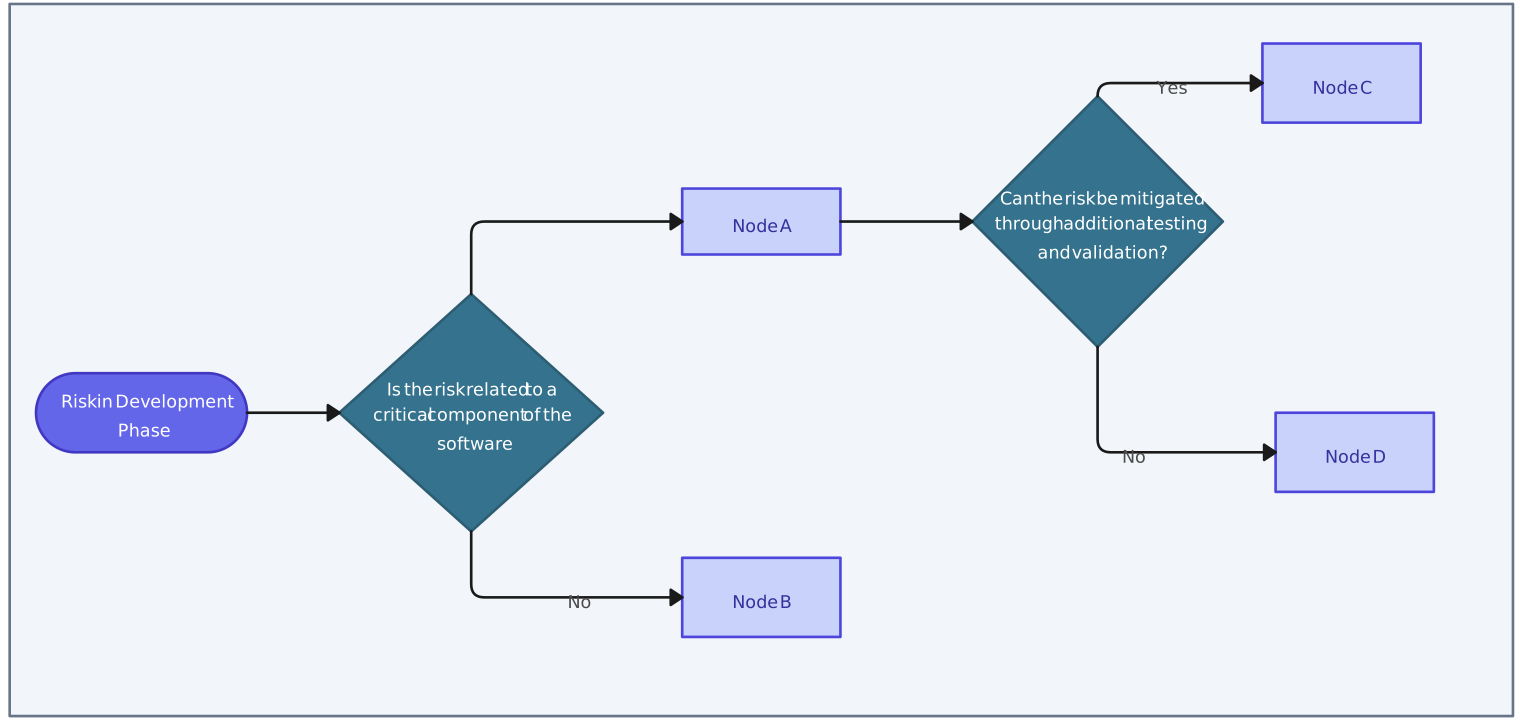
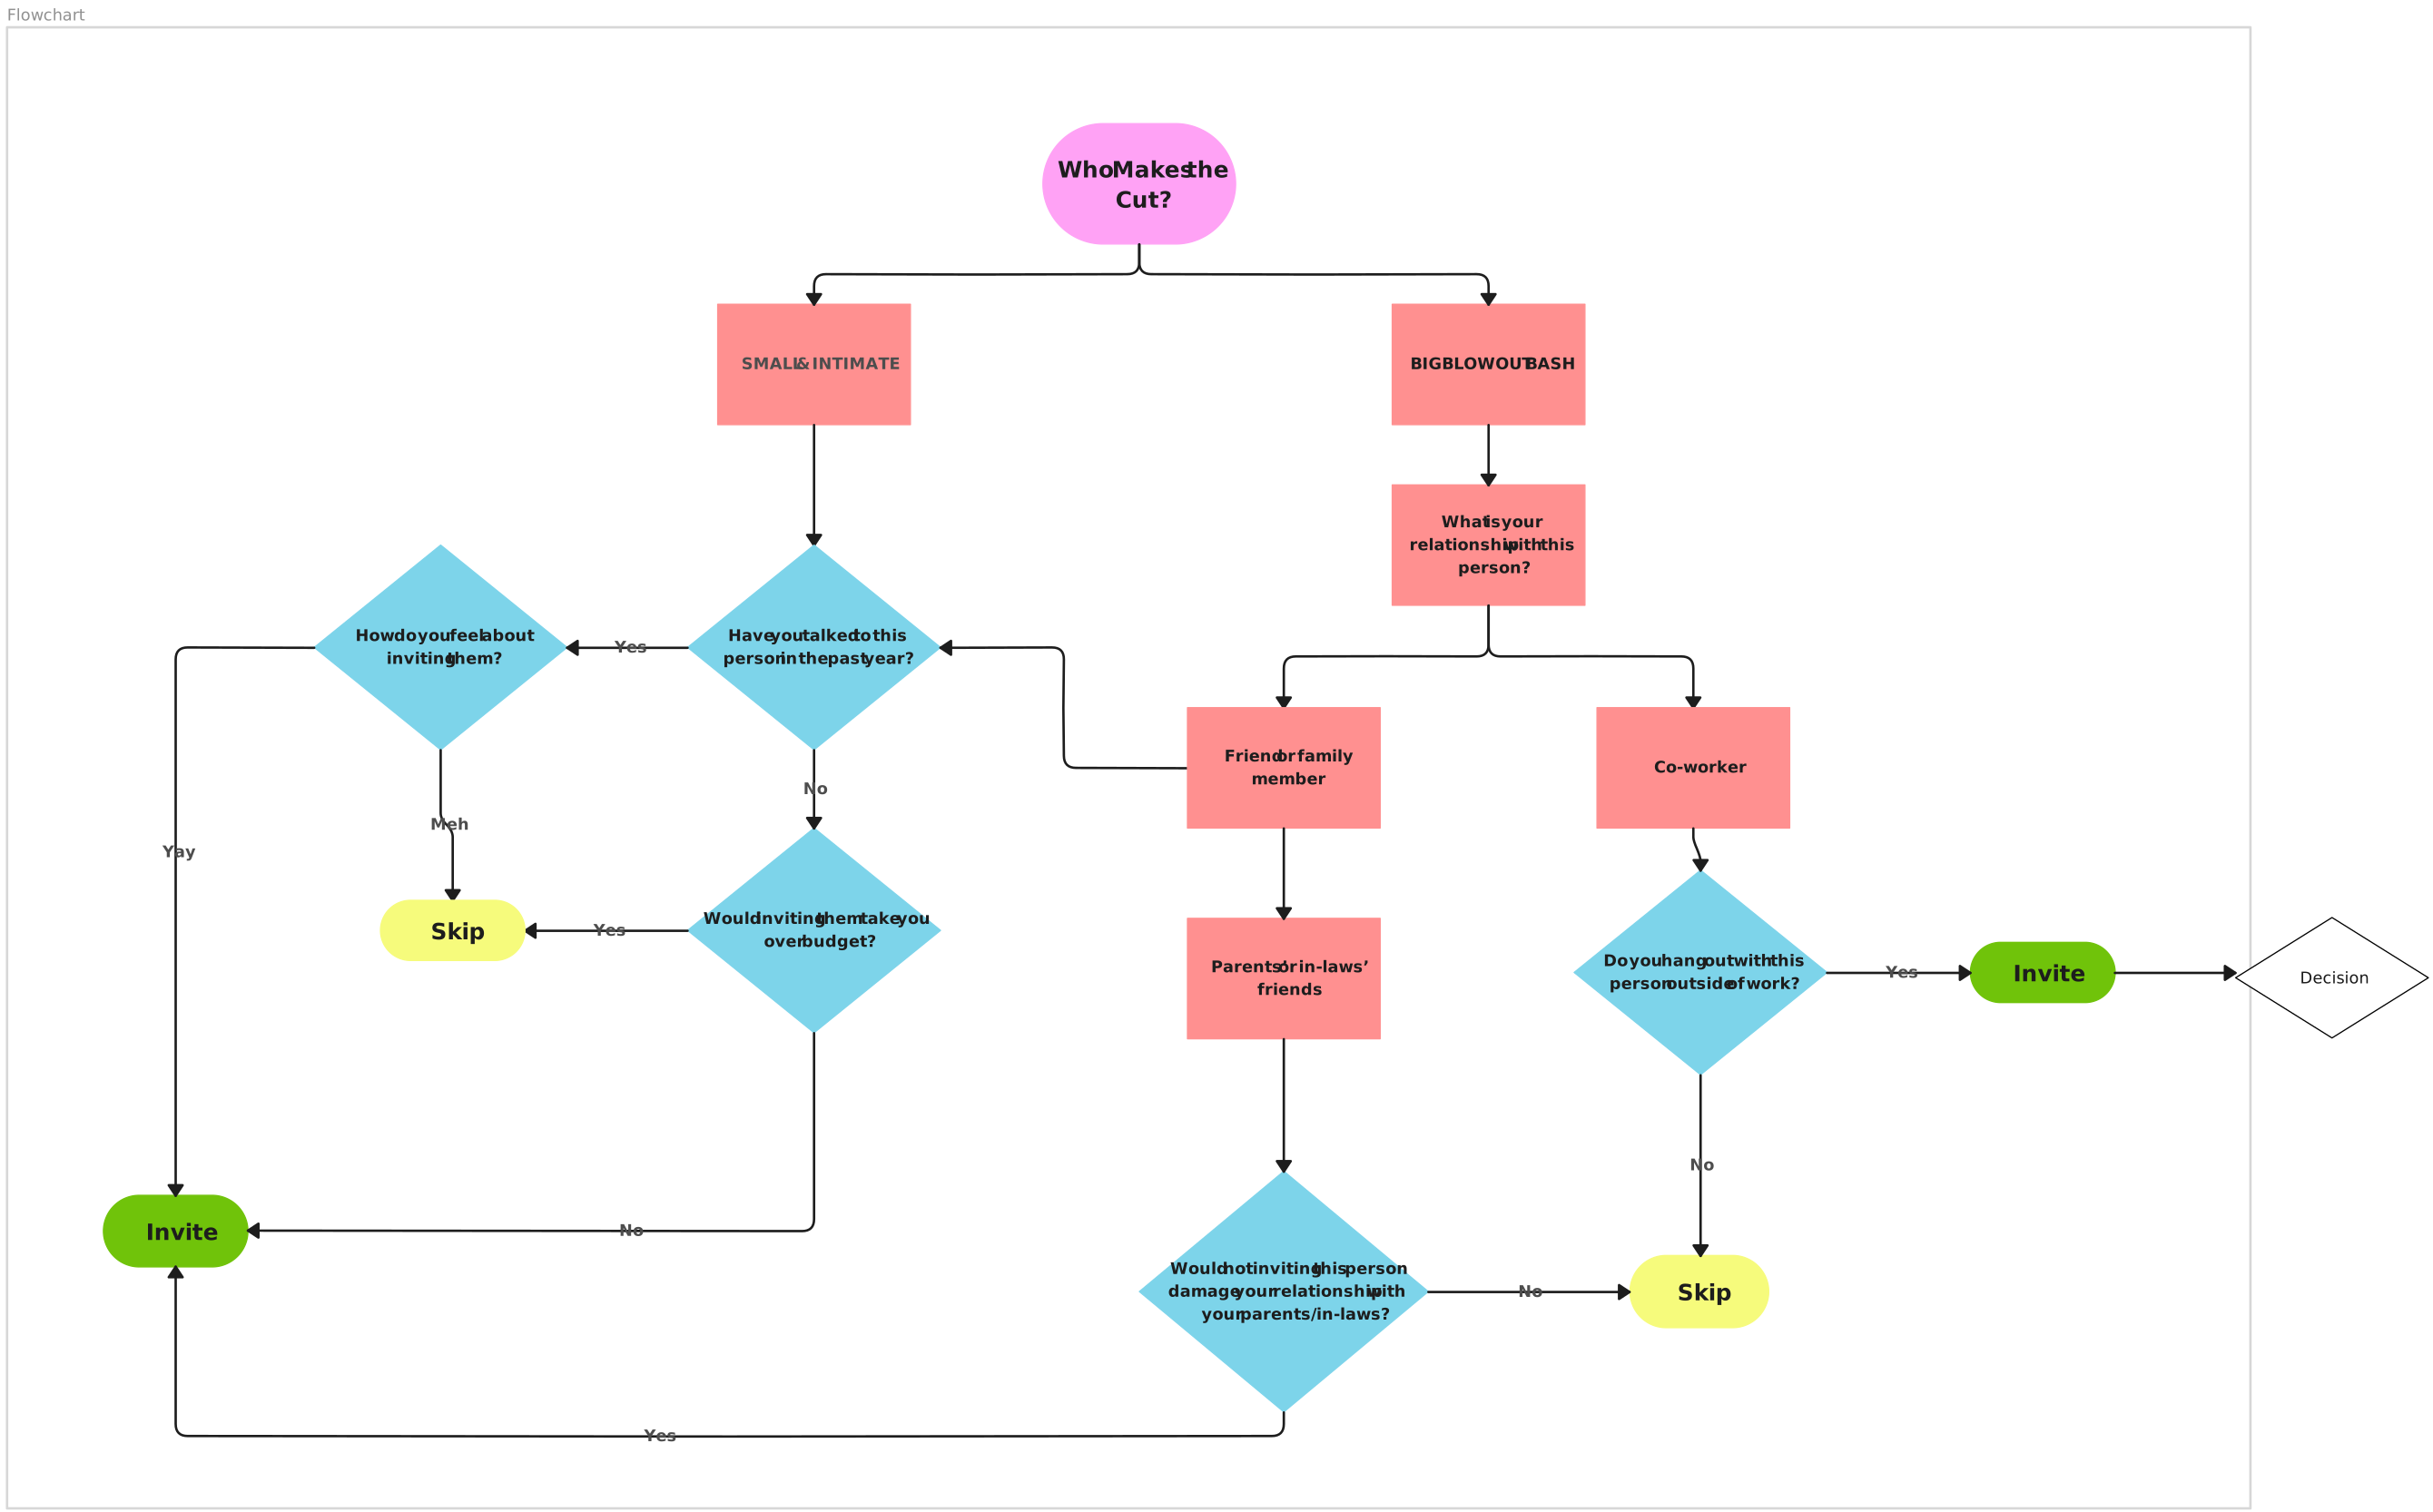
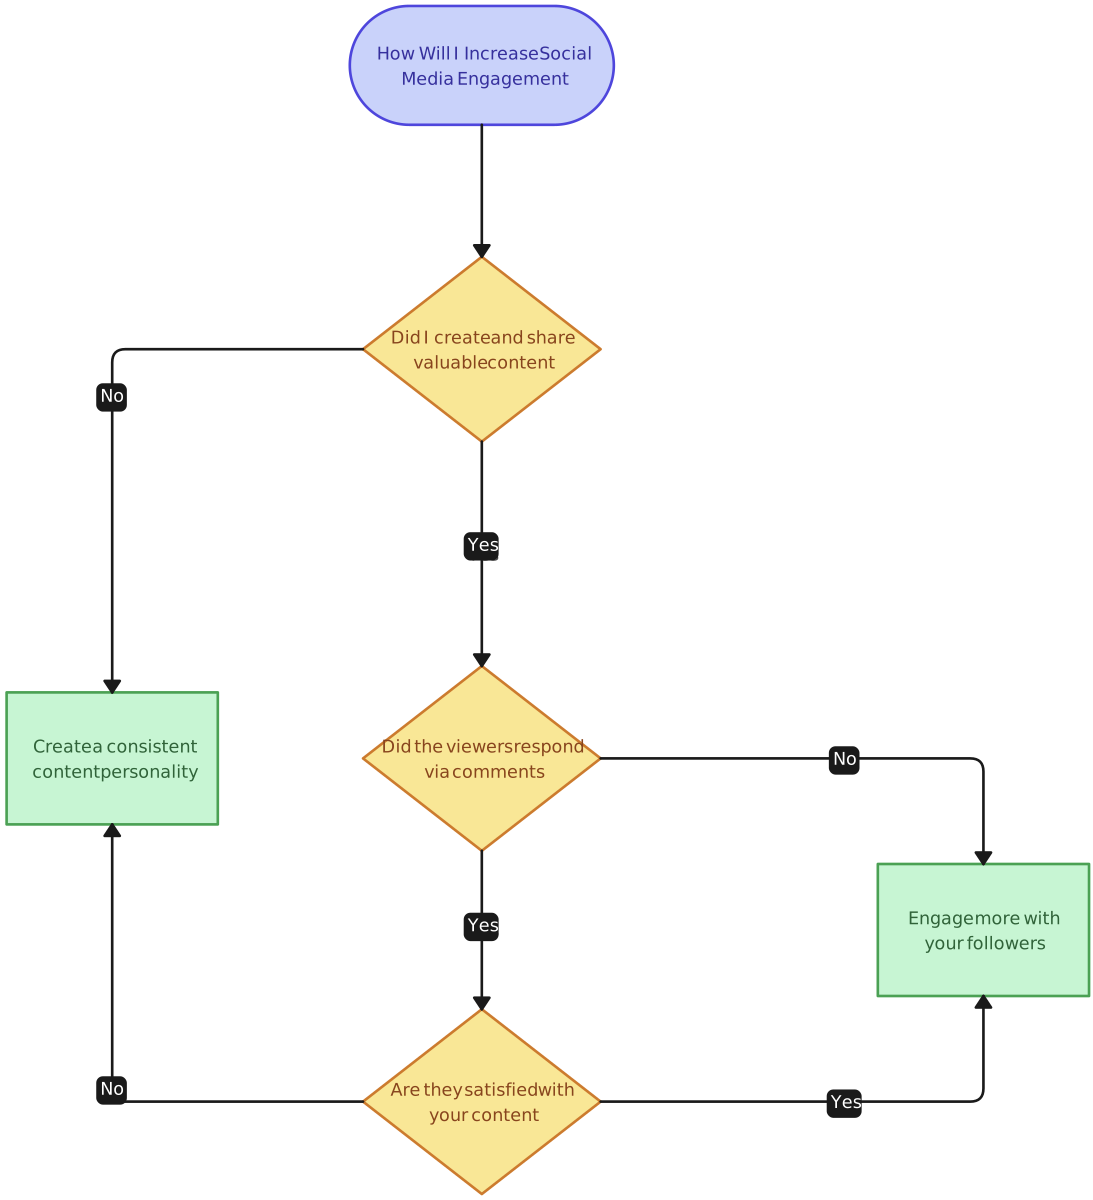
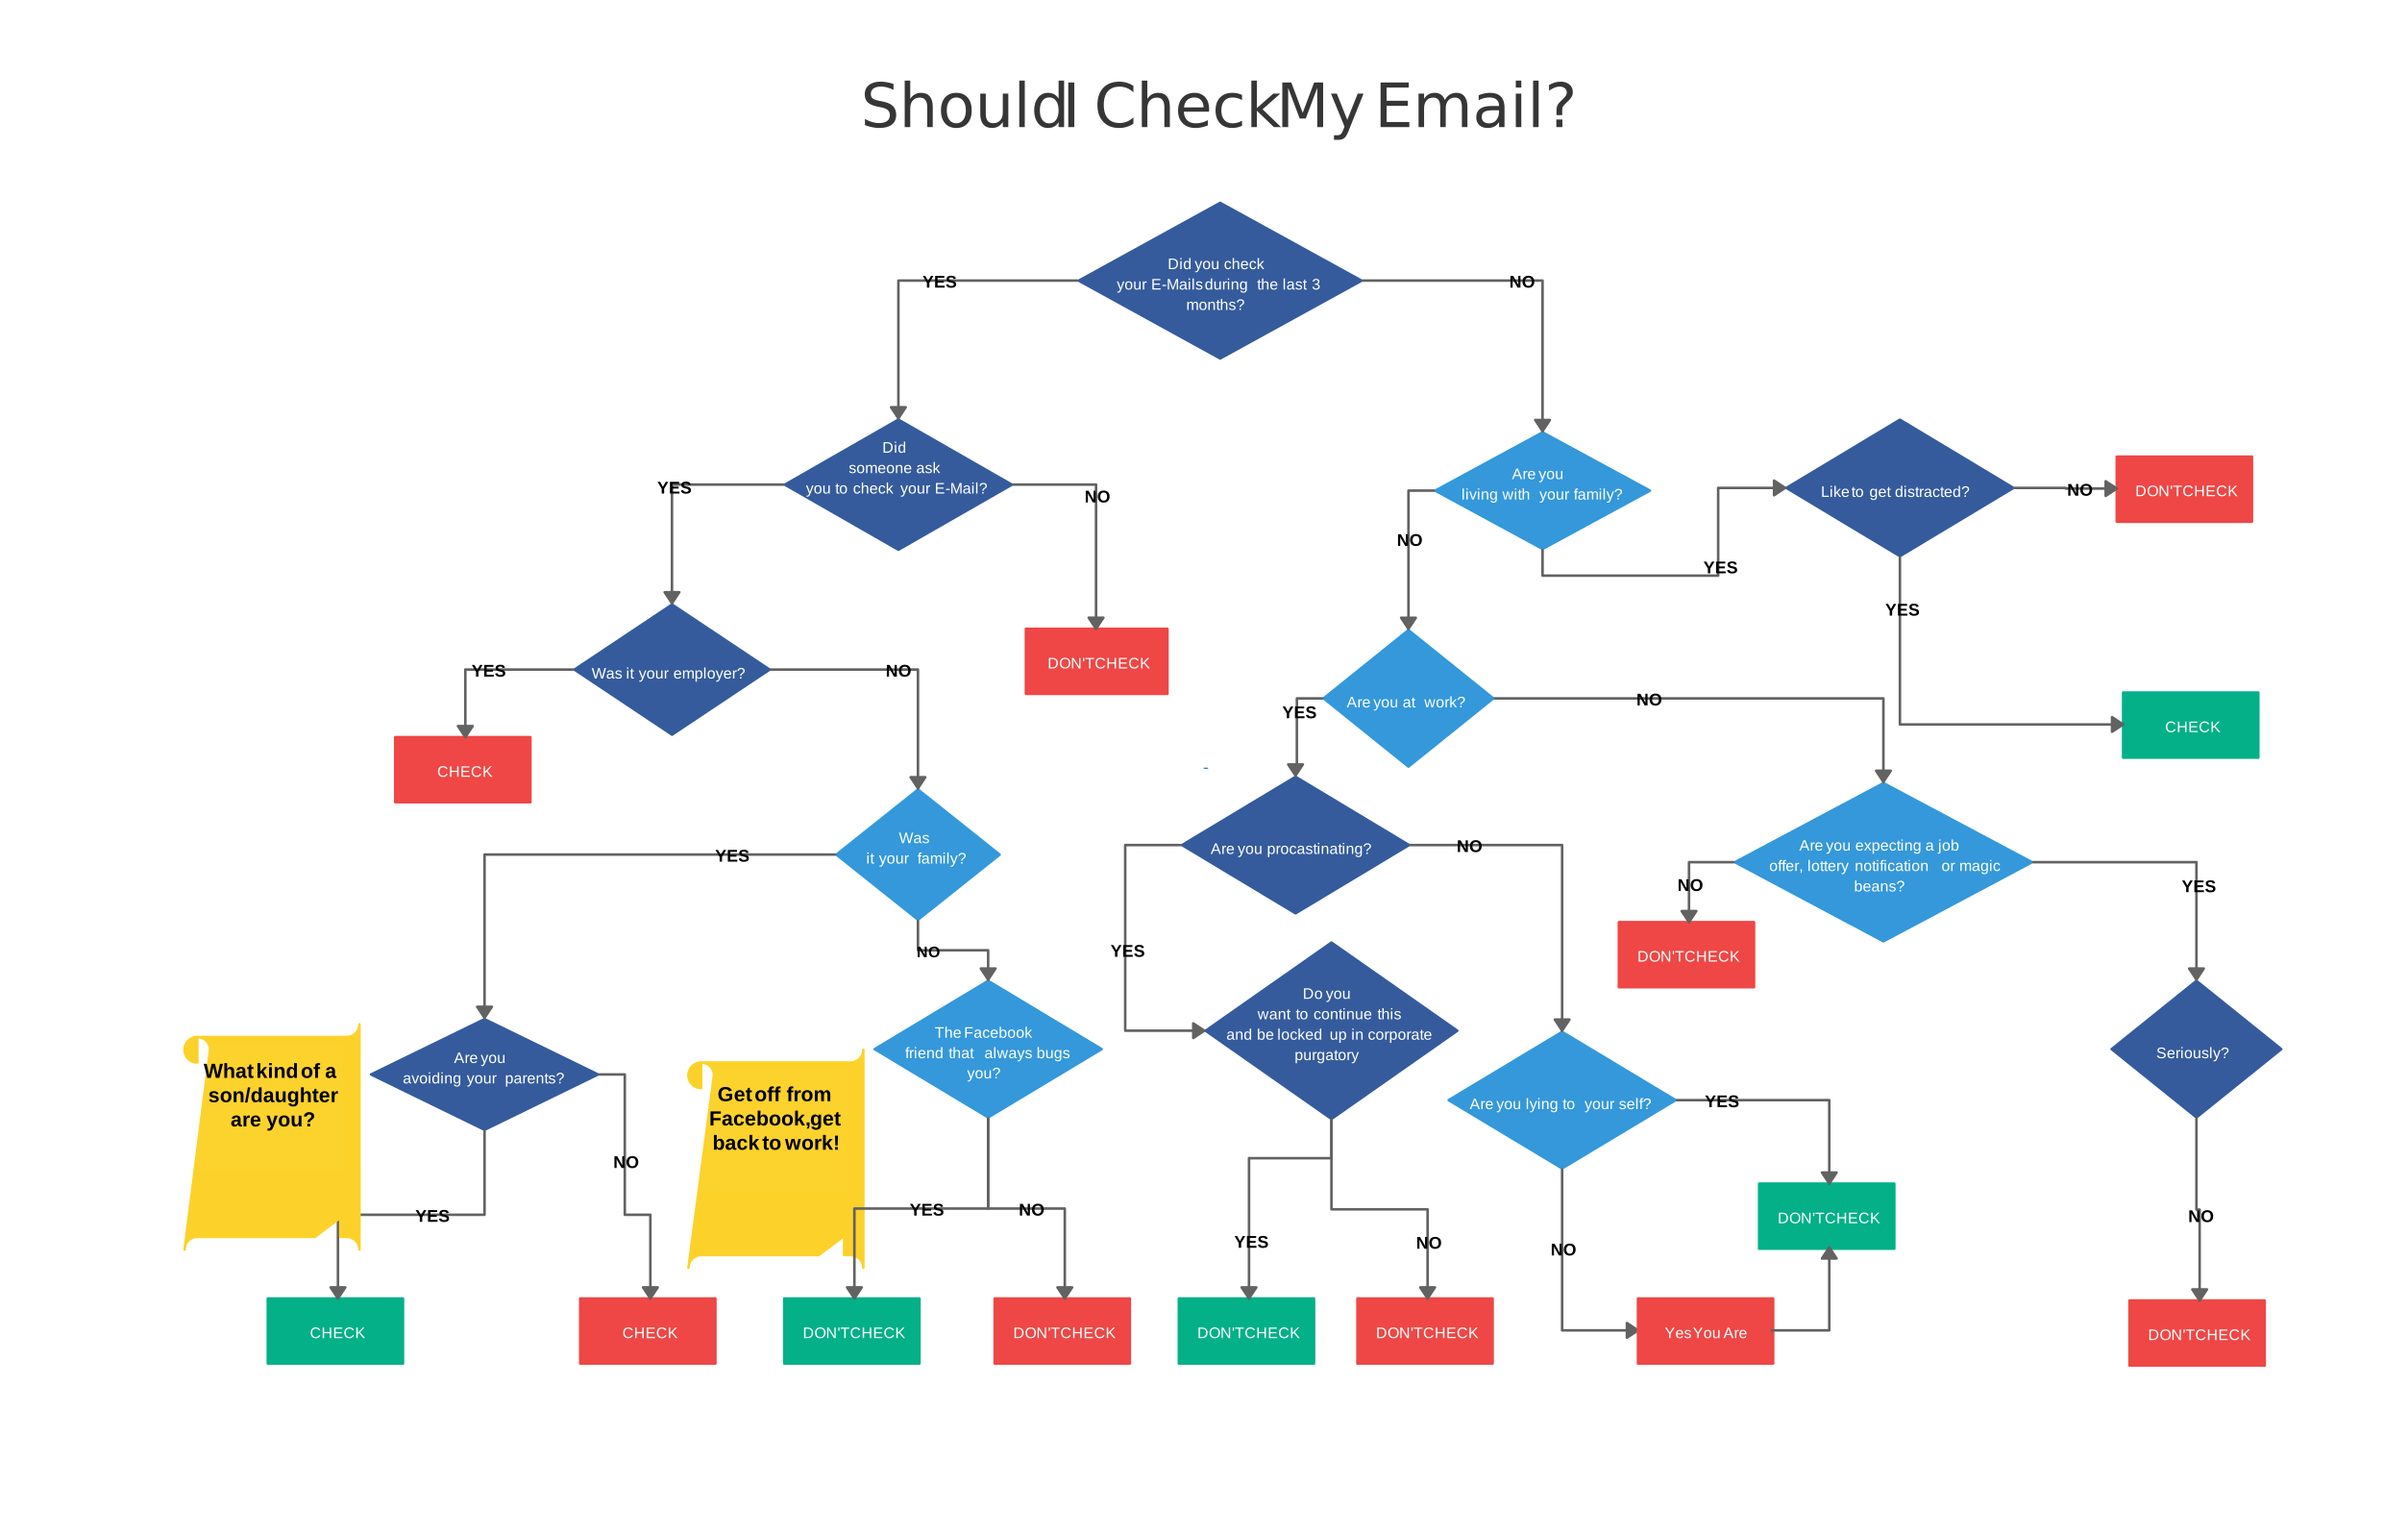
Here are decision-making flowchart templates that can help you get started with your decision-making process. Whether you’re looking to map out a simple decision or handle more complex scenarios, these templates are designed to provide a clear, structured approach. You can customize them to fit your specific needs, making decision-making easier and more efficient.


When Should You Use a Decision Flowchart?
A decision flowchart is more than just a diagram; it is a structural blueprint for logic. By mapping out various choices and outcomes, a decision-making chart ensures a systematic analysis of any situation.
Whether in a professional boardroom or for personal planning, here is when you should deploy a decision-making flowchart:
1. Navigating Complex Decision-Making
When a choice involves multiple variables or cascading “if/then” factors, a decision flowchart simplifies the process by breaking it into manageable segments. This prevents “analysis paralysis” and allows you to focus on one logical gate at a time—critical for tasks like choosing enterprise software or diagnosing technical system errors.
2. Evaluating Multiple Alternatives
If you are weighing several options simultaneously, a decision-making chart allows you to compare them side-by-side within a shared logic. For example, when evaluating job offers or vendor proposals, the chart helps you weigh salary, benefits, and culture against a set of standardized criteria to find the optimal path.
3. Clarifying and Streamlining Processes
Use a decision-making flowchart to identify inefficiencies in your current workflow. By visualizing the decision in the flowchart—the exact point where a choice is made—you can spot unnecessary steps, bottlenecks, or “dead ends” in customer service protocols and operational pipelines.
4. Enhancing Stakeholder Communication
A decision flowchart serves as a visual “source of truth” for teams. Instead of long, confusing email chains, a shared decision-making chart keeps stakeholders aligned, ensuring everyone understands the rationale behind a chosen path and the intended outcome.
5. Ensuring Operational Consistency
In business, standardizing how choices are made is vital for fairness and efficiency. Implementing a decision-making flowchart across departments ensures that every team member follows the same logic, leading to predictable and high-quality results every time.
Pro Tip: If your process is non-linear, you can use Creately’s infinite canvas to build “nested” decision paths, allowing you to scale your decision-making chart from a simple “Yes/No” to a massive, multi-departmental logic web.
Key Benefits of a Decision-Making Flowchart
Integrating a decision-making flowchart into your workflow transforms abstract logic into an actionable blueprint. Whether you are managing an enterprise reorg or a simple project shift, using a decision-making chart provides several strategic advantages:
1. Simplify Complex Logic
Complex choices often lead to “analysis paralysis.” A decision-making flowchart breaks intricate processes into bite-sized, manageable steps. By visualizing each decision in the flowchart, you can navigate multifaceted problems without losing sight of the primary goal.
2. Enhance Stakeholder Transparency
A visual decision-making chart acts as a “single source of truth.” It allows stakeholders to see exactly how a conclusion was reached, exposing the underlying reasoning. This transparency builds trust, especially in high-stakes environments like HR audits or financial forecasting.
3. Streamline Team Communication
Miscommunication often stems from scattered documentation. A shared decision-making flowchart ensures everyone is on the same page. Using a collaborative canvas allows teams to discuss specific logic branches in real-time, eliminating the need for long, confusing email threads.
4. Proactively Identify Logic Gaps
By laying out every possible path in a decision-making chart, you can spot potential bottlenecks or “dead ends” before they become real-world problems. This proactive approach allows you to build “fail-safes” into your process, ensuring that every scenario has a clear resolution.
5. Standardize Organizational Consistency
For businesses, consistency is the key to efficiency. A decision-making flowchart standardizes procedures, ensuring that similar situations are handled with the same logic across different departments. This leads to fairer outcomes and a more predictable operational model.
Limitations of a Decision-Making Flowchart
While decision-making flowcharts are valuable tools, they come with certain limitations:
1. Complexity in representation
For decisions involving many possible outcomes or conditions, decision flowcharts can become overly complex. With too many decision points, it may be hard to follow the flow, reducing the clarity of the chart.
2. Difficulty in handling uncertainty
Decision flowcharts may struggle to represent uncertain or subjective factors. When decisions rely on factors that are unpredictable or based on intuition, flowcharts can’t effectively capture this uncertainty, leading to oversimplification.
3. Potential for oversimplification
While flowcharts are meant to simplify decision-making, they can sometimes leave out important details. Key nuances or context-specific factors might be missed, making the flowchart less effective for making a fully informed decision.
4. Inability to show long-term effects
Decision flowcharts typically focus on immediate actions or outcomes. They may not effectively capture long-term consequences of a decision, such as future risks or benefits, leading to an incomplete analysis of options.
5. Challenges with subjective decision points
If a decision relies heavily on subjective judgment, a flowchart can be difficult to construct. Decision-making often includes elements like personal values or emotions, which flowcharts may not be able to fully capture or represent accurately.
6. Lack of flexibility
Once a decision flowchart is created, making changes or adjustments can be time-consuming. If the situation changes or new information emerges, the flowchart may require significant updates to remain relevant, limiting its adaptability.
Streamline Creating Your Decision-Making Flowcharts with Creately
Building a professional decision flowchart is faster and more intuitive with Creately’s Flowchart Software. Whether you are architecting a complex business strategy or a simple decision-making chart, our platform automates the tedious formatting so you can focus on the logic.
Simplified Decision Flowchart Creation
Creately’s drag-and-drop interface allows you to place decision points, actions, and outcomes on an infinite canvas effortlessly. With a vast library of smart Shapes, your decision-making flowchart stays perfectly aligned; when you move one node, the connectors adjust automatically, saving you hours of manual cleanup.
Creately AI: From Text to Flowchart in Seconds
Don’t start with a blank page. Using Creately AI, you can describe your logic simply—for example, “Generate a decision-making flowchart for a 3-step refund approval process”—and the tool will instantly build the entire structure for you. This AI-powered approach ensures your decision-making chart is built on a foundation of best practices without the manual effort.
Real-Time Collaboration for Faster Consensus
Decisions rarely happen in a vacuum. Creately’s shared workspace allows your entire team to jump onto the same decision-making flowchart simultaneously. Use multiple cursors to refine paths, leave @mentions for specific stakeholders, and reach a consensus faster and together.
Dynamic Customization & Deep Context
As your strategy evolves, your decision-making chart should too. Use color-coding to highlight high-risk paths or use the Notes & Data Panel to attach detailed documentation, links, or specific metrics to any decision in the flowchart. This ensures that anyone reviewing the process has all the context they need in one “single source of truth.”
Seamless Integration with Your Tech Stack
Embed your decision-making flowchart directly into the tools your team already uses. Creately integrates seamlessly with Microsoft Teams, Slack, Google Drive, and Confluence, ensuring your logic is visible and actionable exactly where the work happens.
Conclusion: Streamline Your Decision Process with Decision-Making Flowcharts
In conclusion, a decision flowchart is a powerful tool that can simplify complex decision-making processes, improve communication, and ensure consistency. By visually mapping out the steps, options, and outcomes, it helps you make more informed choices, whether for personal decisions or in a business setting. However, it’s important to be mindful of its limitations, like the potential for oversimplification or difficulty handling uncertainty.
When used effectively, decision flowcharts can guide you through the decision-making process in an organized and transparent way. They not only help clarify your options but also ensure that the process is easy to follow for everyone involved. Keep these tips in mind, and you’ll be better equipped to use decision flowcharts to make smarter, more consistent decisions.
FAQs About Decision Flowcharts
How do decision flowcharts help with group decision-making?
What are some real-world examples of decision flowcharts?
Can a decision flowchart help avoid decision fatigue?
How does a decision flowchart compare to other decision-making tools?
References
Kwok, P.M.H. and Hodgson, P. (2017). Practicing Decision Making: Using Flowcharts with Twenty-First-Century Marketers. The International Journal of Pedagogy and Curriculum, 24(2), pp.1–14. doi:https://doi.org/10.18848/2327-7963/cgp/v24i02/1-14.
Nabeel Allawi (2020). What is the FlowChart. [online] ResearchGate. Available at: https://www.researchgate.net/publication/342572223_What_is_the_FlowChart.