What are cross functional flowcharts
Flowcharts are widely popular and one of the most frequently diagram types. They are great for mapping the flow of steps, decisions that need to be made etc in a process.
However flowcharts have just more than the process names, their flow and type of action embedded. Things like owners, stages, timelines need addition of more data to the flow and cross functional flowcharts are a solution to this problem.
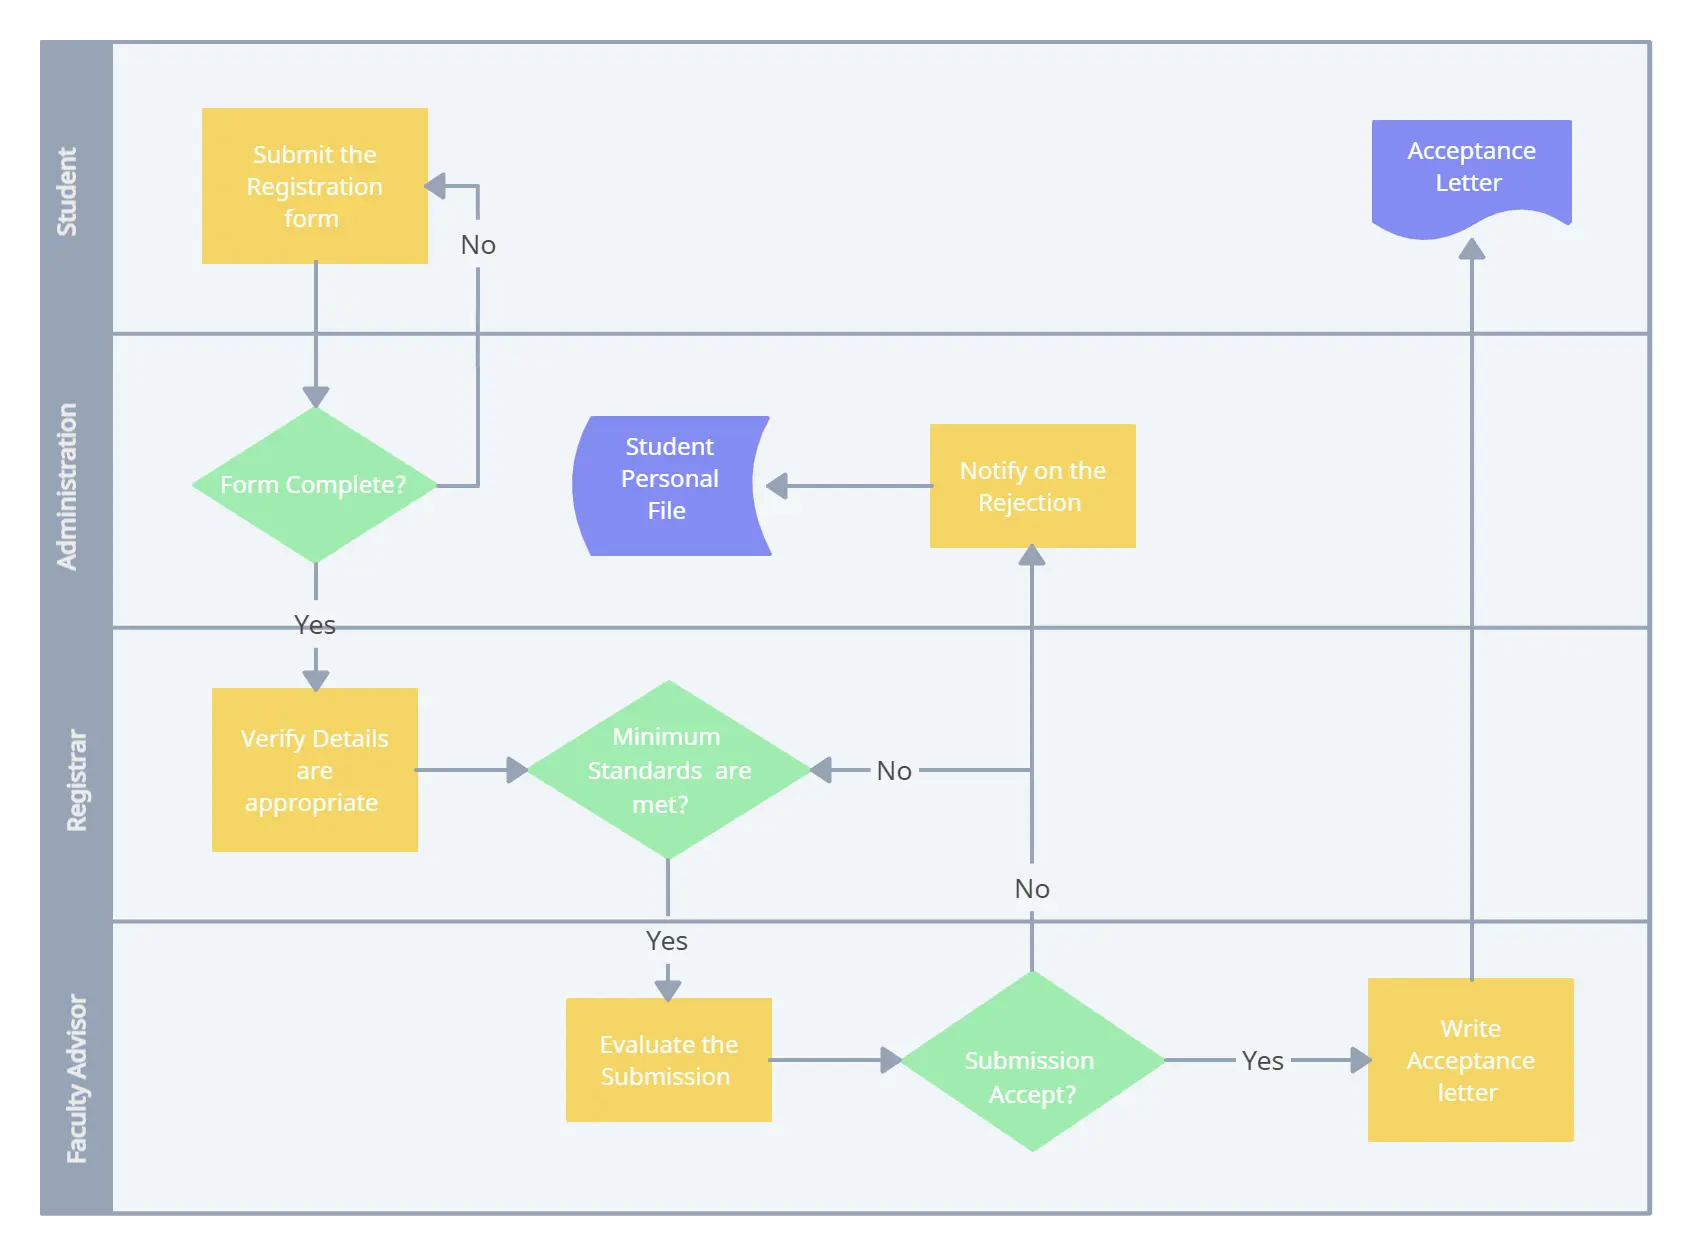
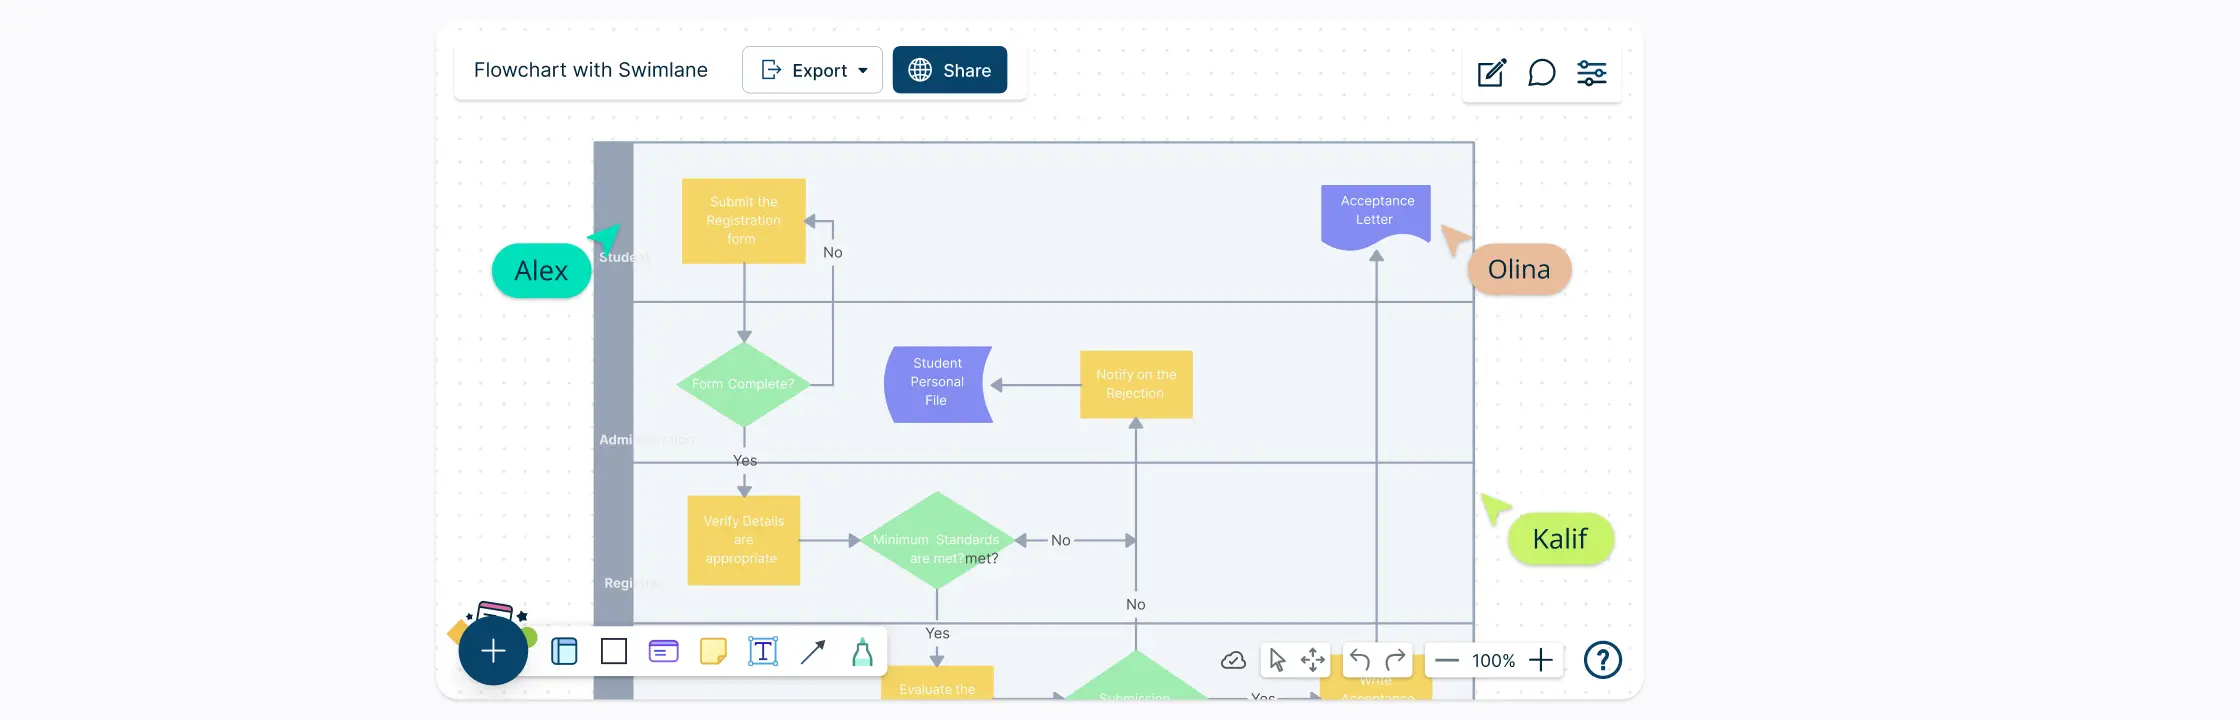
When you have a process that requires the involvement of multiple people, teams or departments it can get difficult to illustrate this in a normal flowchart. Cross-functional flowcharts sometimes referred to as swim lanes can simply illustrate the owners of each step in the flowchart by organizing them into columns or rows.
The simple layout makes it easy to understand additional attributes about each step without much hassle while being able to comprehend the flowchart at a glance. The same flowchart symbols that you use in a standard flowchart will be used to create the flow inside the swim lanes.
Multiple types of cross-functional flowcharts
While the name implies these flowcharts are meant to be used to demarcate process flows that go between multiple functional departments, they are far more widely applicable. Any other dimension of information can be added via the cross-functional layout.
1. Deployment flowcharts
Historically Deployment Flowcharts were used to group process flows sequentially. Typically used in things like documenting manufacturing processes such as assembly of vehicles. By grouping the processes it makes it easier to understand who and what is responsible for each step of the flow as well as how balanced the workflow is.
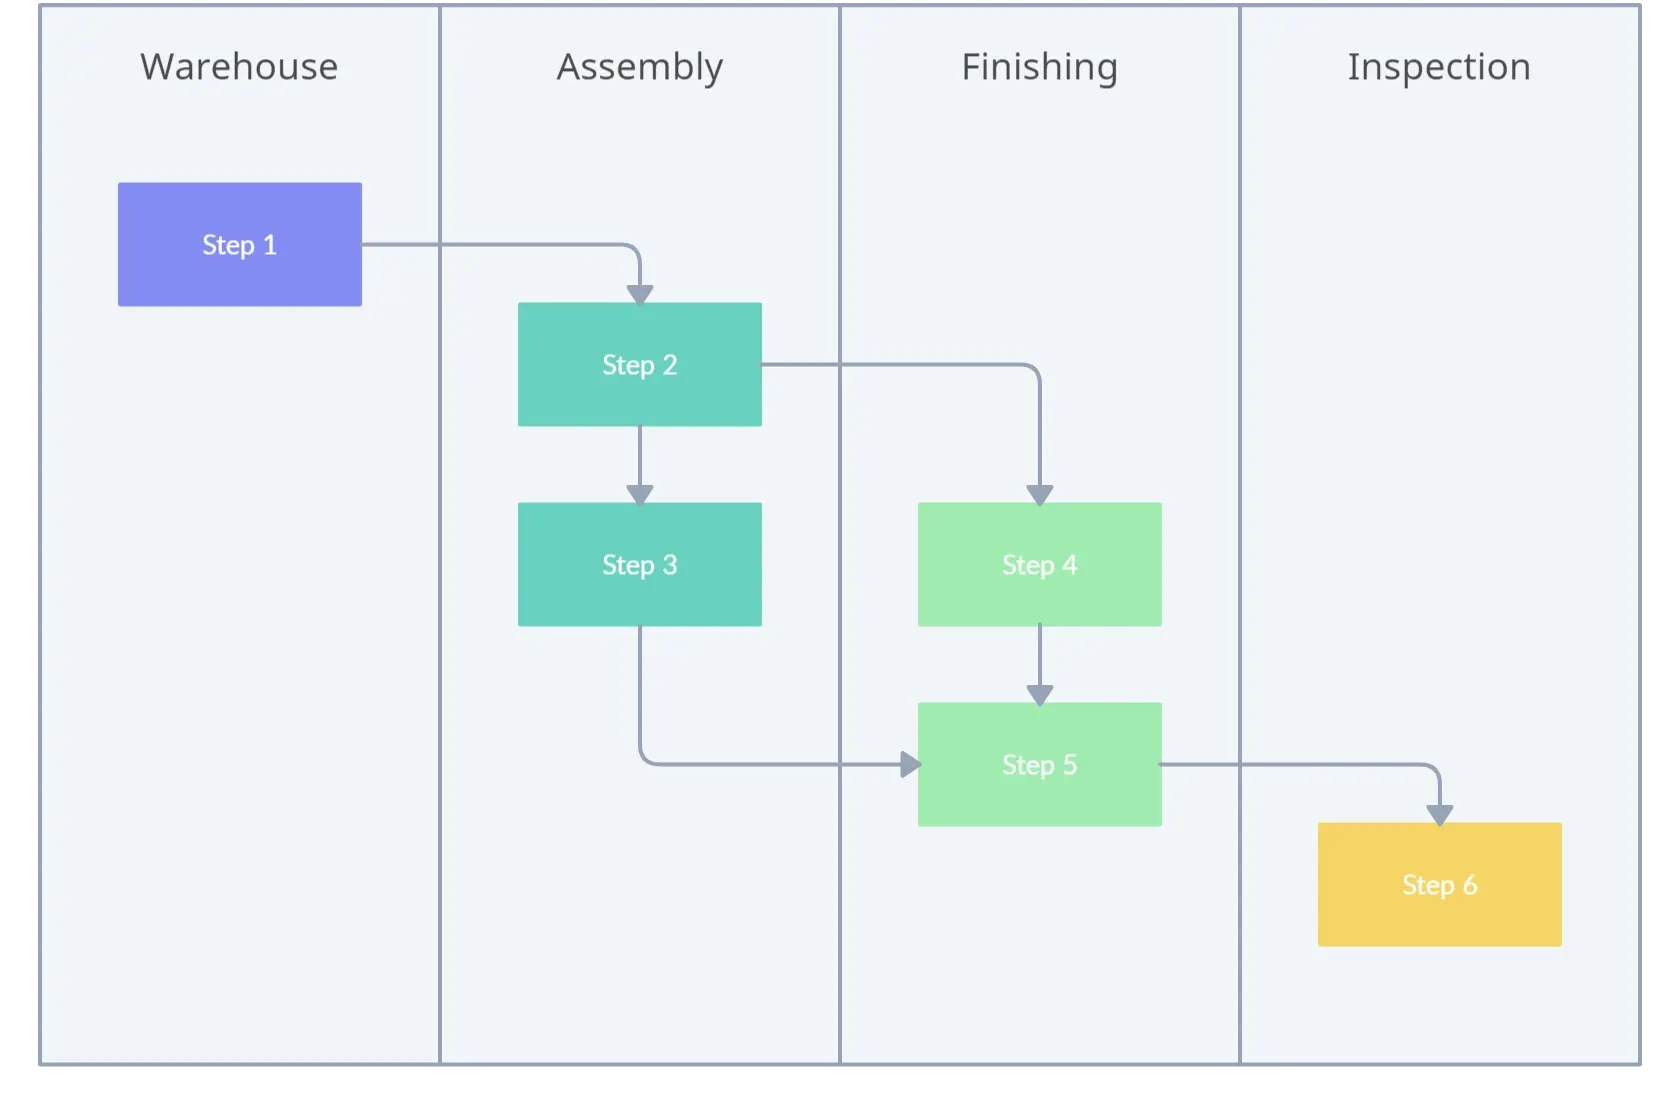
You can also use these charts to see how the stakeholders interact with each other as well as spot waste and unnecessary delays and repetitive tasks.
These can be scaled down to individuals that work on a process or different roles in a process.
2. Opportunity flowcharts
Another common type of flowchart is the opportunity flowchart that can be used to clearly see where value is being added in the process. While value-add is subjective, its important that you understand from which perspective you are analyzing the process.
You’d break down the processes into two simple columns and identify if the step is value adding or not. Once you have this, you may be able to cut out non-value adding processes and further optimize your flow of work in your process.
Tools to draw Cross Functional Flowcharts
There are a few products that you can draw flowcharts with yet not every product supports easy drawing of Cross Functional Flowcharts or swim lanes.
You could of course use Microsoft Word drawings to get a very basic flowchart out but that quickly gets tiresome with manual controls of everything from the boxes to connecting lines.
Having pre-made templates and shapes would greatly ease creation of cross functional flowcharts. Our online flowchart software is an easy choice in looking for such products as it comes with pre-made cross-functional flowchart templates as well as a comprehensive set of cross-functional flowchart shapes. Furthermore, it has made it faster to draw flowcharts with the 1-click creation of shapes and connectors cutting down the drawing time ⅓ of what it usually is.
Other products to help you draw these flowcharts can be Microsoft Visio. MS Visio also has series of shapes for flowcharts and has advanced support for connecting shapes as well as swim lanes. However, it is not as easy to use and adapt.
Cross functional flowcharts are highly useful when you are dealing with a large process or want to easily analyze the process for potential changes and optimizations.