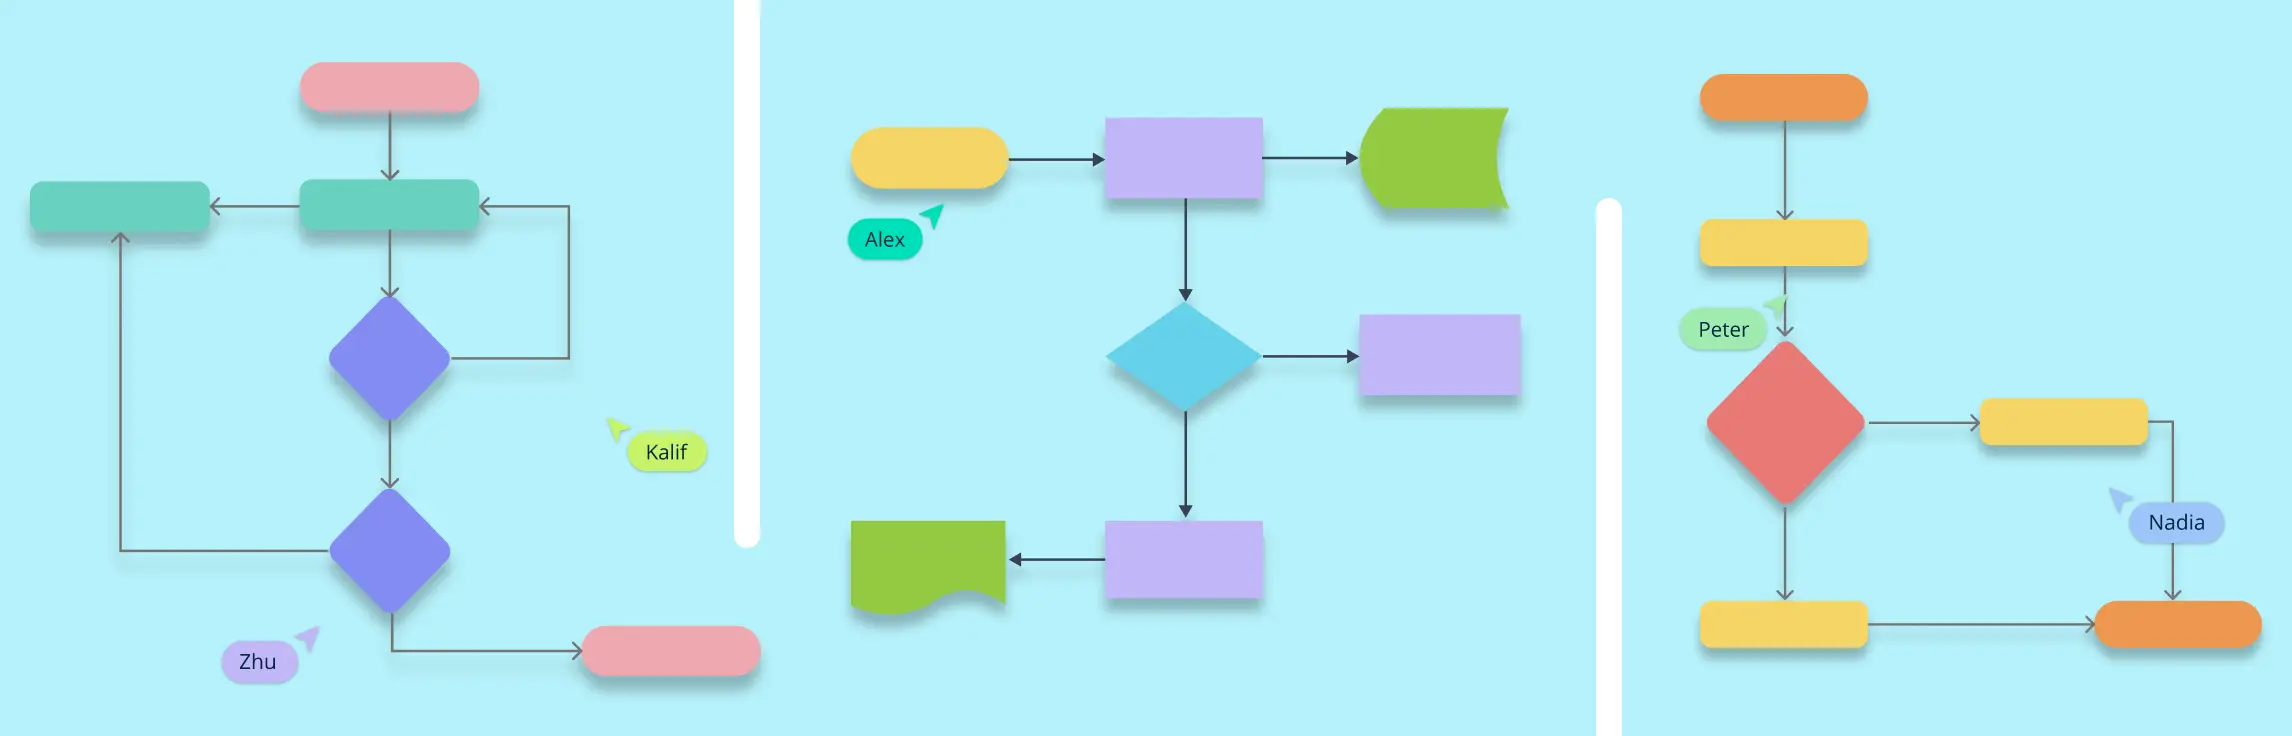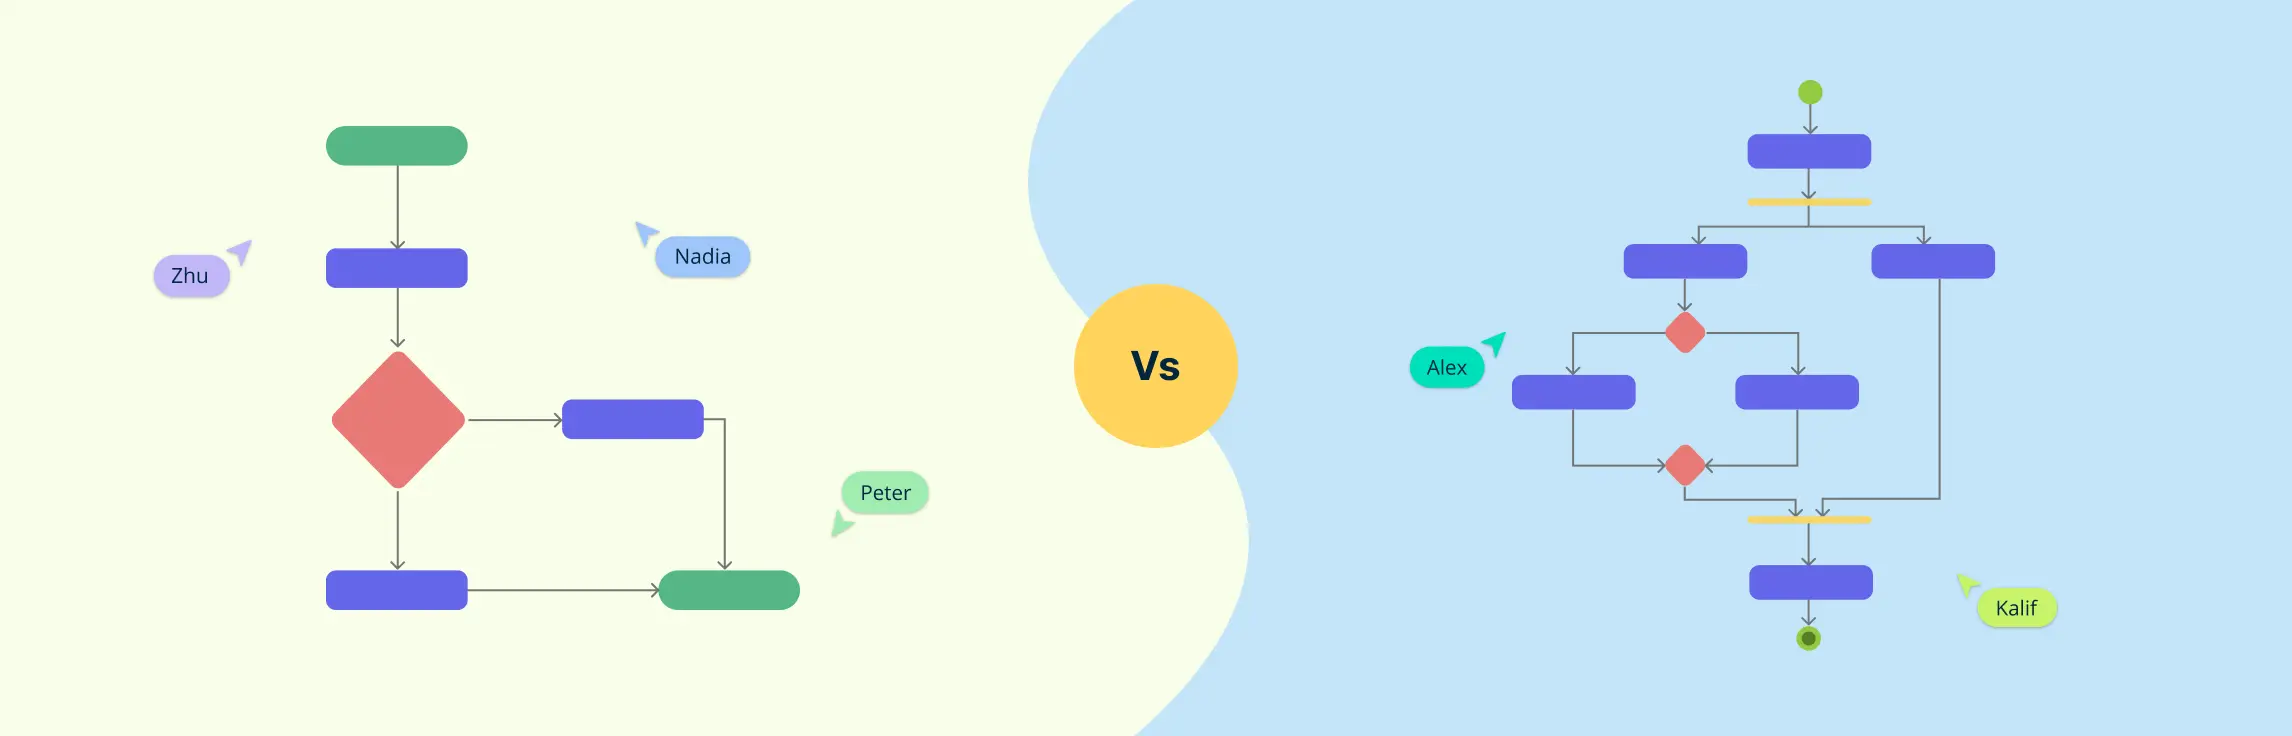
Flowcharts are powerful tools that help visualize processes, systems, and workflows. Whether you’re mapping out a business operation, designing a computer program, or organizing daily tasks, flowcharts make complex ideas easier to understand.
In this guide, we’ll explore different types of flowcharts, their uses, and how they help simplify decision-making and communication. You’ll also find ready-to-use templates to get started quickly. By the end, you’ll know which types of flowcharts best fit your needs and how to create one effectively.
The Key Types of Flowcharts and When to Use Them
Flowcharts come in different types, each designed for a specific purpose. Some help map out step-by-step processes, while others focus on decisions, data flow, or teamwork. Choosing the right types of flowcharts makes it easier to understand and improve a system.
In this section, we’ll break down the key types of flowcharts, explain what they’re best for, and give examples of when to use them.
1. Process Flowchart
Best for: Process flowcharts are great for breaking down complex workflows into simple steps.
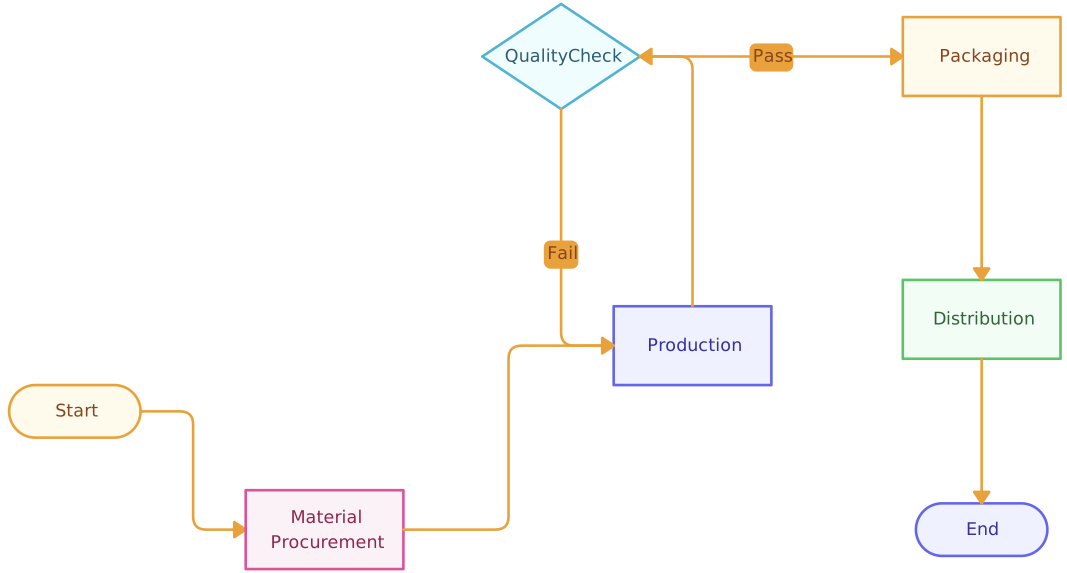

A process flowchart is a visual representation of a series of steps in a process. It shows how tasks, decisions, and actions flow from one stage to the next, using symbols like arrows, rectangles, and diamonds. By mapping out each step, a process flowchart makes it easier to understand how a system works, identify bottlenecks, and improve efficiency. It is widely used across industries to document, analyze, and optimize workflows.
When to use them
- Business operations – To map out how orders are processed, from purchase to delivery.
- Manufacturing – To show how raw materials turn into finished products.
- Customer service – To outline how customer inquiries are handled from start to resolution.
- Healthcare – To track patient care from check-in to treatment.
2. Swimlane Flowchart
Best for: Swimlane flowcharts are great for visualizing processes that involve multiple teams or roles.
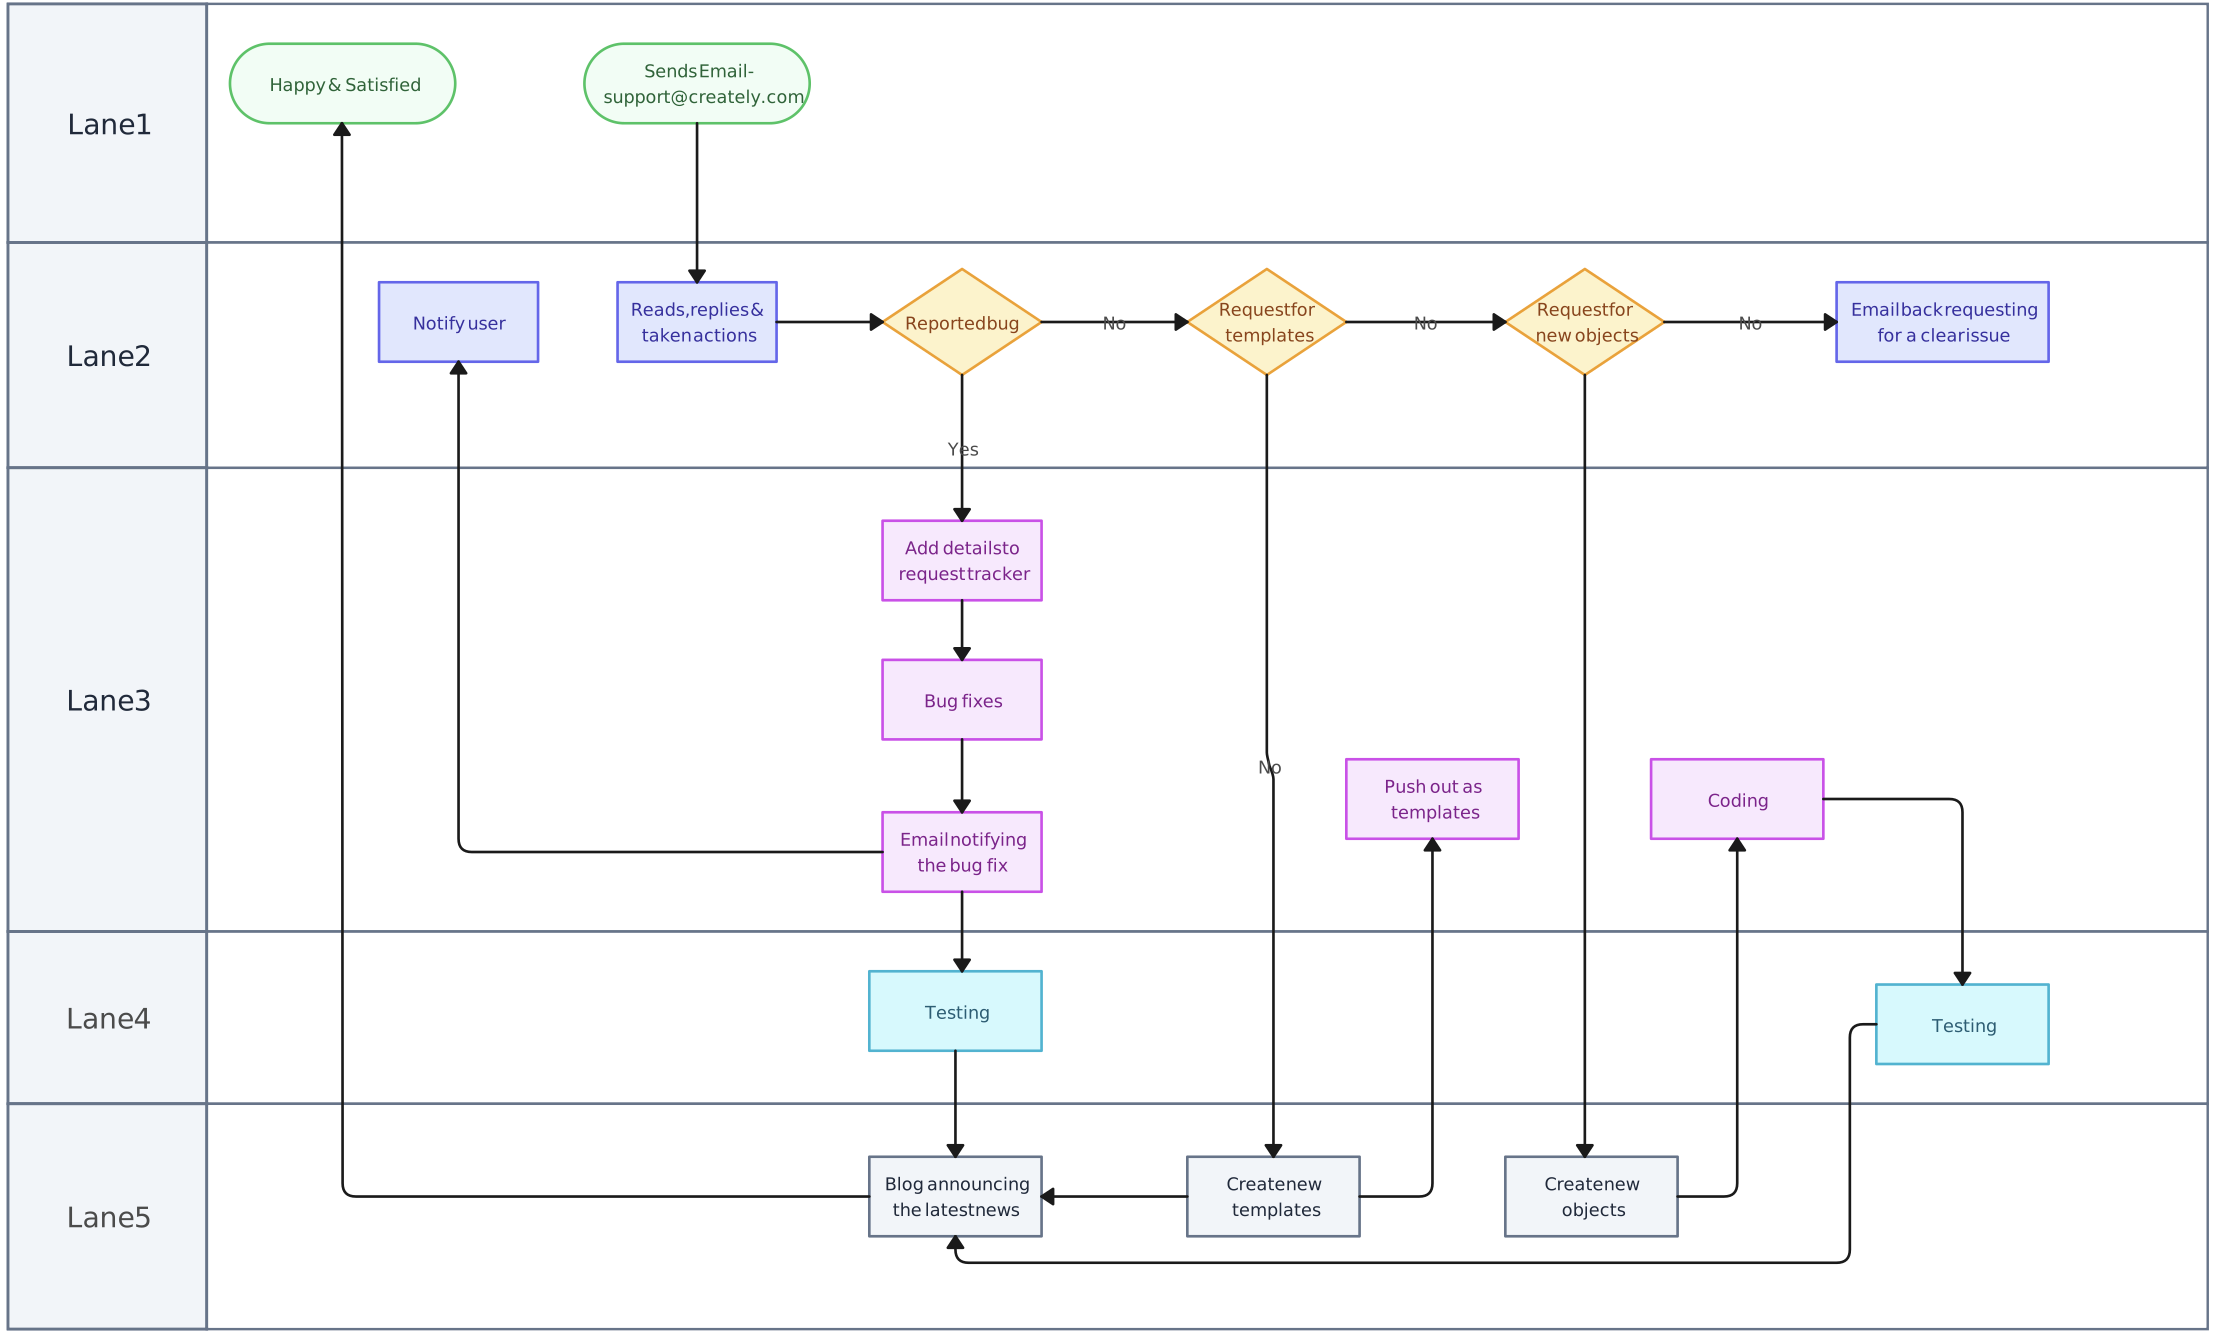
A swimlane diagram is a type of flowchart that organizes process steps into separate lanes based on roles, departments, or teams. Each “swimlane” represents a specific group responsible for certain tasks, making it clear who does what in a process. This structured layout helps improve coordination and accountability, especially in complex workflows involving multiple people or departments.
When to use them
- Business processes – To map out approval workflows, such as processing invoices or employee onboarding.
- Project management – Create a swimlane diagram to track tasks assigned to different team members in a project.
- Healthcare – To show how doctors, nurses, and administrative staff handle patient care.
- Customer service – To outline how support requests move between teams like sales, technical support, and billing.
3. Workflow Diagram
Best for: Workflow diagrams are best for mapping out structured processes, automating repetitive tasks, and improving team collaboration.
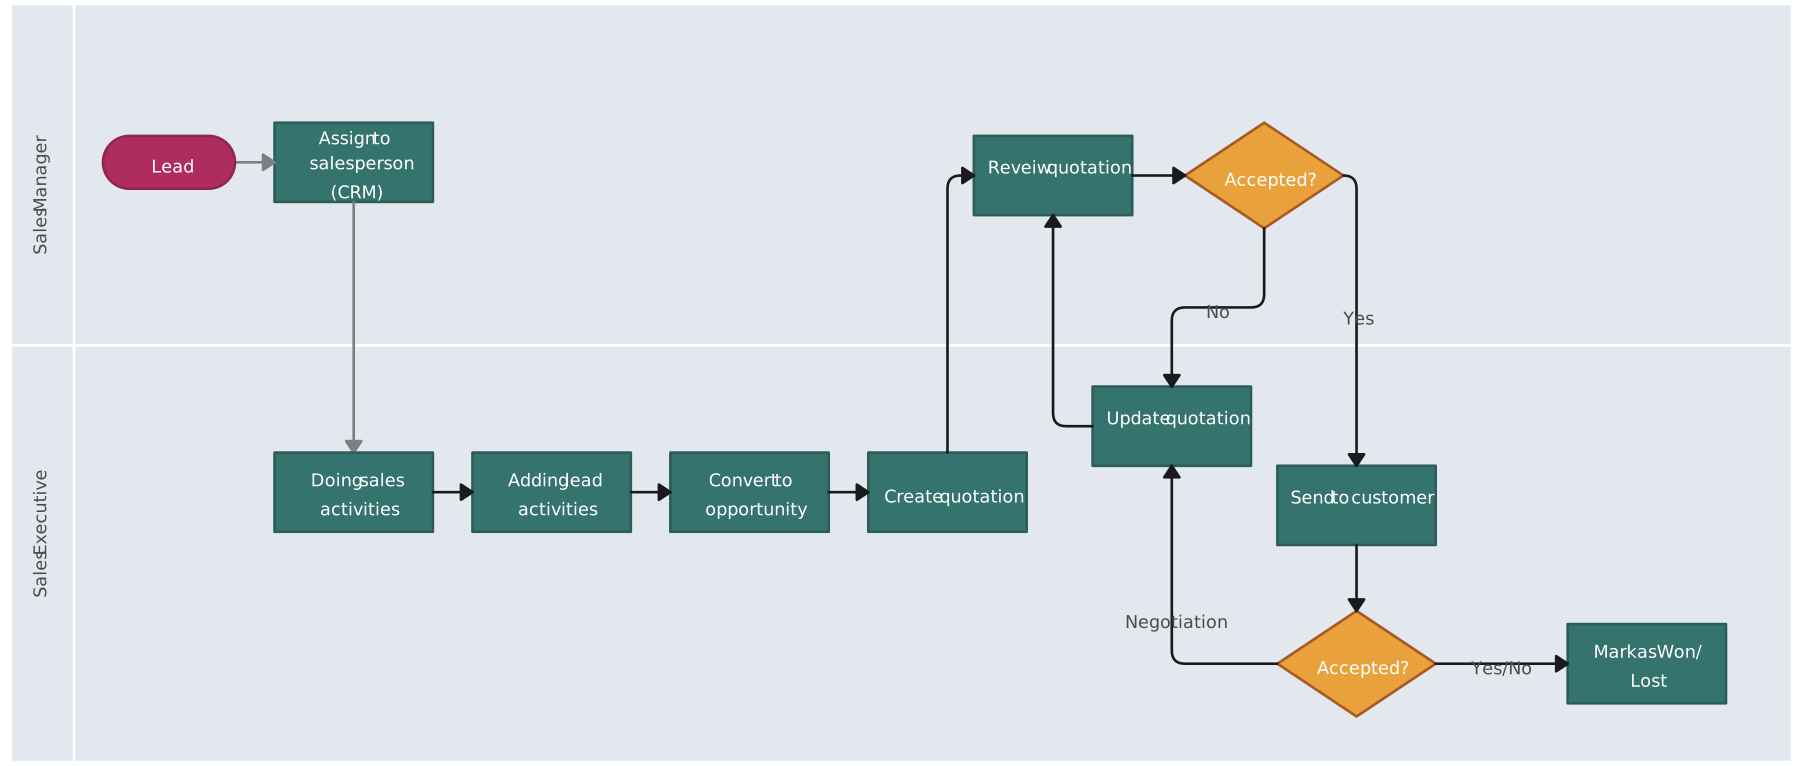
A workflow diagram is a visual representation of a process that shows the sequence of tasks, decisions, and interactions needed to complete a workflow. It helps illustrate how work moves through different steps, who is responsible for each task, and how information flows between people, teams, or systems. By clearly outlining a process, workflow diagrams help improve efficiency and reduce errors.
When to use them
- Business operations – To document internal workflows like expense approvals or hiring processes.
- Software development – To visualize how user requests move through different stages of a system.
- Manufacturing – To show how raw materials move through production steps.
- Healthcare – To track patient workflows, from scheduling to treatment and follow-ups.
4. Data Flow Diagram
Best for: Data flow diagrams are best for understanding how data is used within a system.
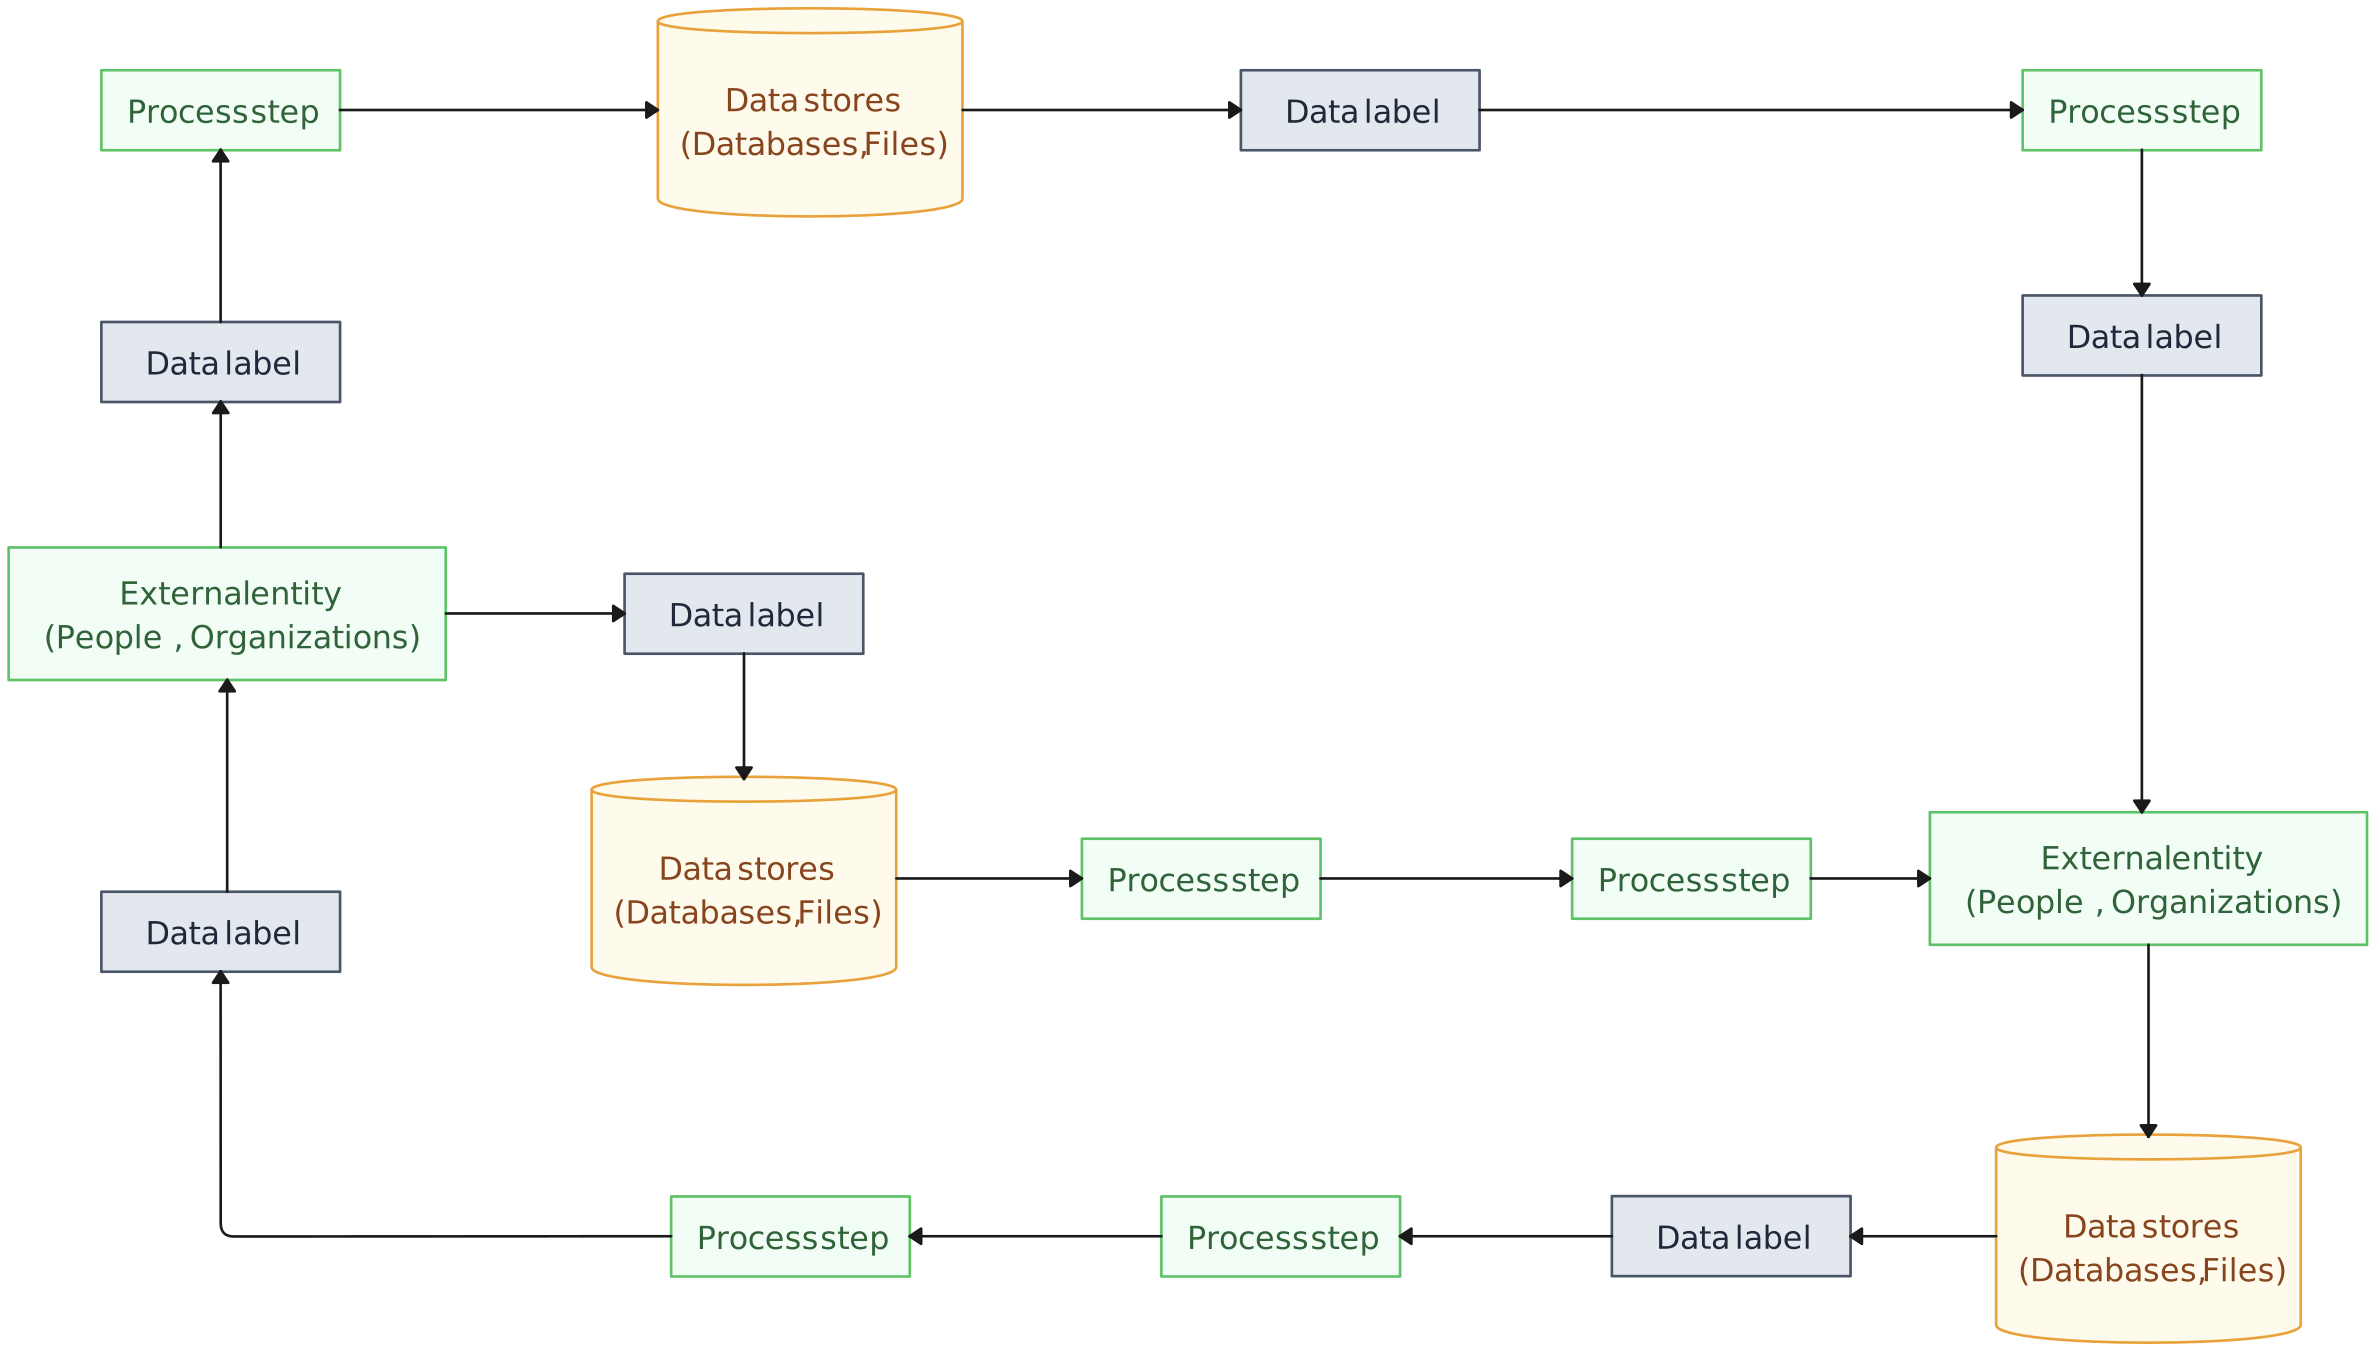
A data flow diagram (DFD) is a visual representation of how data moves through a system. It shows where data comes from, how it is processed, stored, and transferred between different parts of a system. Unlike process flowcharts, which focus on tasks and decisions, data flow diagrams focus on the movement of information. They help businesses, software developers, and IT teams analyze processes, improve data management, and ensure efficient system design. DFDs are especially useful for designing databases, tracking user inputs, and streamlining data processing.
When to use them
- Software development – Create a data flow diagram to plan how user data moves through an application or website.
- Business processes – To analyze how customer information flows through sales, billing, and support systems.
- System design – To visualize how databases, servers, and applications exchange data.
- Healthcare – To track how patient records are created, stored, and shared between departments.
5. EPC Diagram
Best for: EPC diagrams are best for analyzing and optimizing business processes. They help businesses identify inefficiencies, standardize workflows, and improve decision-making.
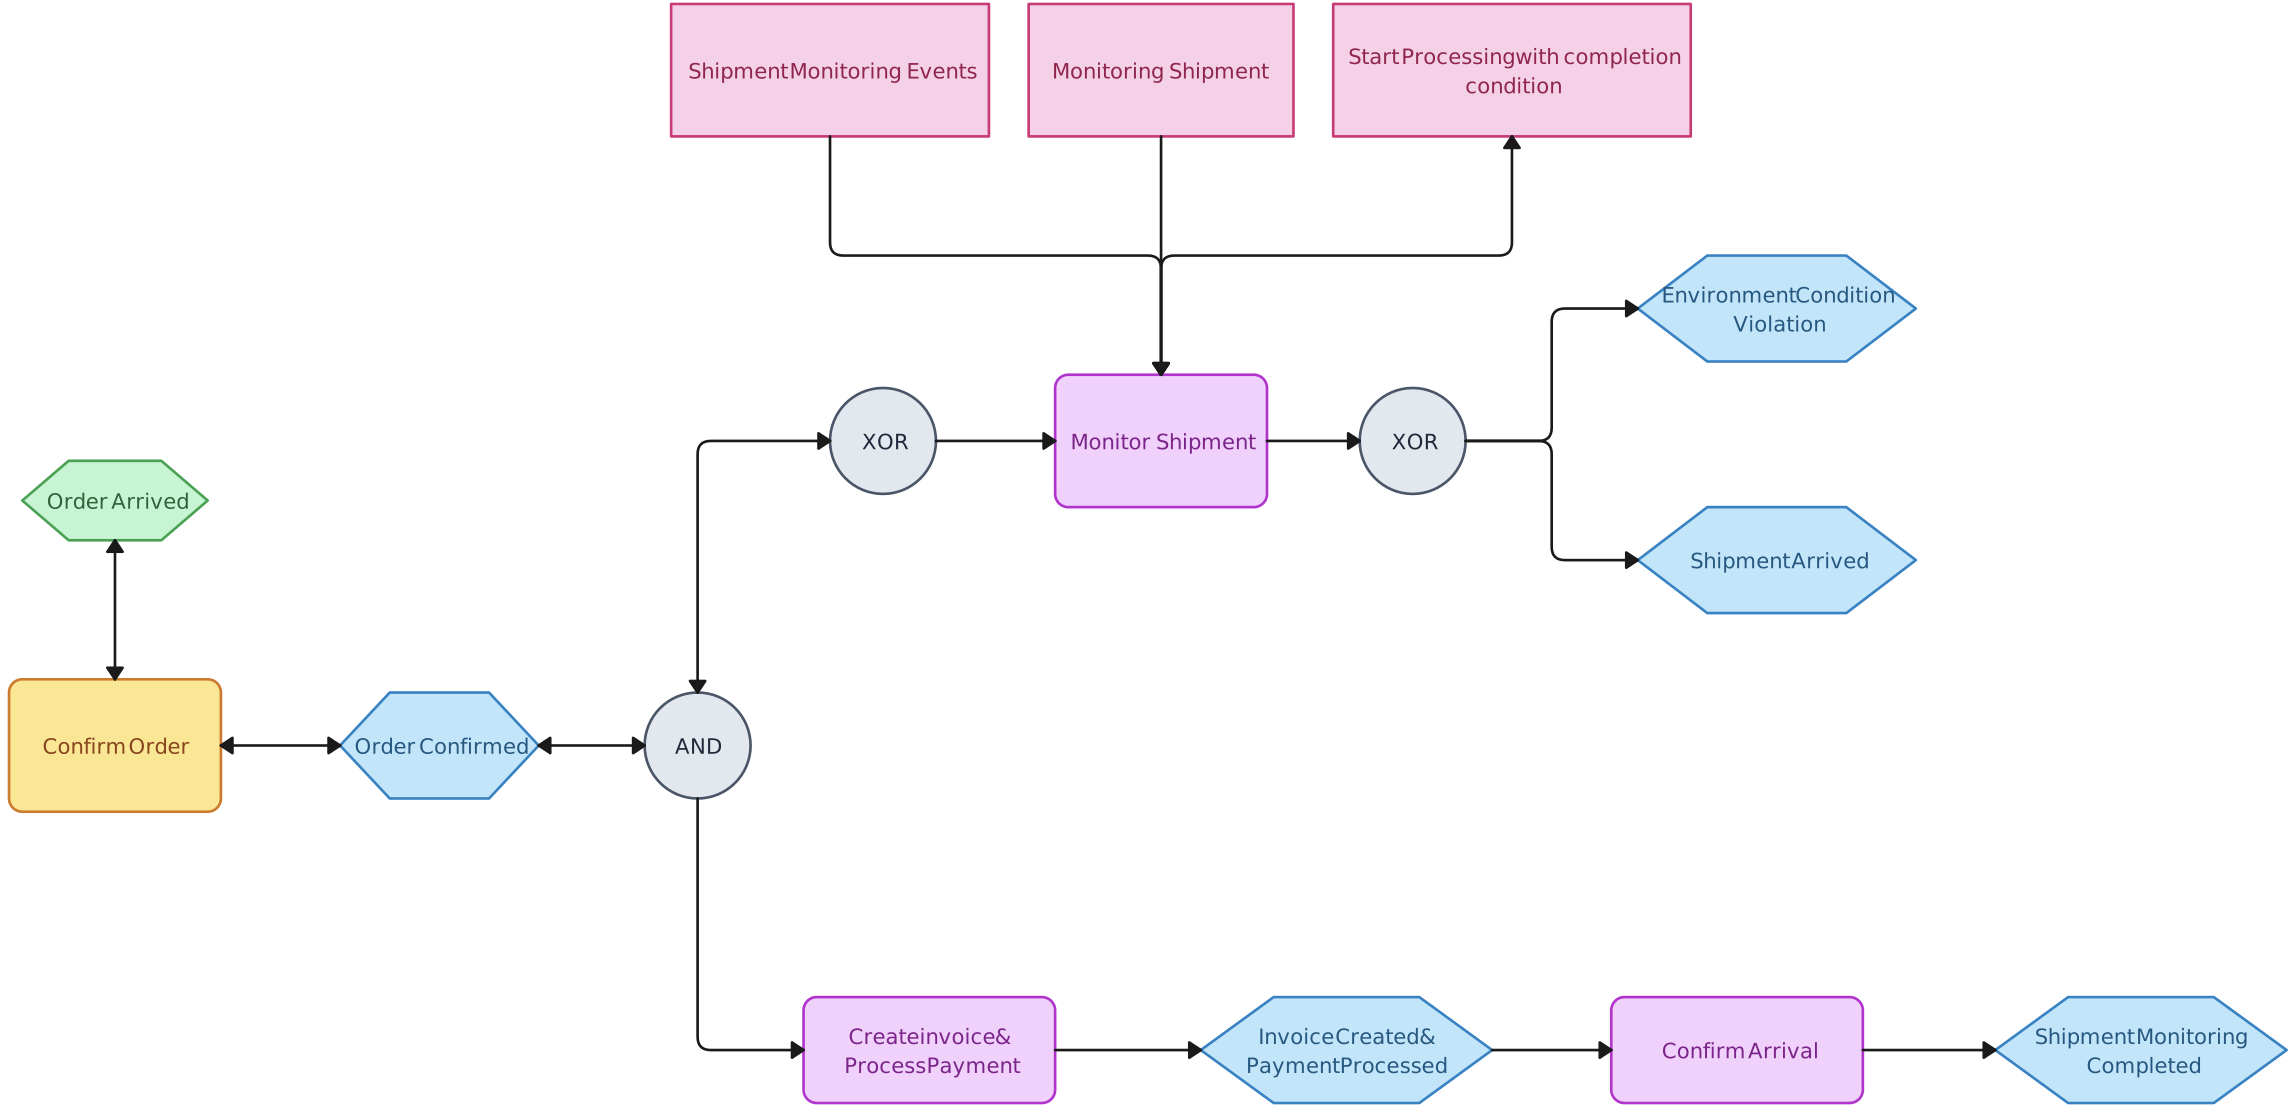
An event-driven process chain (EPC) diagram is a type of flowchart used to model business processes. It visually represents the sequence of events, tasks, and decision points in a process, helping organizations understand how work flows from start to finish. EPC diagrams use standardized symbols to show the relationships between different steps, making them especially useful for process improvement and automation. These diagrams are commonly used in enterprise resource planning (ERP) and business process management (BPM) to document and streamline operations.
When to use them
- Business process modeling – To map out workflows like order processing or supply chain management.
- Enterprise resource planning (ERP) – To document how different departments interact within an ERP system.
- Compliance and auditing – To ensure processes meet regulatory requirements by providing a clear workflow overview.
- Process automation – To identify areas where manual tasks can be automated for greater efficiency.
6. SDL Diagram
Best for: SDL diagrams are best for designing, analyzing, and documenting systems that require precise communication between components.
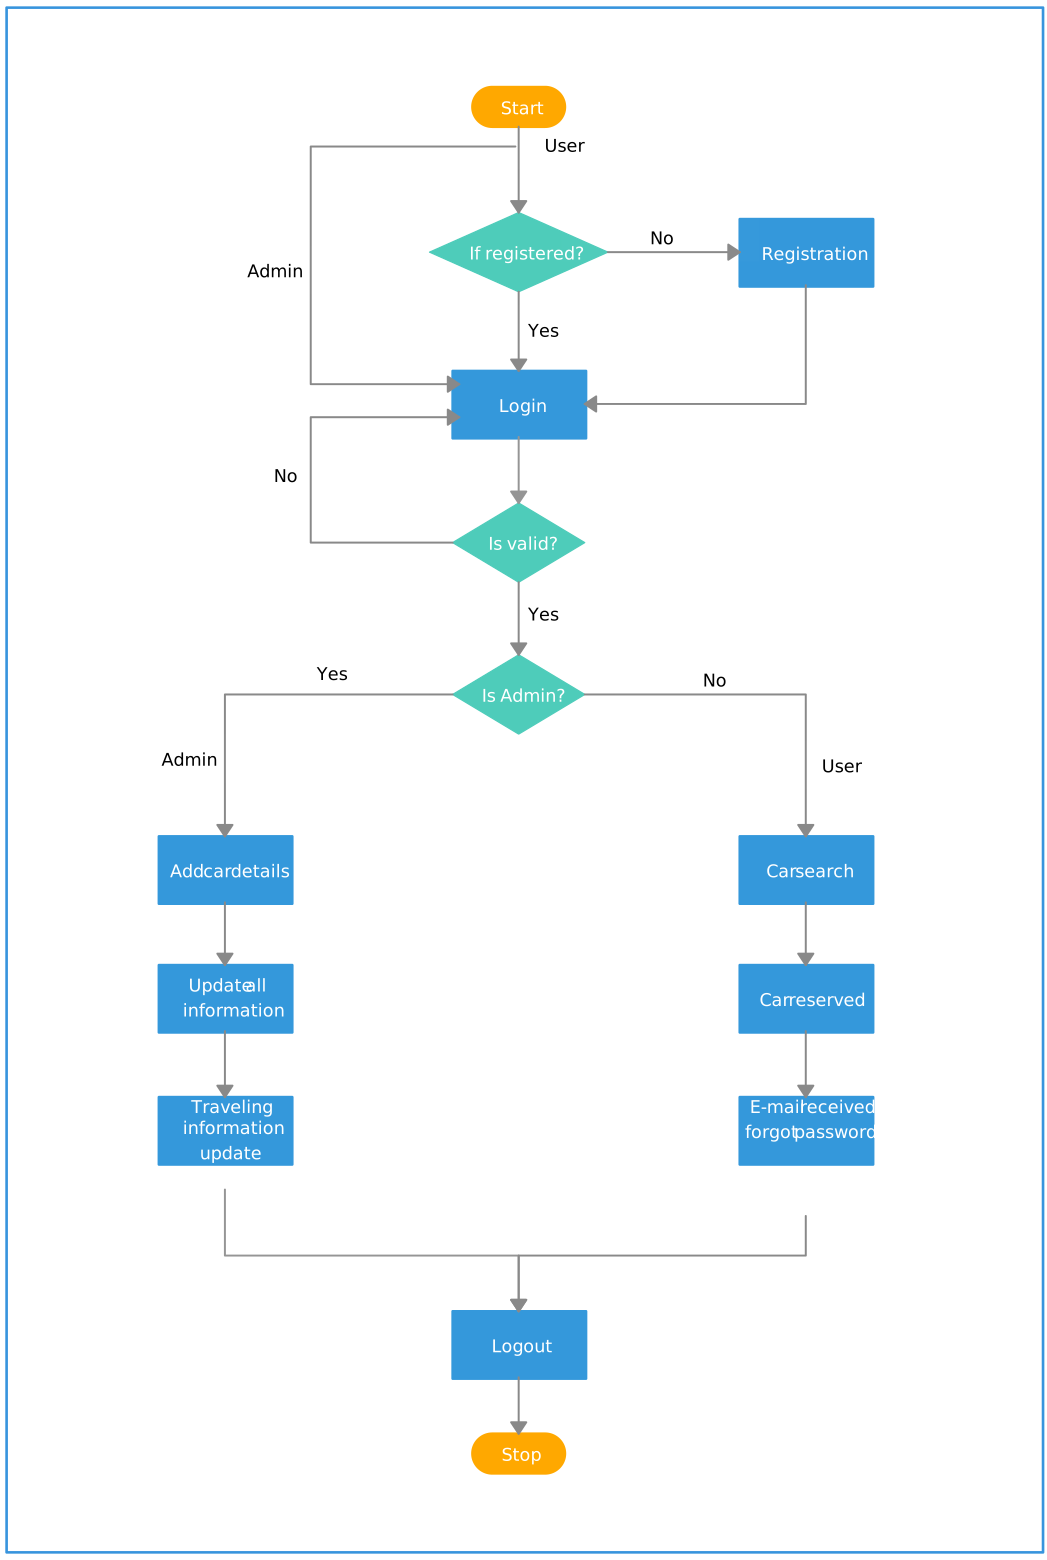
A Specification and Description Language (SDL) diagram is a graphical tool used to model complex real-time systems, particularly in telecommunications, software development, and embedded systems. It helps visualize how different components of a system interact, including processes, data flows, and communication between elements. They help developers and engineers ensure that a system functions correctly, identify potential issues, and improve overall system performance. SDL diagrams use symbols to represent states, transitions, and interactions, making them useful for system design and troubleshooting.
When to use them
- Telecommunications – To model how signals and messages are transmitted in communication networks.
- Software development – To design and test real-time applications, such as messaging systems and network protocols.
- Embedded systems – To visualize how software interacts with hardware in devices like smart appliances or automotive control systems.
- System troubleshooting – To analyze and debug complex system interactions by mapping out data flow and state transitions.
7. Process Map
Best for: Process maps are best for complex process documentation and analyzing the detailed flow of work.
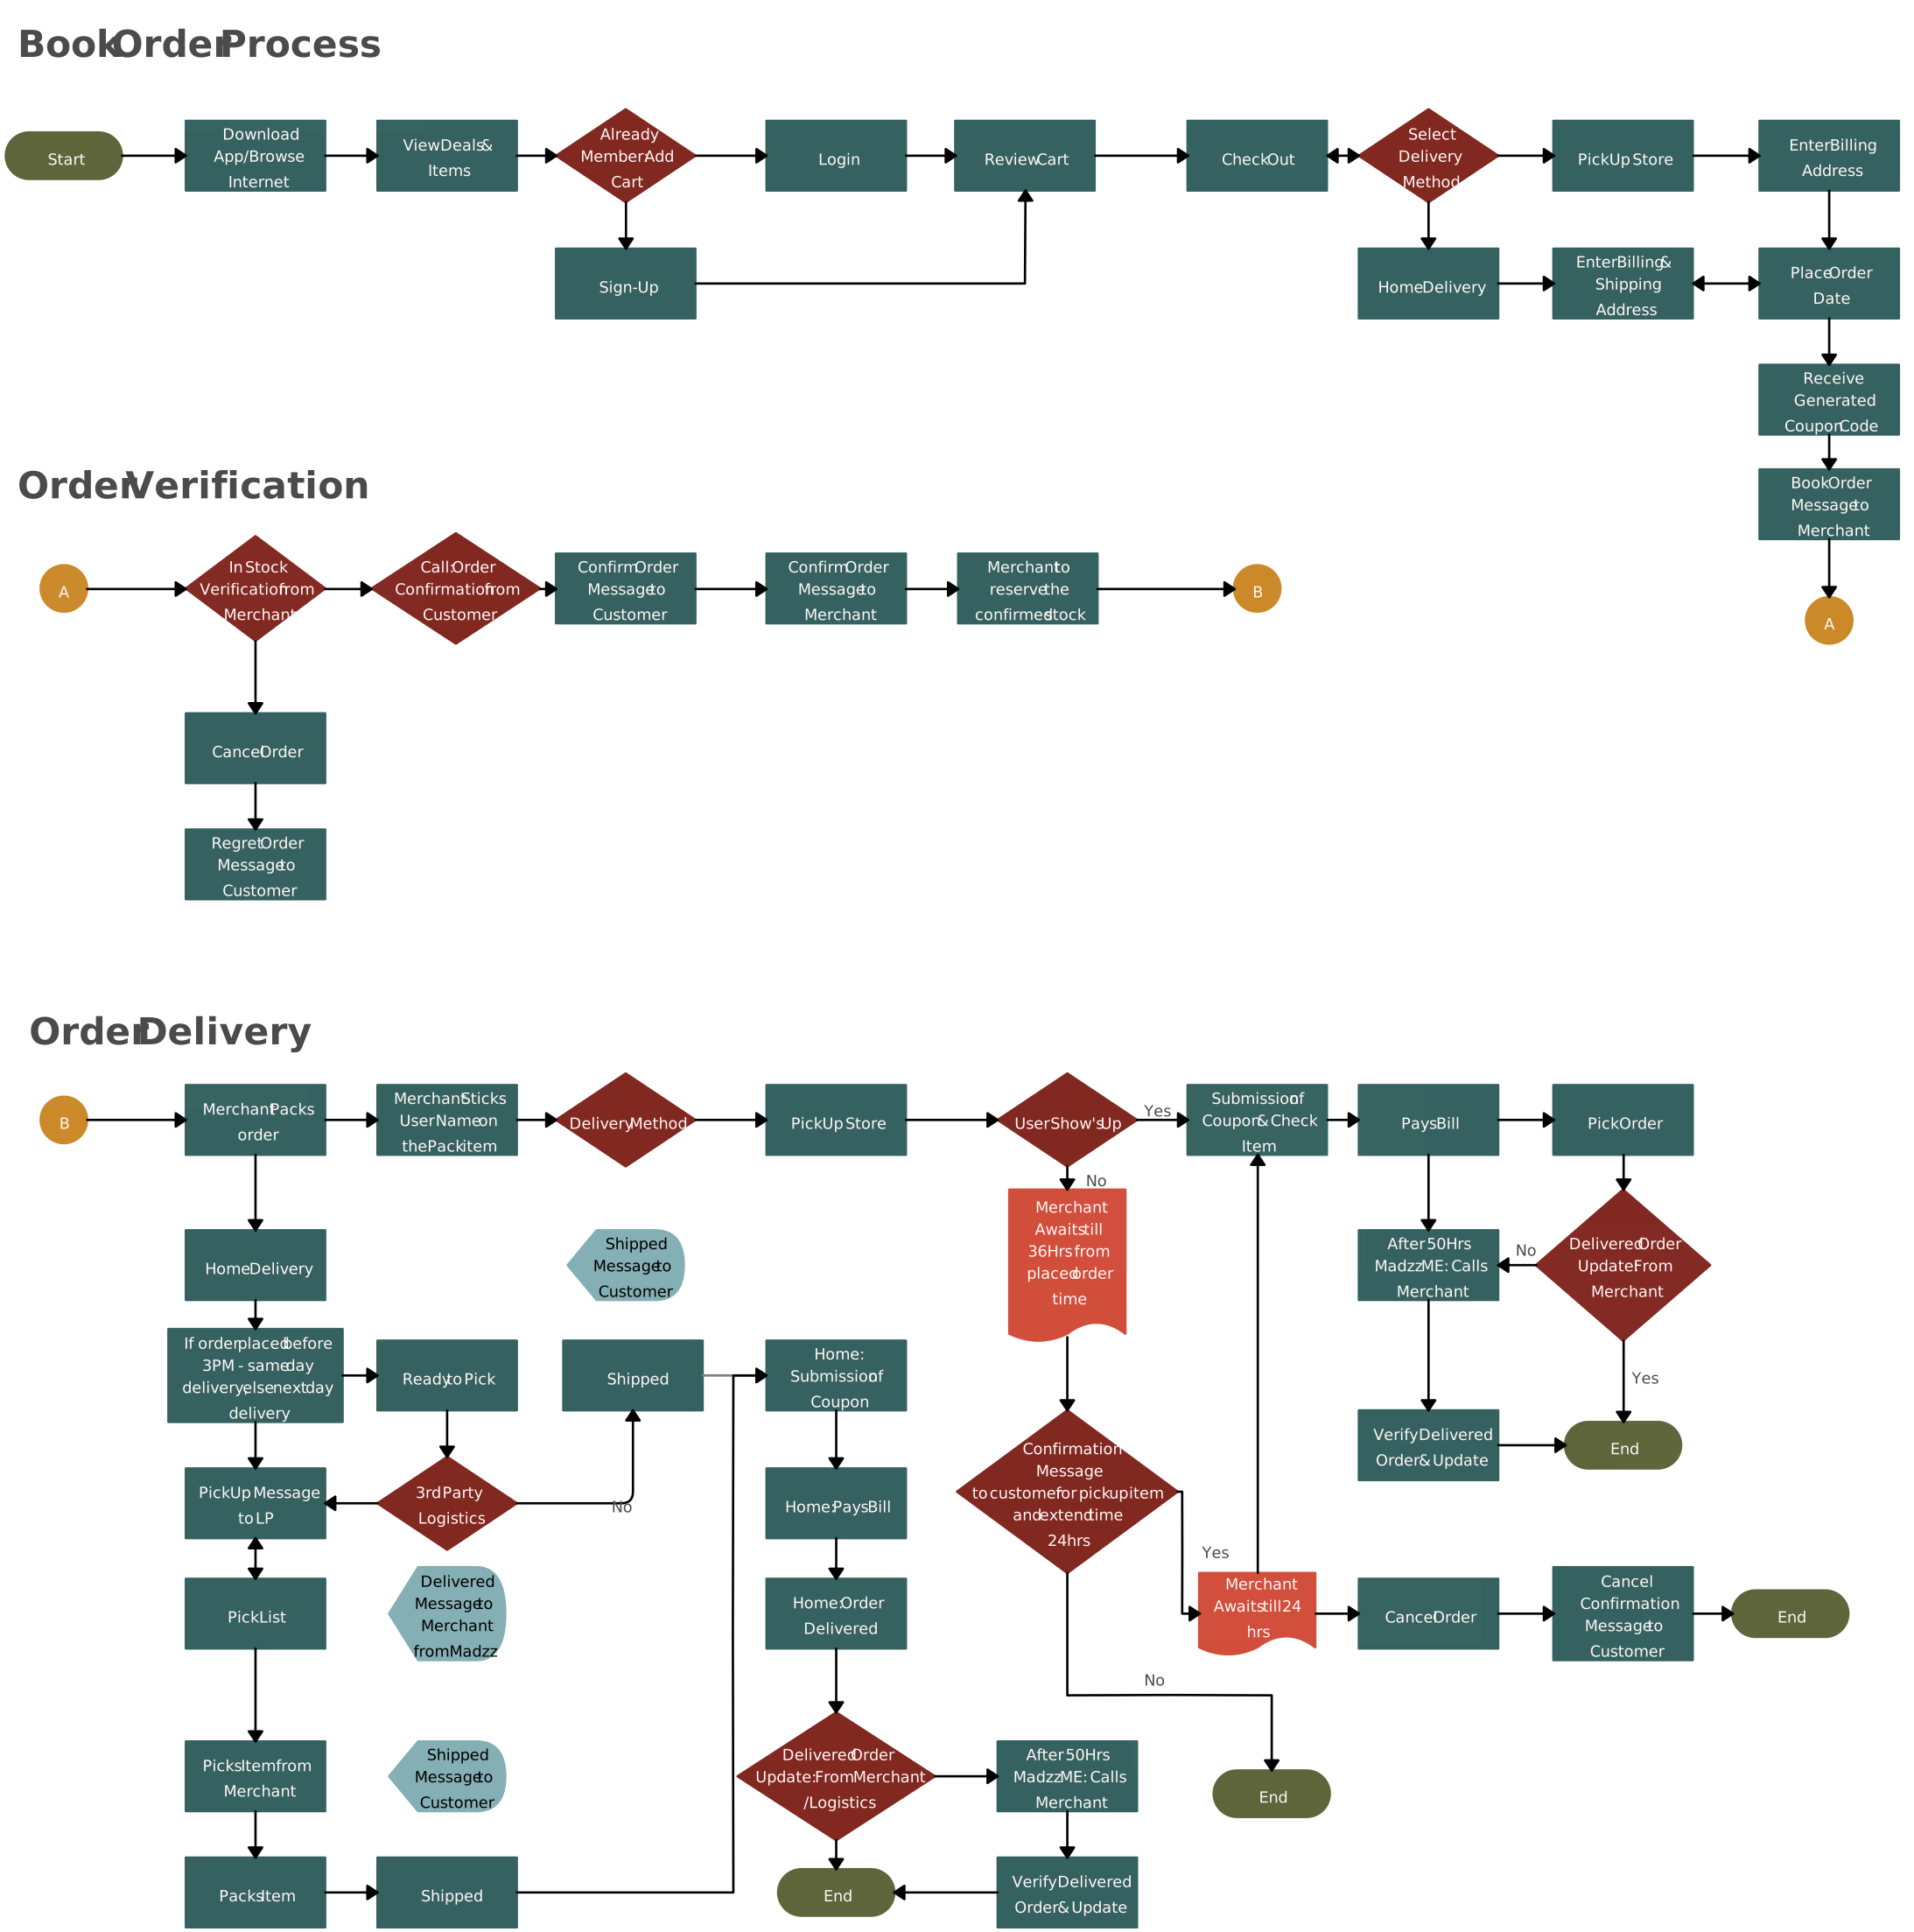
A process map is a detailed visual representation of a process, showing the individual steps, decisions, inputs, and outputs involved in completing a task or achieving a goal. It is often more granular than a flowchart, providing in-depth information on how a process operates. Process mapping helps identify inefficiencies, clarify responsibilities, and improve communication within teams. Process maps are often used for process reengineering, quality control, and continuous improvement efforts.
When to use them
- Business operations – To map out the steps in a process like order fulfillment, employee onboarding, or procurement.
- Manufacturing – To visualize production processes, such as assembling products or managing inventory.
- Healthcare – To map out clinical workflows, including patient intake, diagnosis, and treatment.
- Quality control – To ensure that every step of a process meets quality standards by documenting and analyzing each stage.
8. Process Flow Diagram
Best for: A PFD is best for visualizing and documenting high-level process flows, identifying key equipment and systems, and understanding the overall operation of an industrial process.
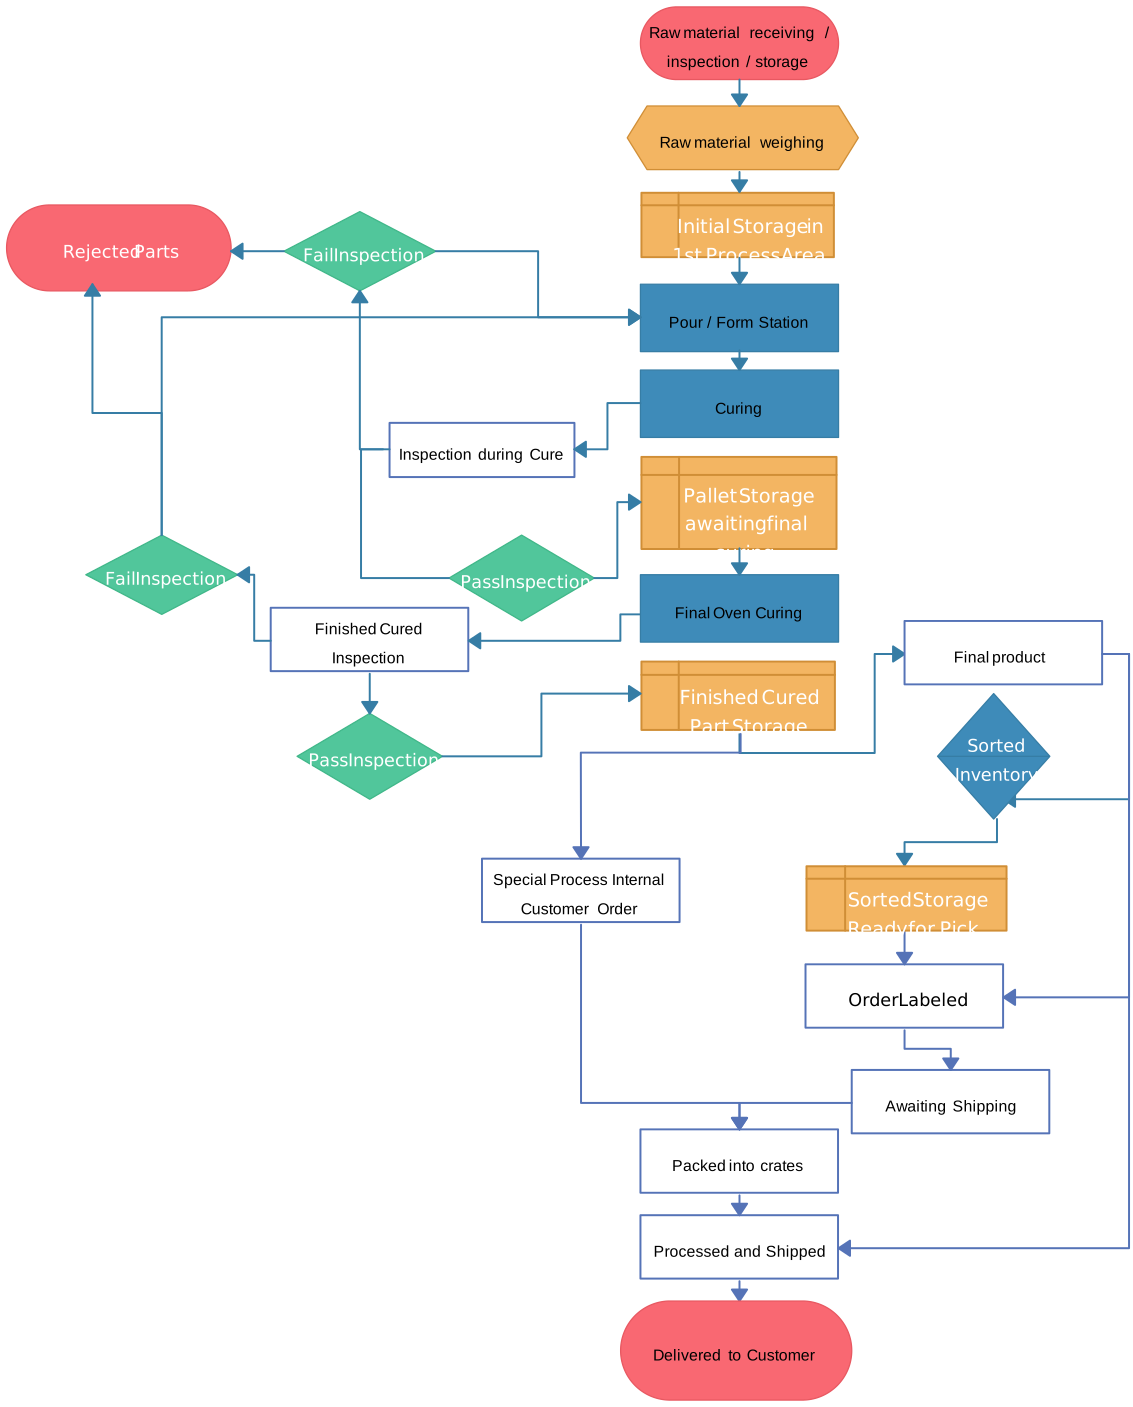
A Process Flow Diagram (PFD) is a type of flowchart used to visually represent the relationships between key components in an industrial process, particularly in fields like chemical and process engineering. It uses symbols and notations to depict a system’s flow of materials and energy, offering a clear, simplified overview of complex processes.
When to use them
- Manufacturing – To visualize the steps involved in producing goods and managing material flows in a plant.
- Chemical engineering – To show how raw materials are converted into products, including major equipment like reactors and separators.
- Oil and gas – To depict the flow of crude oil or natural gas through processing plants, pipelines, and refineries.
- Energy production – To illustrate the flow of energy within power plants, from generation to distribution.
9. Decision Flowchart
Best for: Decision flowcharts are best for outlining processes that involve multiple decision points.
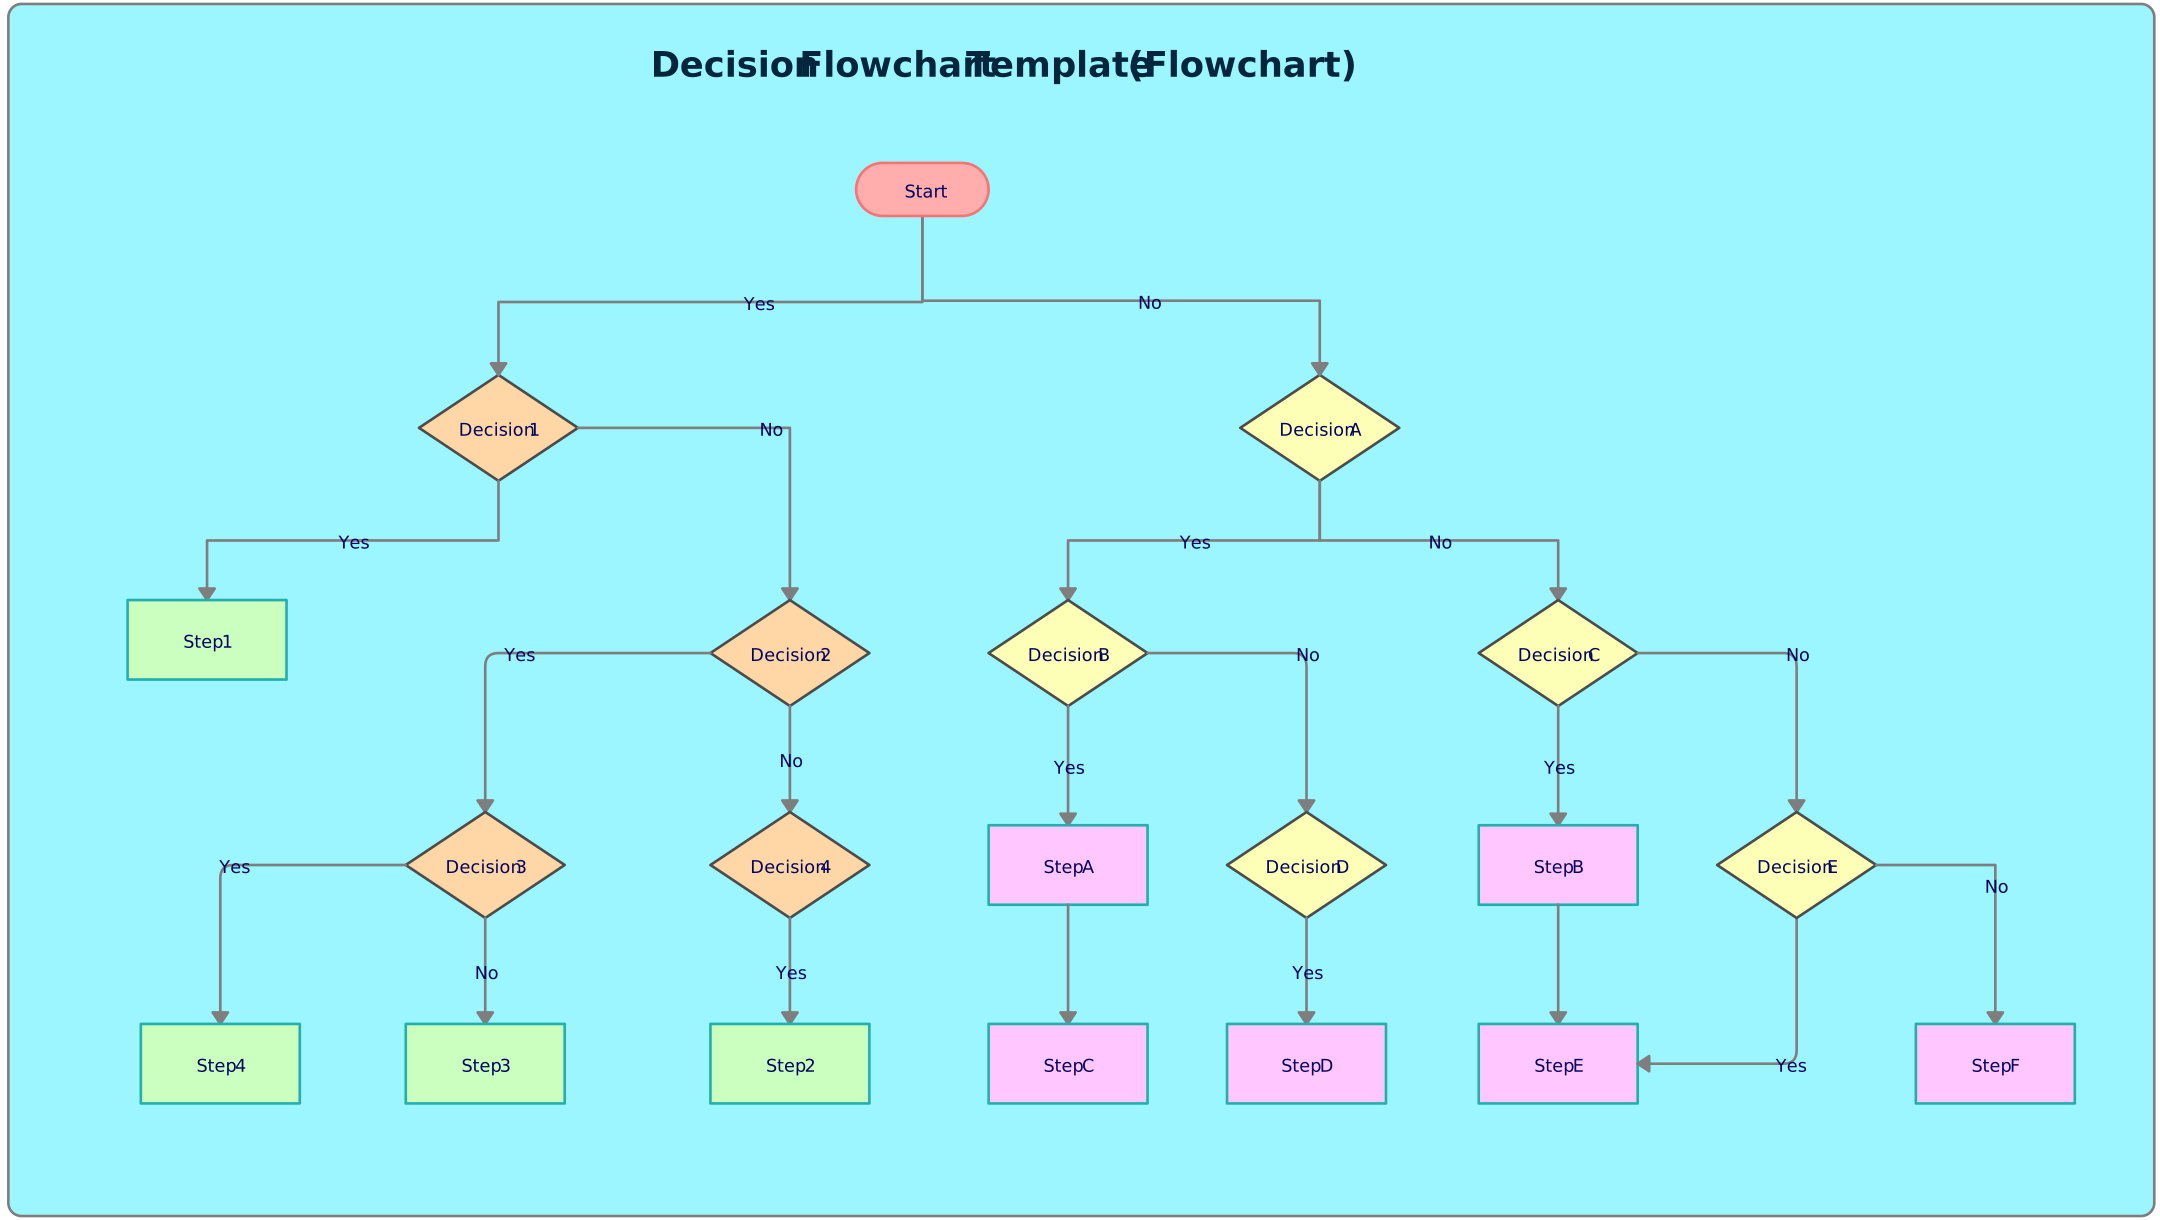
A decision flowchart is a type of flowchart that focuses on decision points within a process. It uses decision nodes, typically represented by diamond shapes, to show where choices must be made. These charts visually map out the possible outcomes or actions that can follow each decision, helping guide users through complex decision-making processes. Decision flowcharts are commonly used in areas like problem-solving, troubleshooting, and process optimization.
When to use them
- Business processes – To guide decision-making in processes like hiring, approvals, or risk assessments.
- Customer service – To help representatives decide the next steps based on customer queries or issues.
- Software development – To model logic for features that involve user inputs or system responses, such as in troubleshooting tools.
- Healthcare – To assist doctors or healthcare professionals in diagnosing conditions or choosing treatment paths based on patient symptoms.
10. Use Case Flowchart
Best for: Use case flowcharts are best for visualizing how users engage with a system and identifying the key actions, decisions, and outcomes in a process.
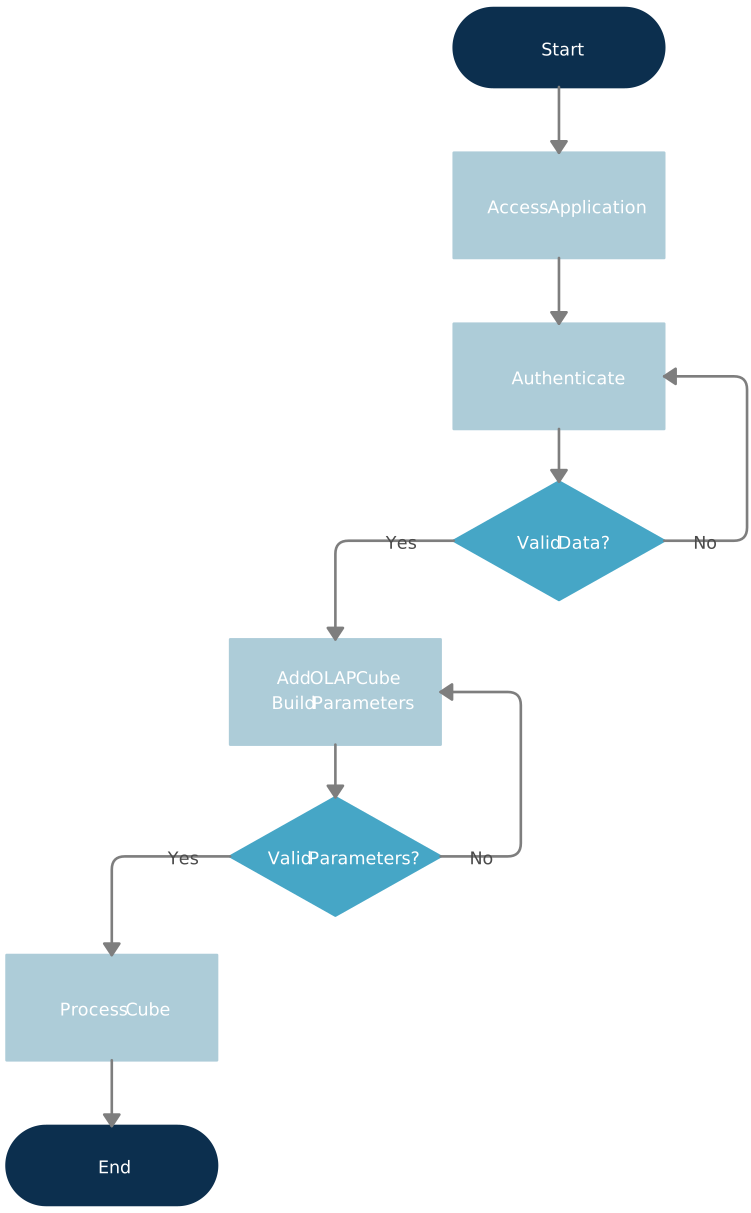
A use case flowchart is a type of flowchart that illustrates how a user interacts with a system or process to achieve a specific goal. It outlines the different steps or actions that occur in a system, focusing on user inputs and the system’s responses. This type of flowchart is often used in software development and business analysis to model user interactions and ensure that system requirements are met. They help developers and analysts understand user needs, design systems that meet those needs, and improve user experience.
When to use them
- Software development – To define and map out how users will interact with a system, such as logging in, making purchases, or generating reports.
- Business processes – To model customer interactions with a service or product, such as purchasing an item or accessing support.
- User experience (UX) design – To visualize how users will navigate a website or application to complete specific tasks.
- System design – To ensure that all user requirements are captured and addressed in a system or software solution.
11. System Flowchart
Best for: System flowcharts are best for understanding and documenting the structure and functioning of complex systems.
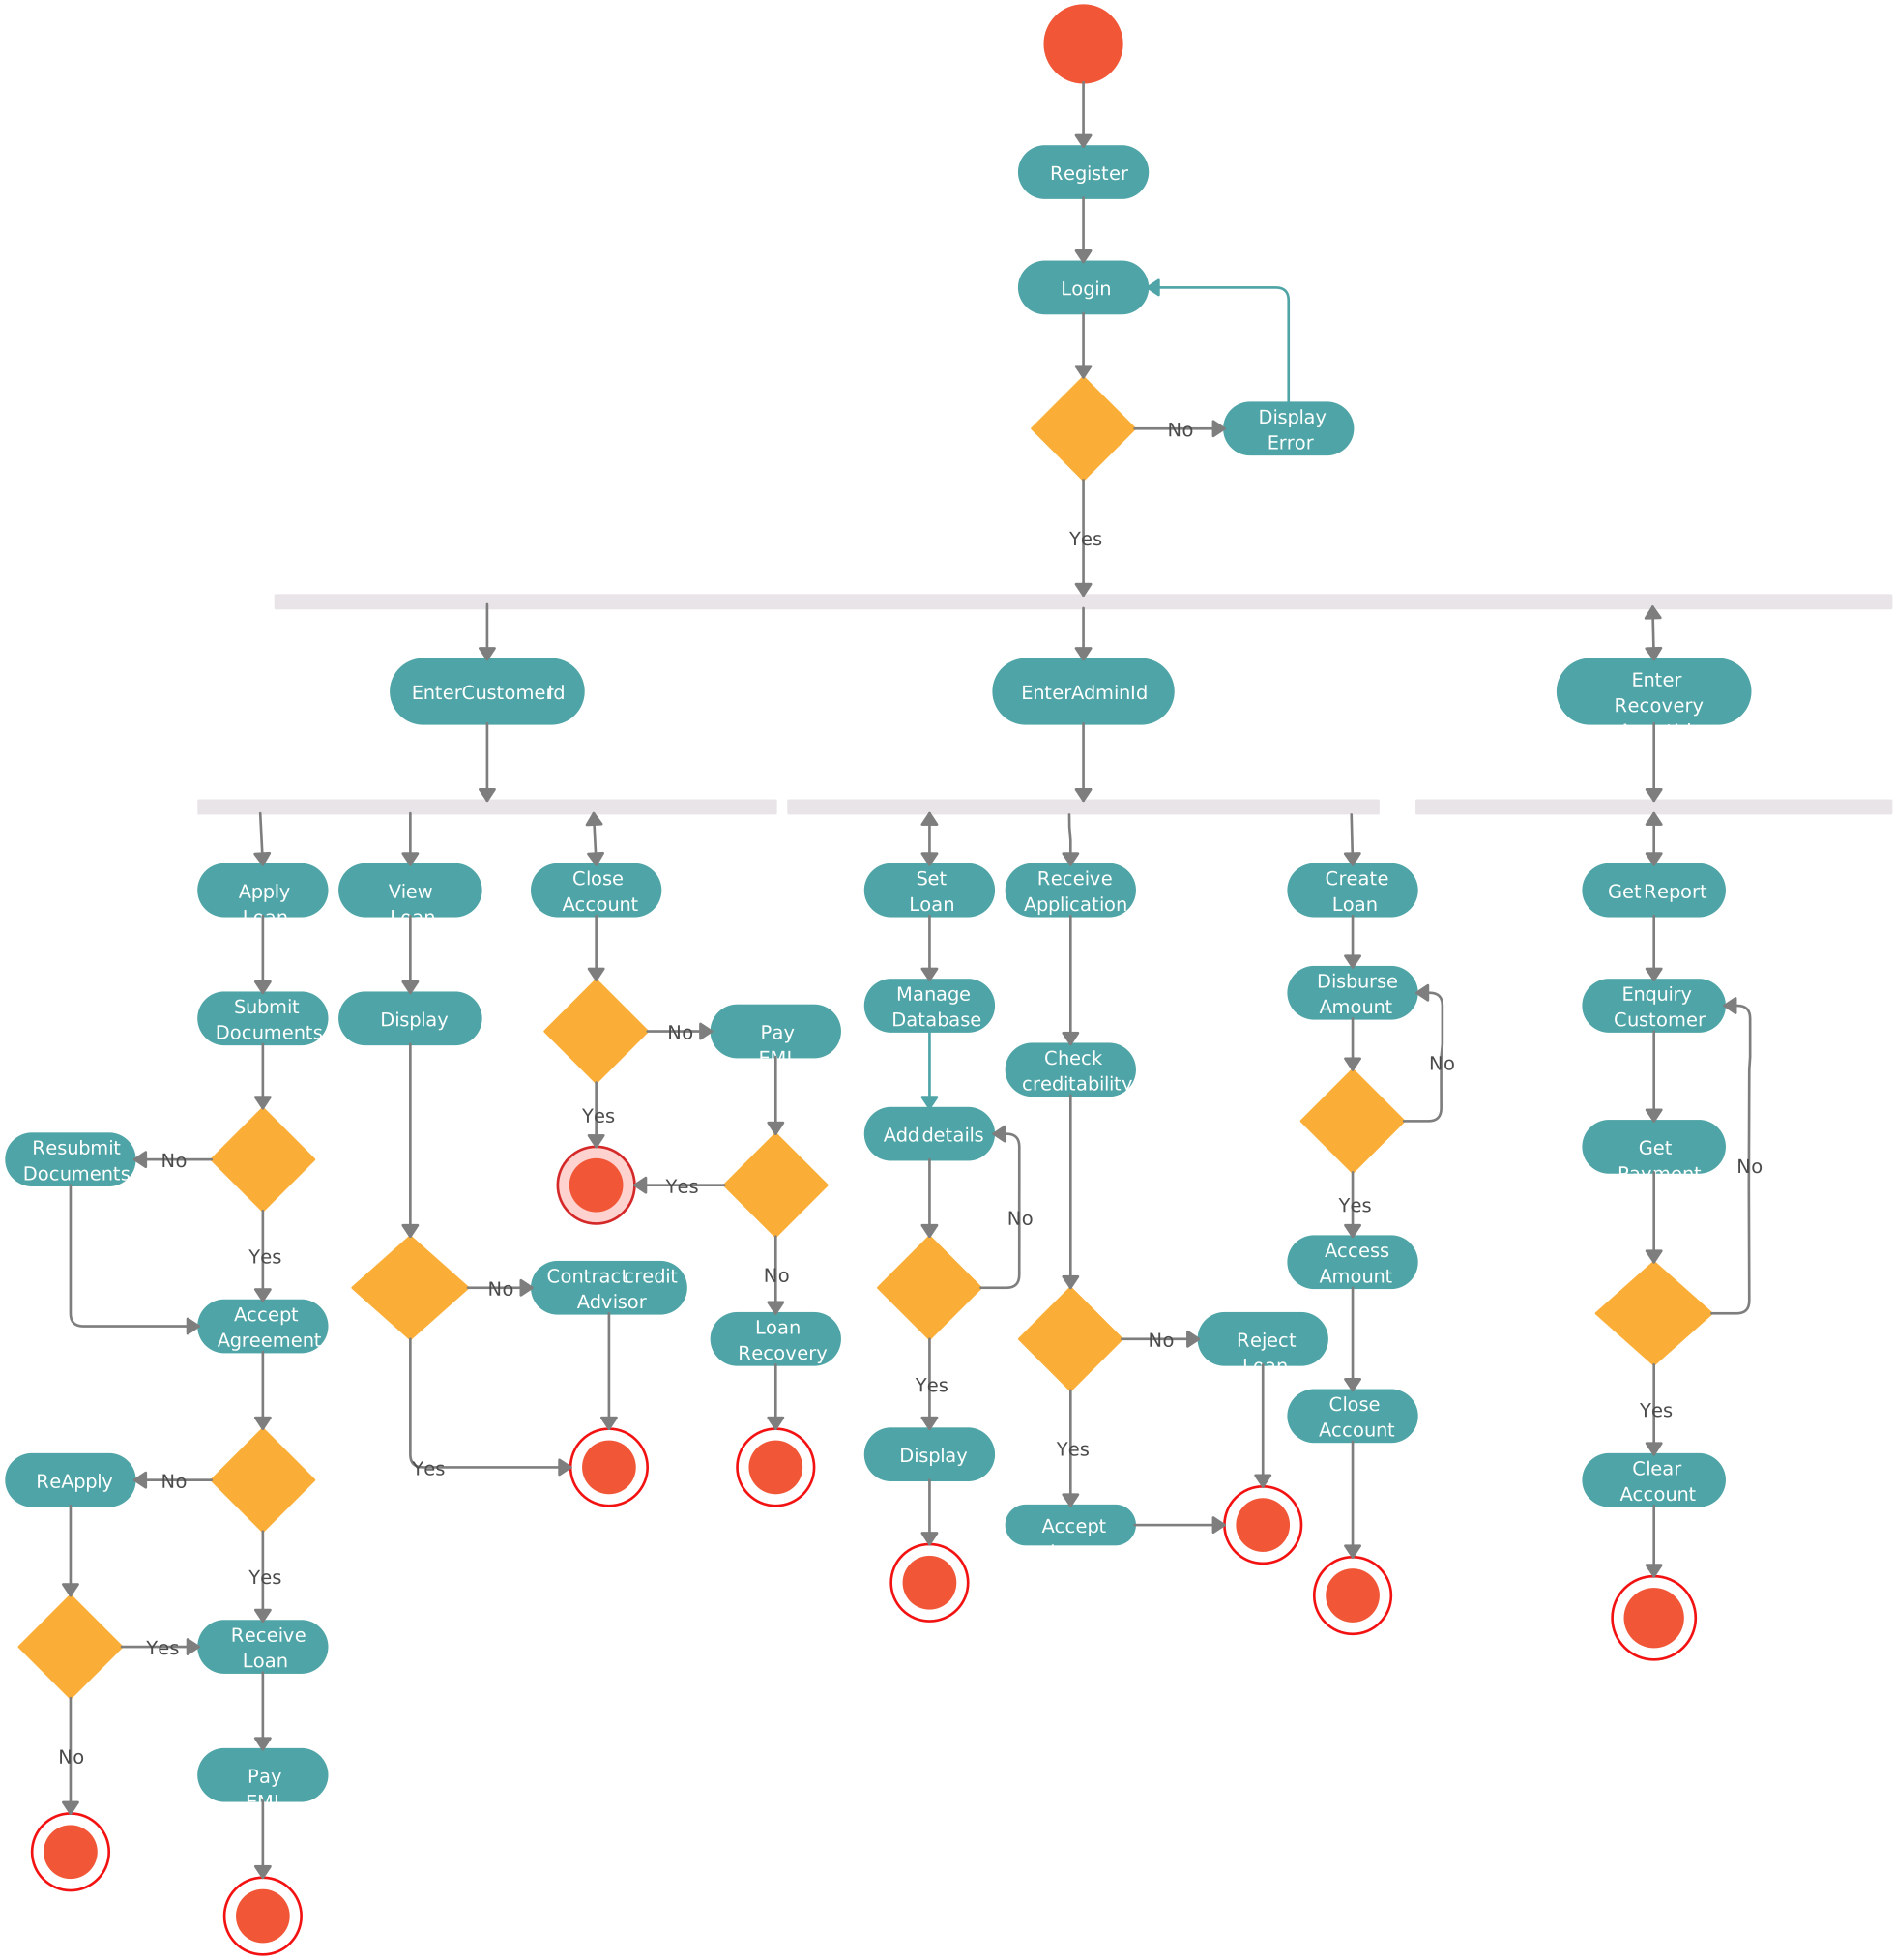
A system flowchart is a type of flowchart that illustrates the components of a system and how they interact with each other. It shows the flow of information, data, or control within a system, highlighting how different elements (such as hardware, software, and databases) work together. They help system architects, developers, and engineers visualize how different components work together, ensuring smooth operation and efficient design. These diagrams are often used in IT systems, software development, and engineering projects to map out both physical and logical components.
When to use them
- Software development – To depict how different software components communicate with each other or external systems.
- IT infrastructure – To show how servers, databases, and networks are connected and share information.
- Embedded systems – To visualize how software and hardware components in devices (like appliances or automotive systems) interact.
- System troubleshooting – To identify potential issues within the system’s design by showing how various elements are connected.
12. Document Flowchart
Best for: Document flowcharts are best for understanding how information flows through an organization, especially when dealing with large volumes of documents.
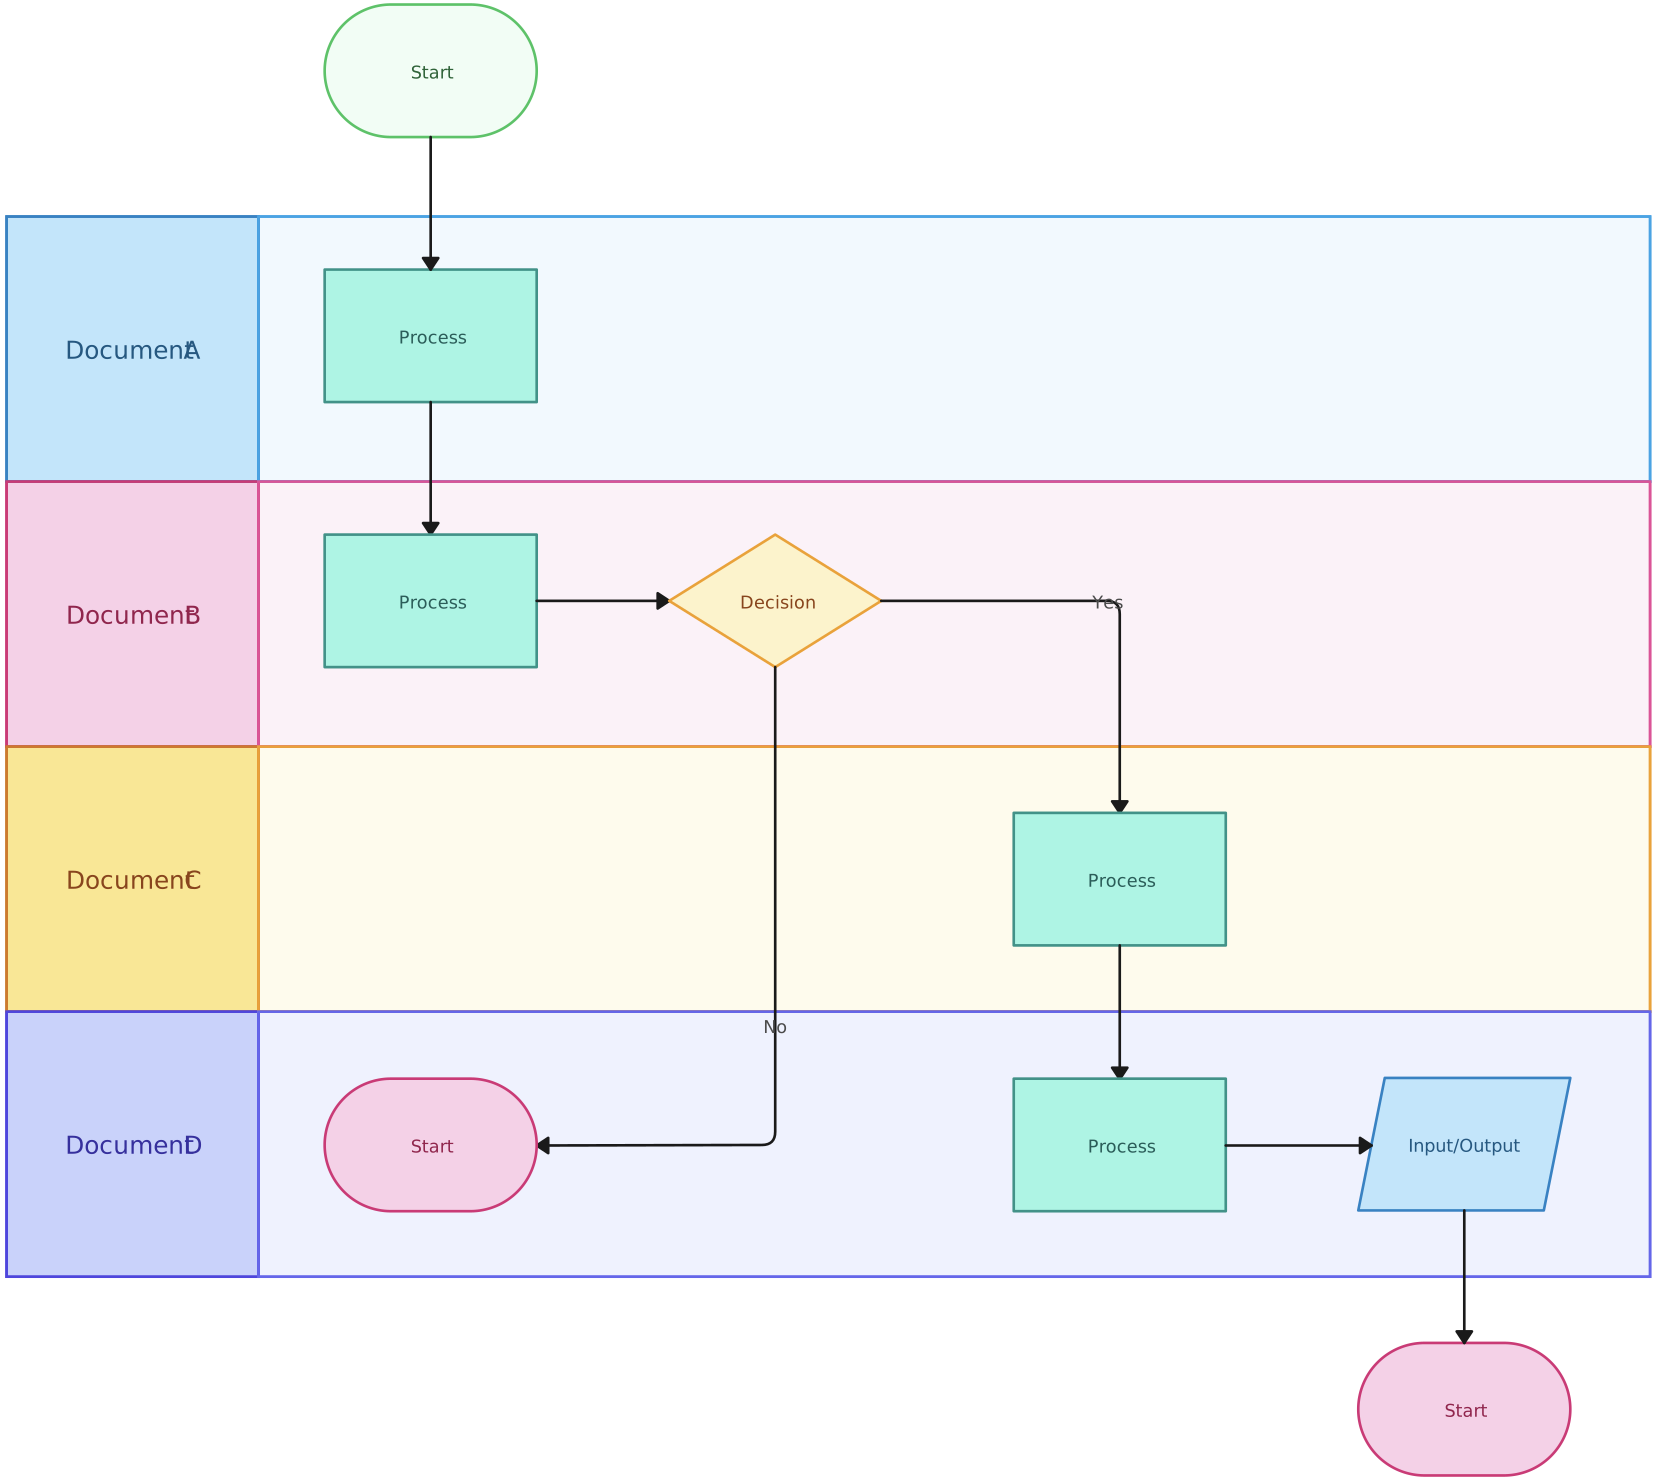
A document flowchart is a type of diagram that illustrates the flow of documents or information through a process. It shows how documents are created, stored, reviewed, approved, and distributed within a system or workflow. These flowcharts are often used in environments where managing paperwork, records, or digital files is crucial, helping to visualize and streamline document handling. They help identify bottlenecks, improve efficiency, and ensure that documents are handled properly at each stage. They are commonly used in industries like legal, healthcare, and finance, where proper documentation is essential.
When to use them
- Business operations – To track the movement of contracts, invoices, or purchase orders through approval and filing processes.
- Legal and compliance – To visualize how legal documents or case files are managed through review, approval, and storage.
- Healthcare – To show how patient records are created, shared, and updated between departments or providers.
- Finance and accounting – To manage the flow of financial documents, such as expense reports or tax filings.
13. Cross-Functional Flowchart
Best for: Cross-functional flowcharts are best for processes that involve multiple departments or teams.
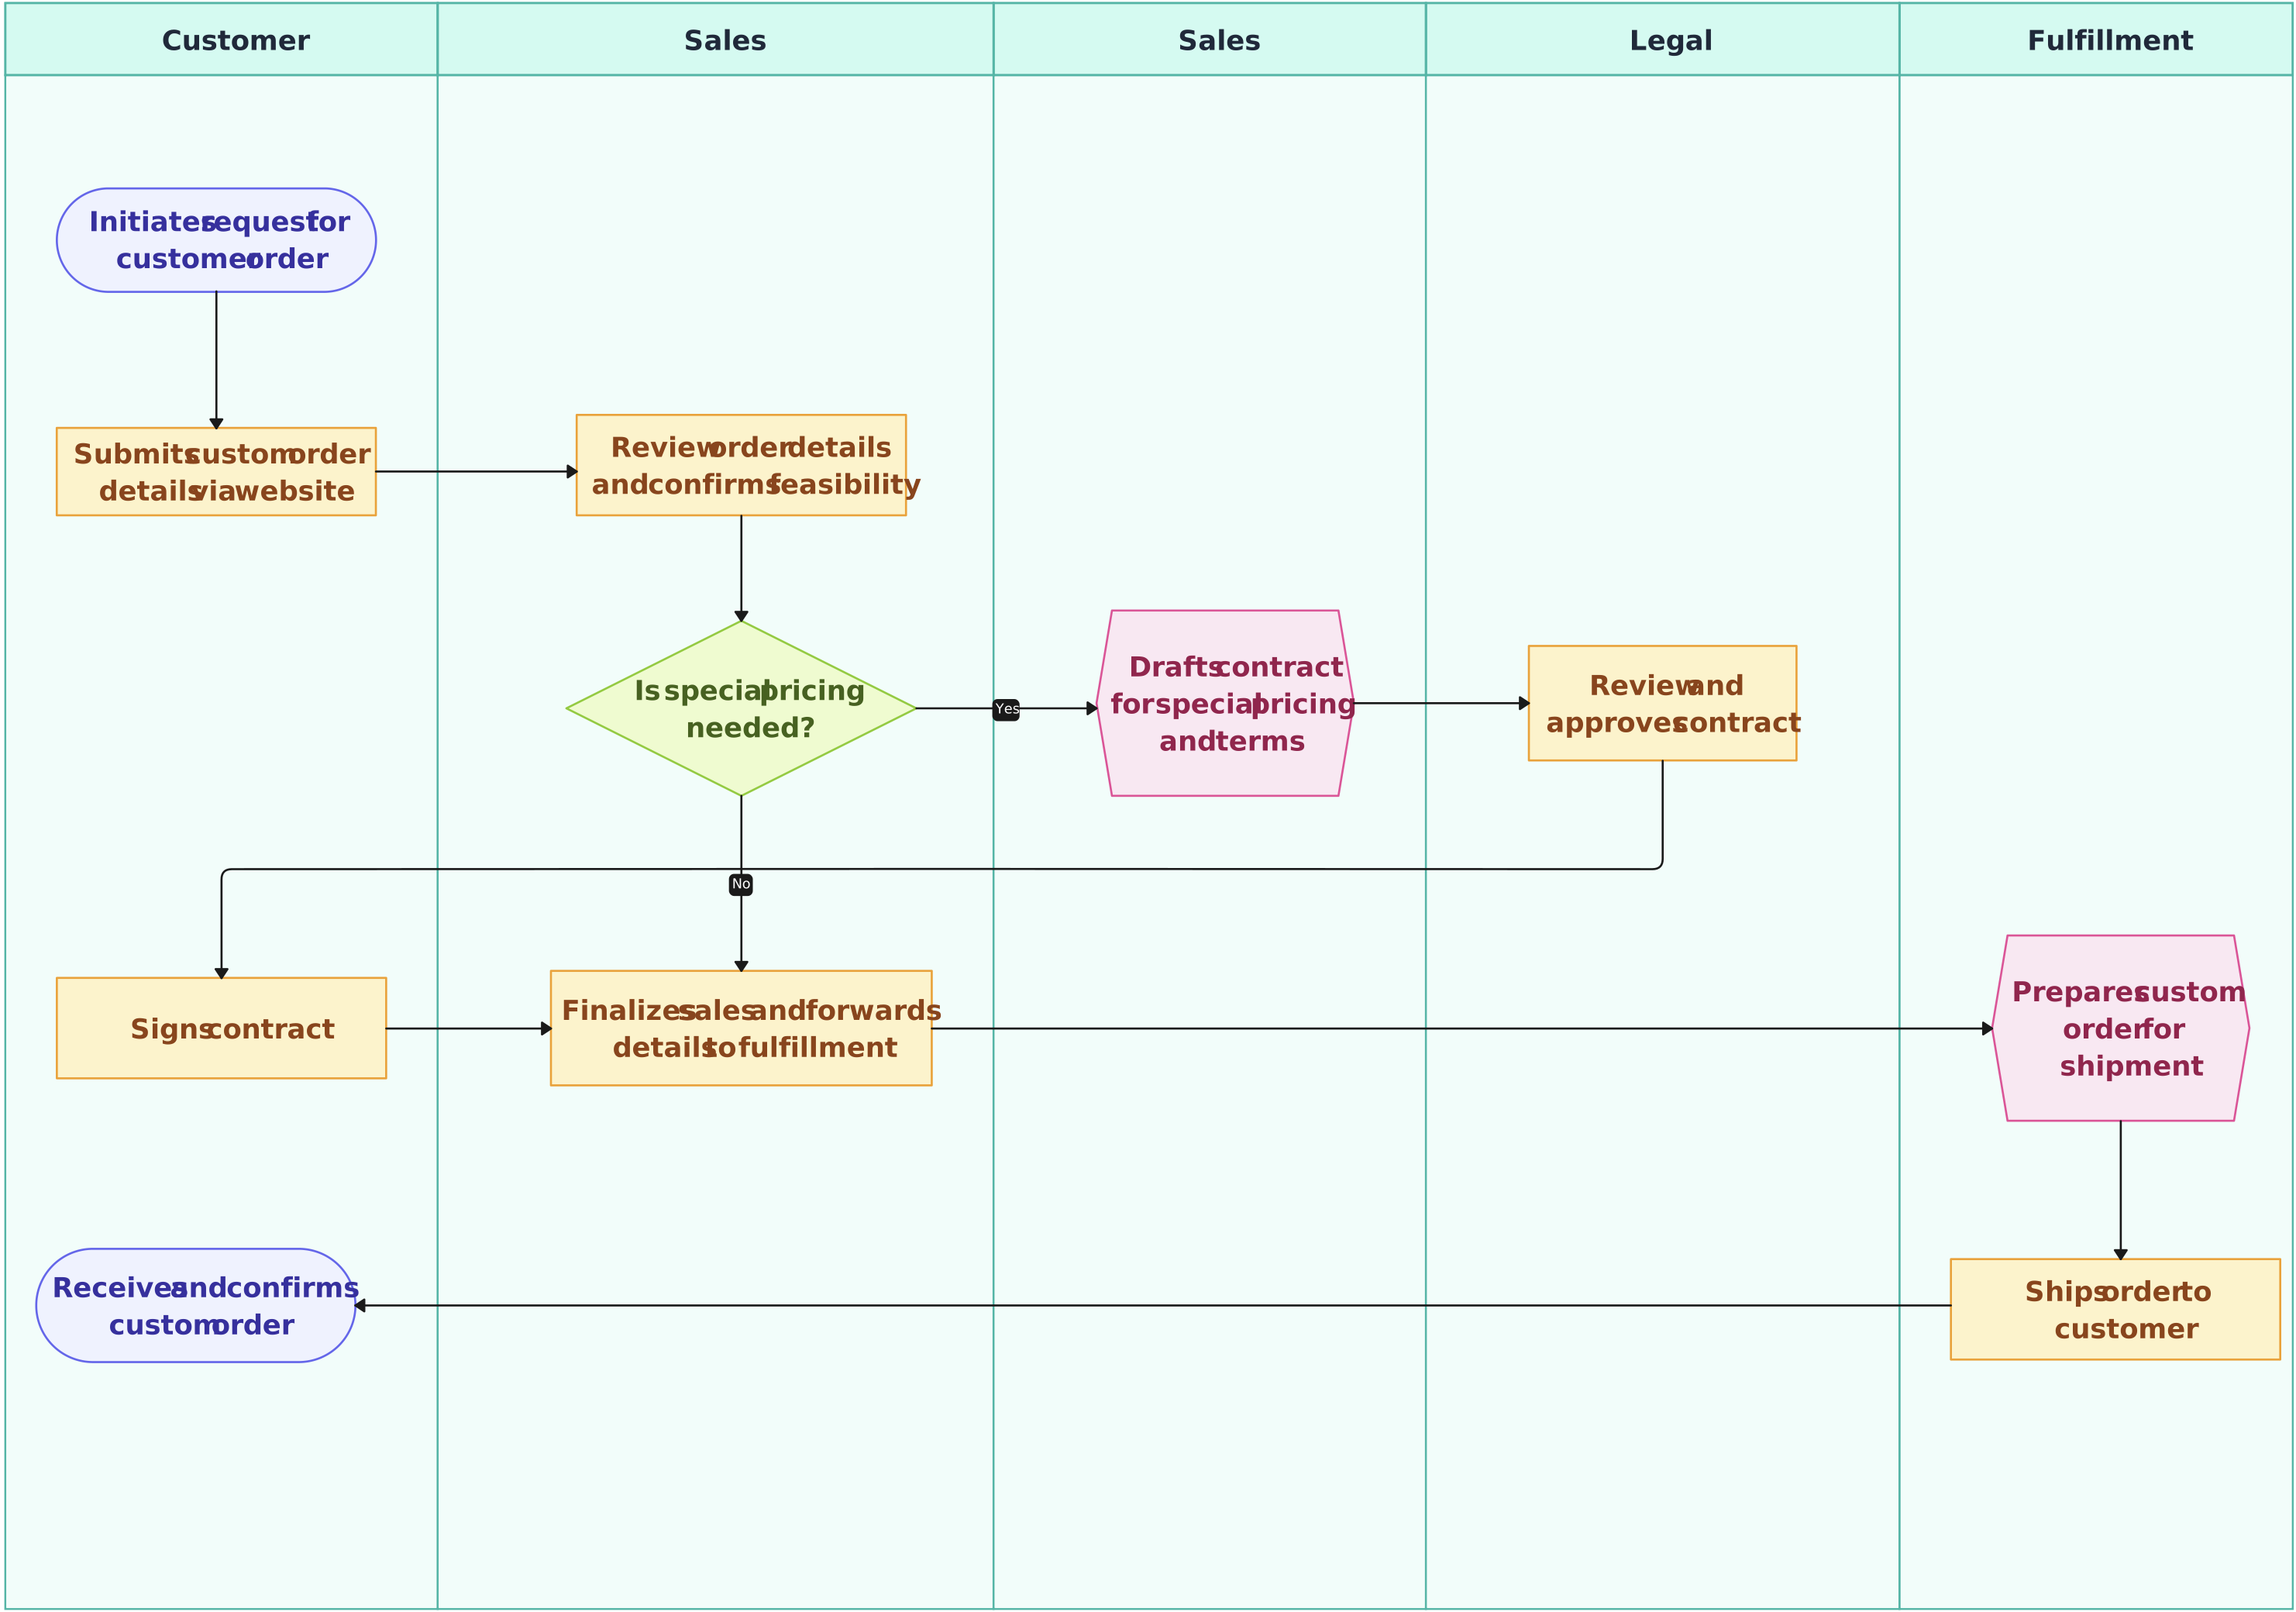
A cross-functional flowchart, also known as a “deployment flowchart,” is a type of diagram that maps out a process while showing how different departments, teams, or roles interact with each other. It divides the flowchart into “lanes,” where each lane represents a specific function or group responsible for particular tasks in the process. This structure helps visualize how responsibilities are distributed across different groups and how work transitions between them.
When to use them
- Business operations – To map out processes like product development, order fulfillment, or customer service workflows that involve multiple departments.
- Project management – To show how tasks are handled by different teams at various stages of a project.
- Manufacturing – To illustrate how production tasks are divided across departments like assembly, quality control, and shipping.
- Healthcare – To track patient care activities involving various departments such as emergency services, lab work, and surgery.
14. Linear Flowchart
Best for: Linear flowcharts are best for straightforward processes where tasks or steps must be performed in a specific, sequential order.

A linear flowchart is a simple type of flowchart that shows a process or sequence of steps in a straight line, from start to finish. It follows a clear, step-by-step path with minimal branches or decisions, making it easy to understand. This type of flowchart is ideal for processes that follow a set order without much deviation or complex decision-making.
When to use them
- Business operations – To outline simple processes like onboarding new employees or handling routine customer service inquiries.
- Manufacturing – To map out linear production processes, such as assembling a product or packaging goods.
- Software development – To represent simple steps in a program’s workflow, such as user login or data entry.
- Educational guides – To create step-by-step instructions or tutorials that follow a clear, linear sequence.
15. User Flow Flowchart
Best for: User flow flowcharts are best for designing and optimizing user interfaces by visualizing how users move through different stages of interaction.
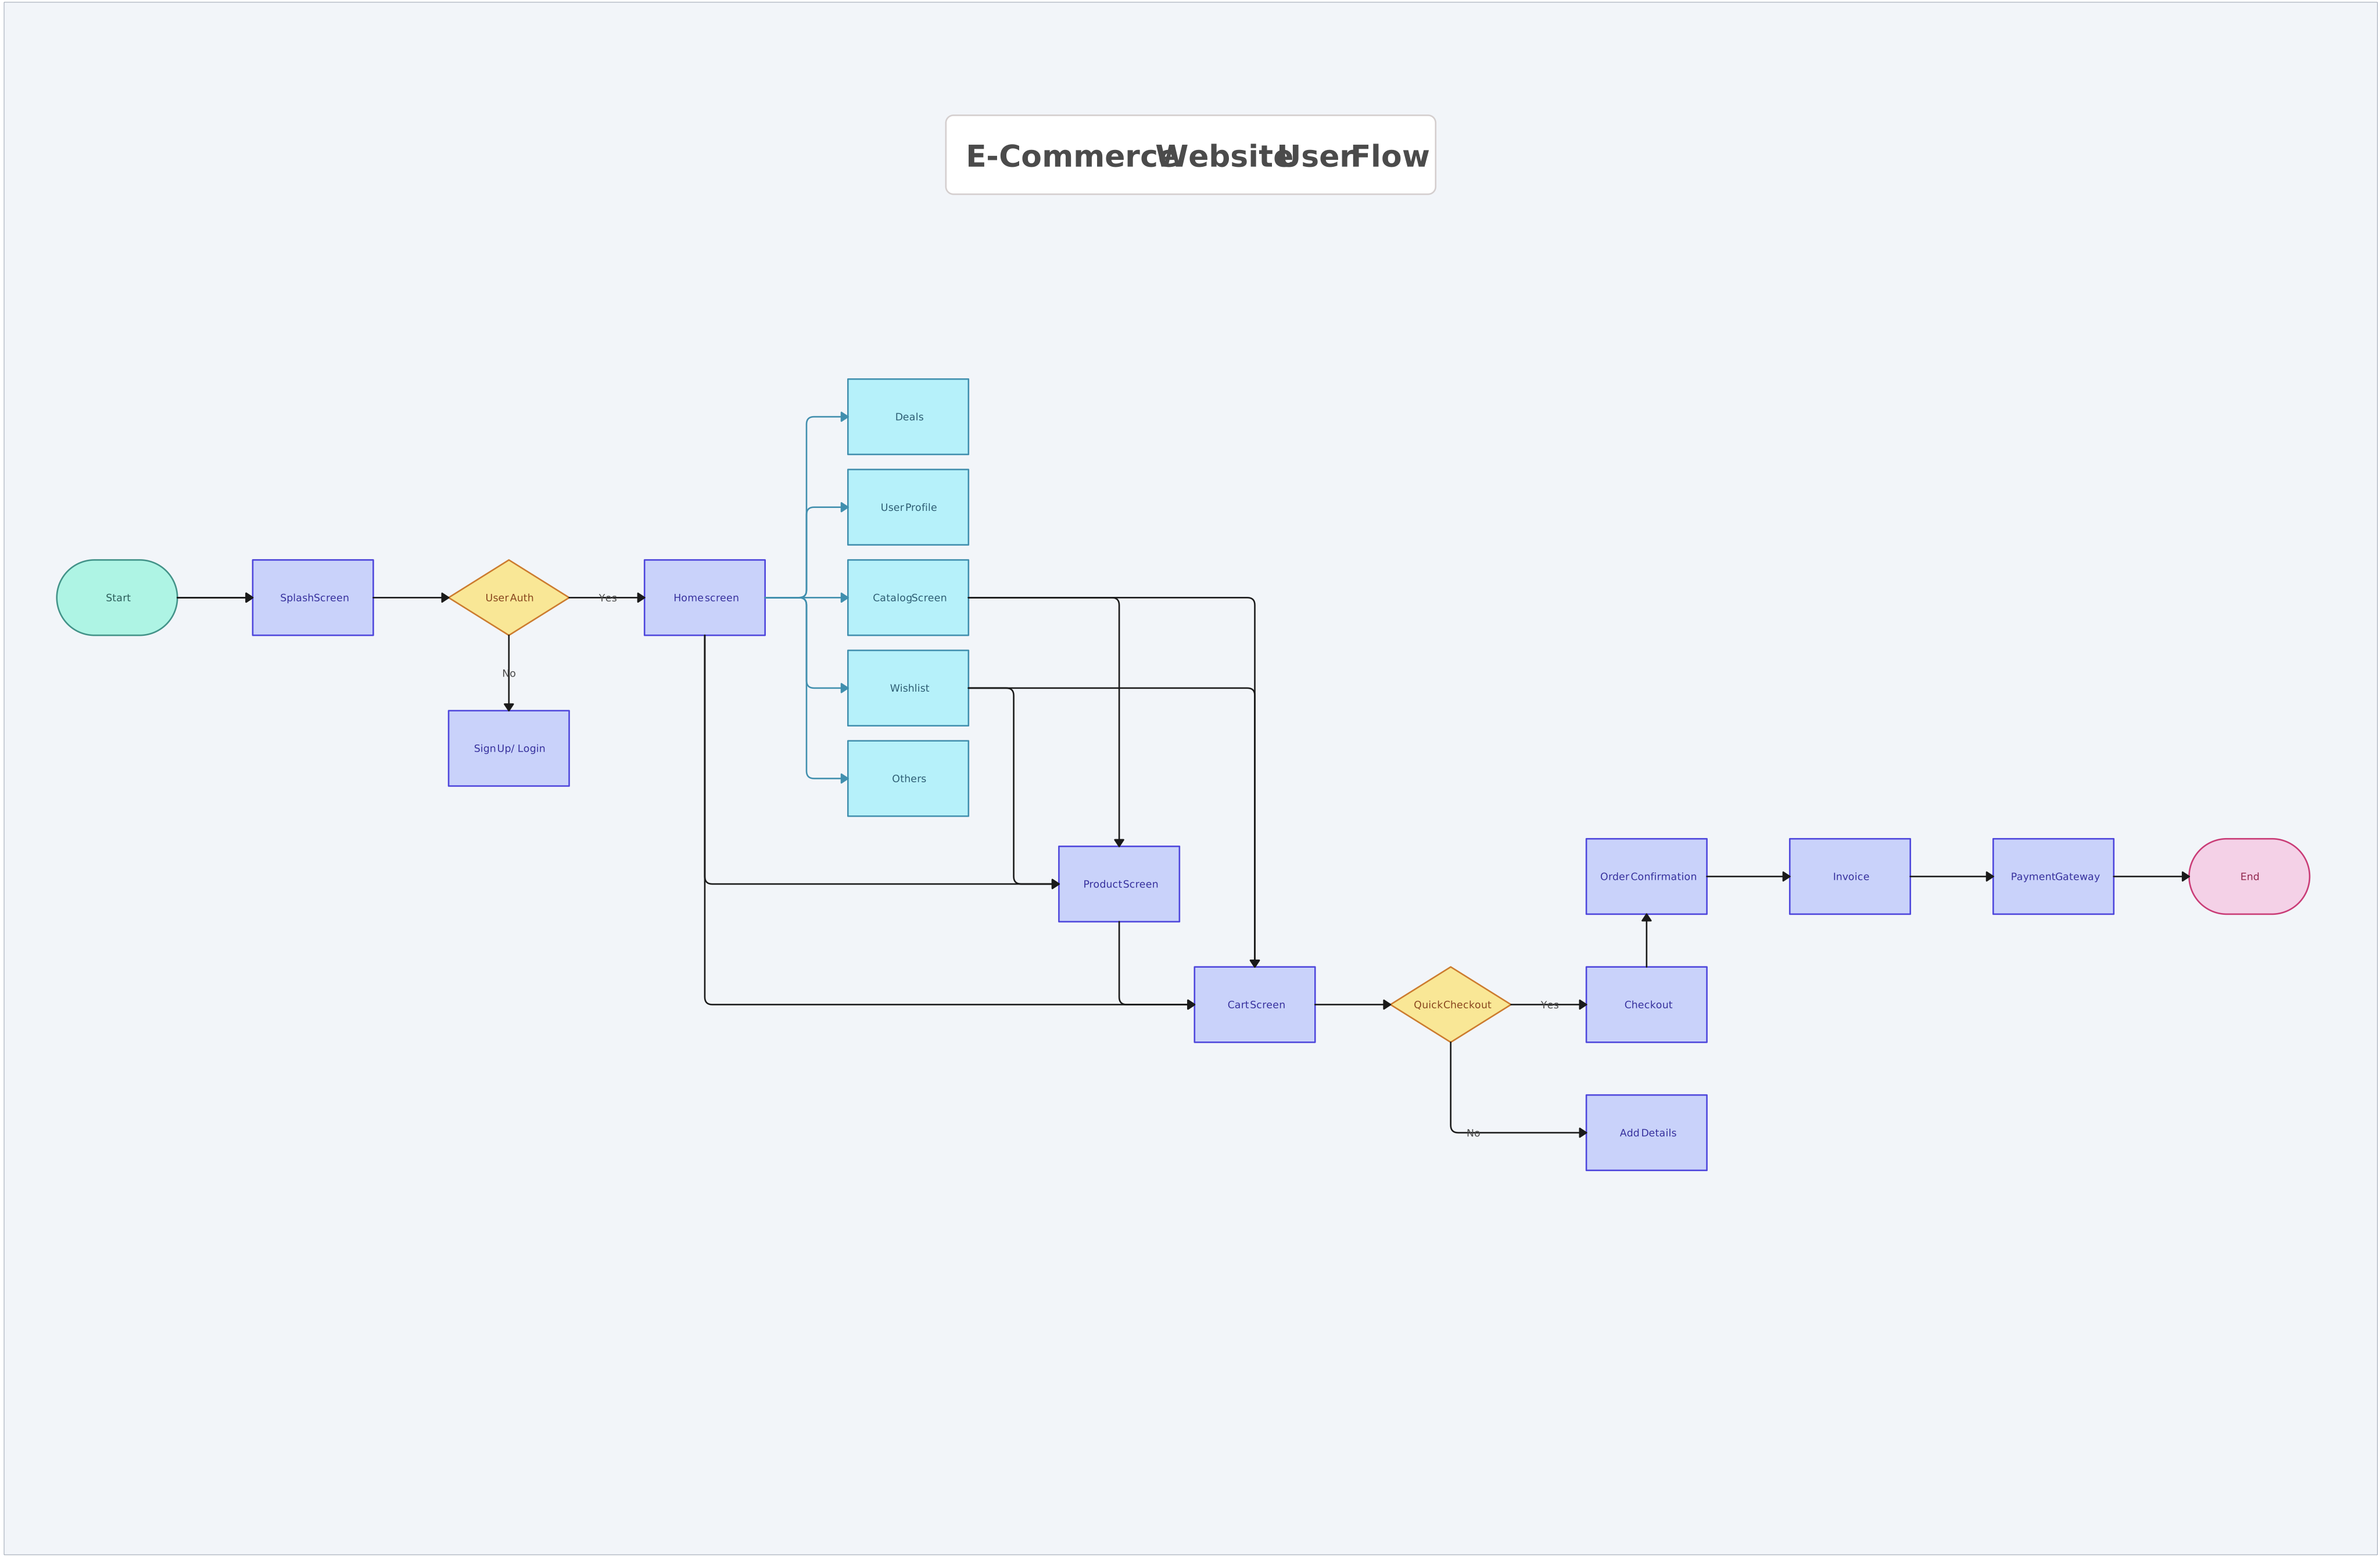
A user flow flowchart or UX flowchart is a visual representation of how users interact with a product, such as a website or mobile app, through various steps. It maps out the user journey, showing the different screens, actions, and decisions a user makes while navigating the system. User flow flowcharts are used to understand and design the user experience, ensuring that interactions are smooth, intuitive, and meet the user’s needs.
When to use them
- Website design – To map out how users will navigate through the site, from the homepage to key sections like product pages or contact forms.
- App design – To design the flow of interactions within an app, ensuring users can complete tasks like signing up, purchasing, or accessing features without confusion.
- User testing – To visualize user paths and identify where users may get stuck or abandon tasks, enabling designers to refine the experience.
- Prototyping – To plan out and iterate user flows before building the actual interface or features, ensuring the design is user-friendly.
16. Production Flowchart
Best for: Production flowcharts are best for visualizing the entire production process in a clear, organized manner.
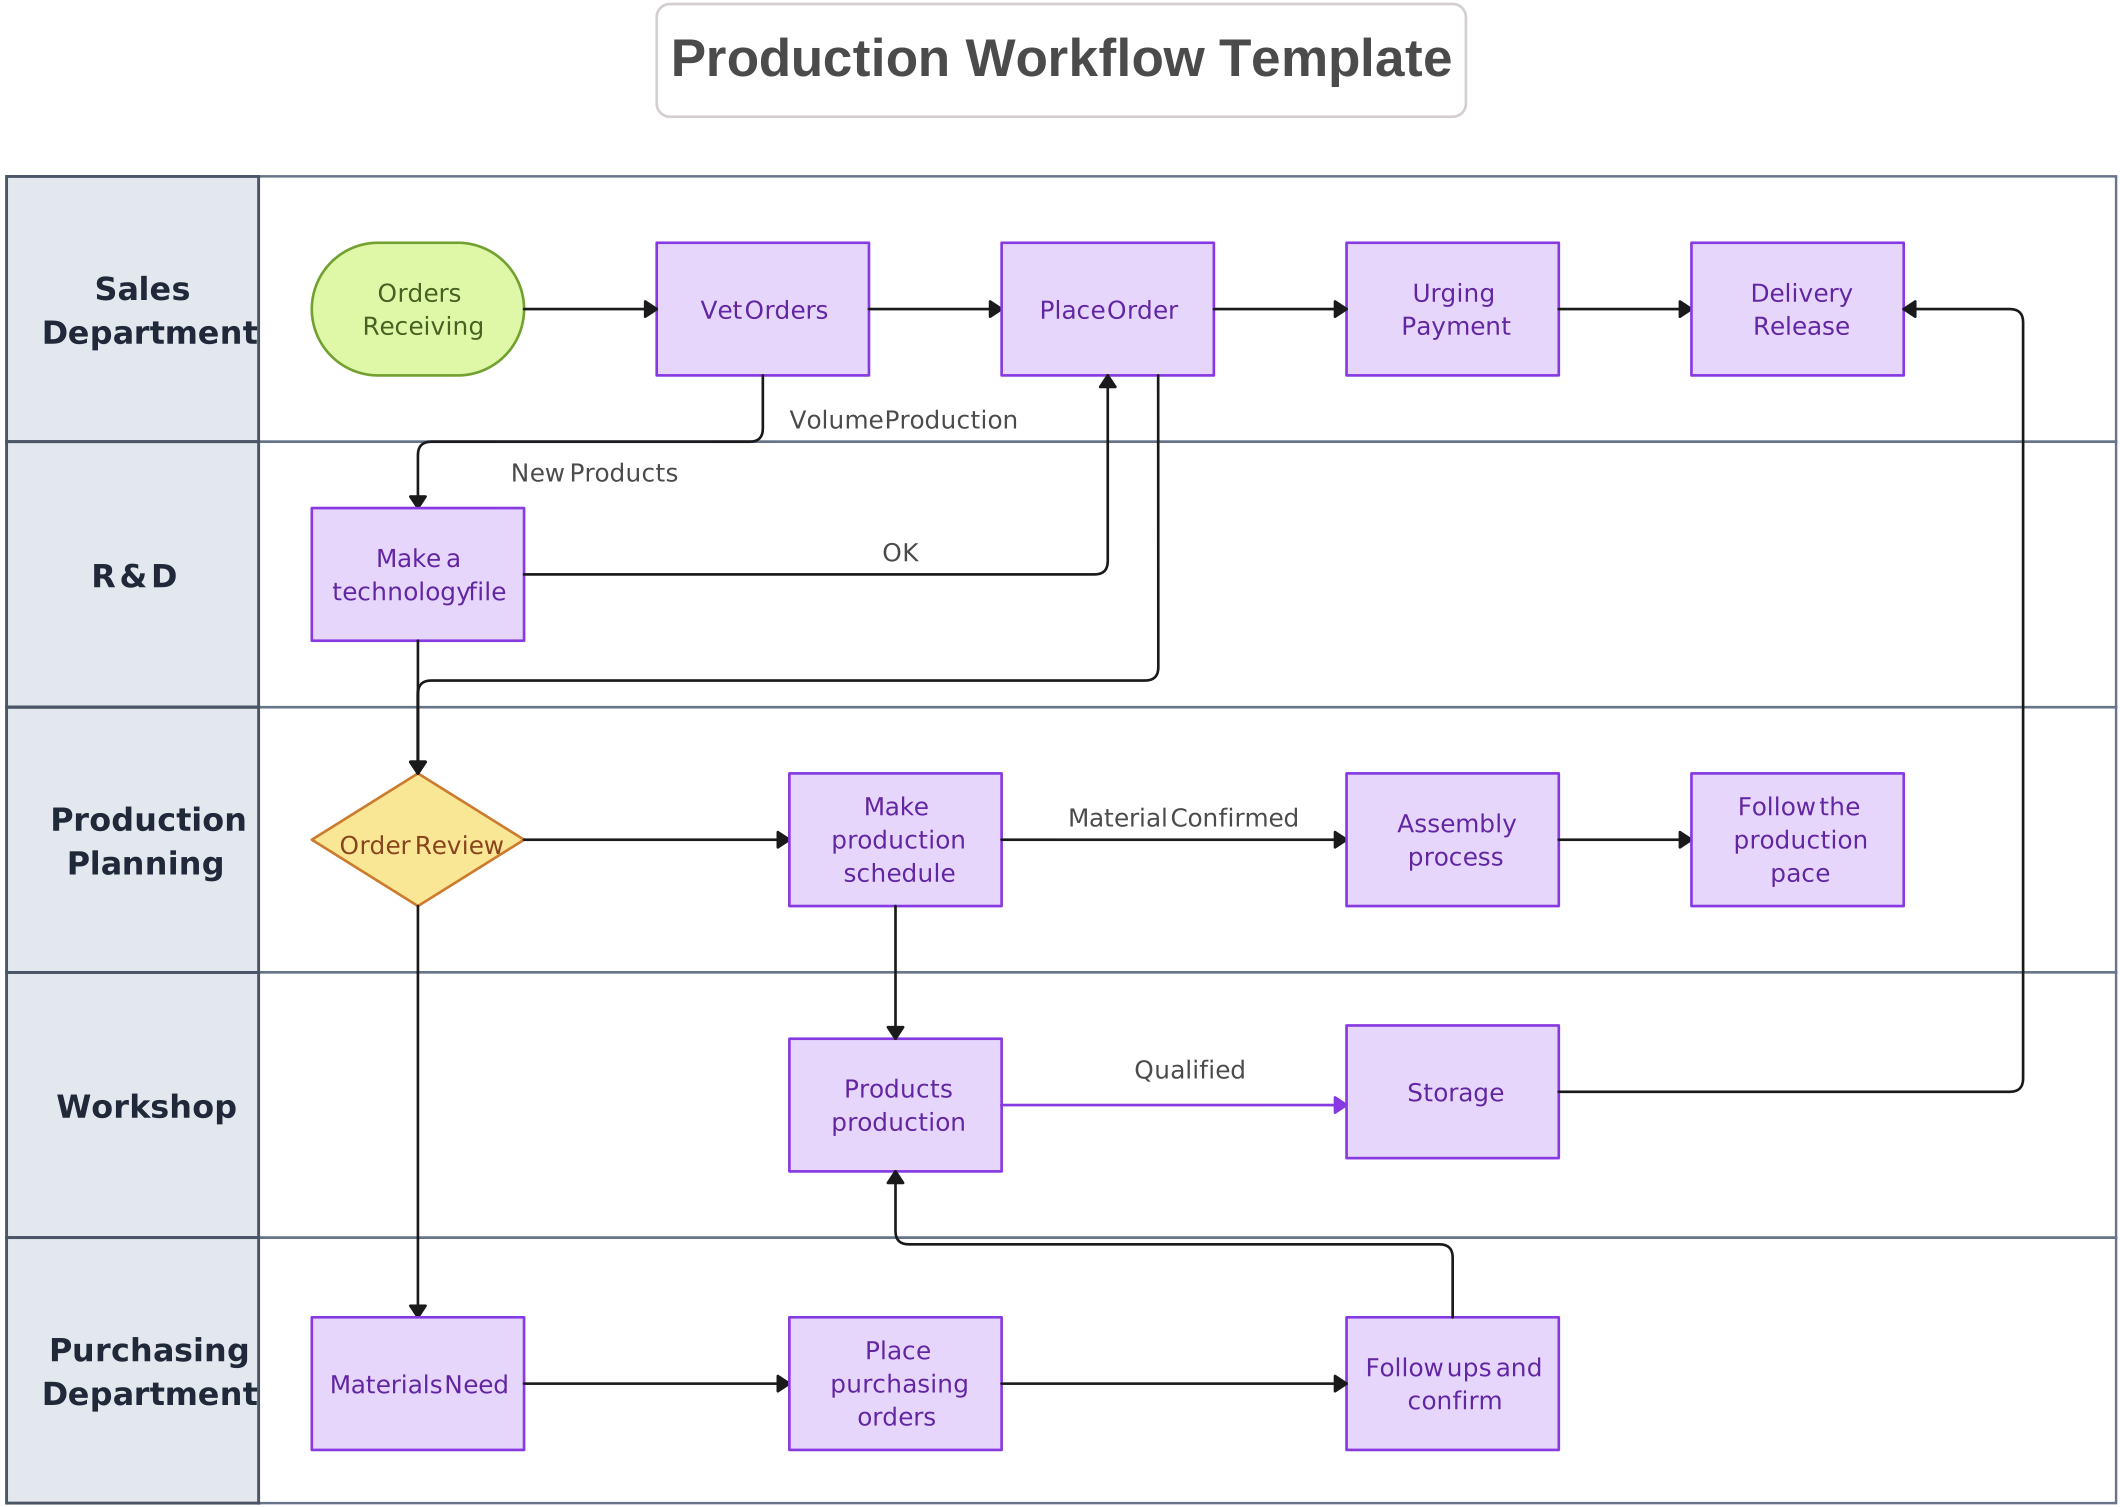
A production flowchart is a type of flowchart used to visualize the steps involved in the manufacturing or production process. It maps out the sequence of operations, from raw materials entering the system to the final product being completed. This type of flowchart helps identify inefficiencies, streamline workflows, and ensure that production processes are consistent and optimized. These flowcharts are especially valuable in industries like manufacturing, food production, and assembly.
When to use them
- Manufacturing – To map out the steps involved in producing goods, such as assembly lines or fabrication processes.
- Quality control – To identify areas where quality checks should be applied throughout the production cycle.
- Process optimization – To identify bottlenecks or inefficiencies in the production process and develop strategies for improvement.
- Supply chain management – To track the flow of materials and products from suppliers to the production floor and eventually to customers.
17. Yes No Flowchart
Best for: Quickly visualizing decision-making processes, troubleshooting problems, and ensuring consistency in workflows.
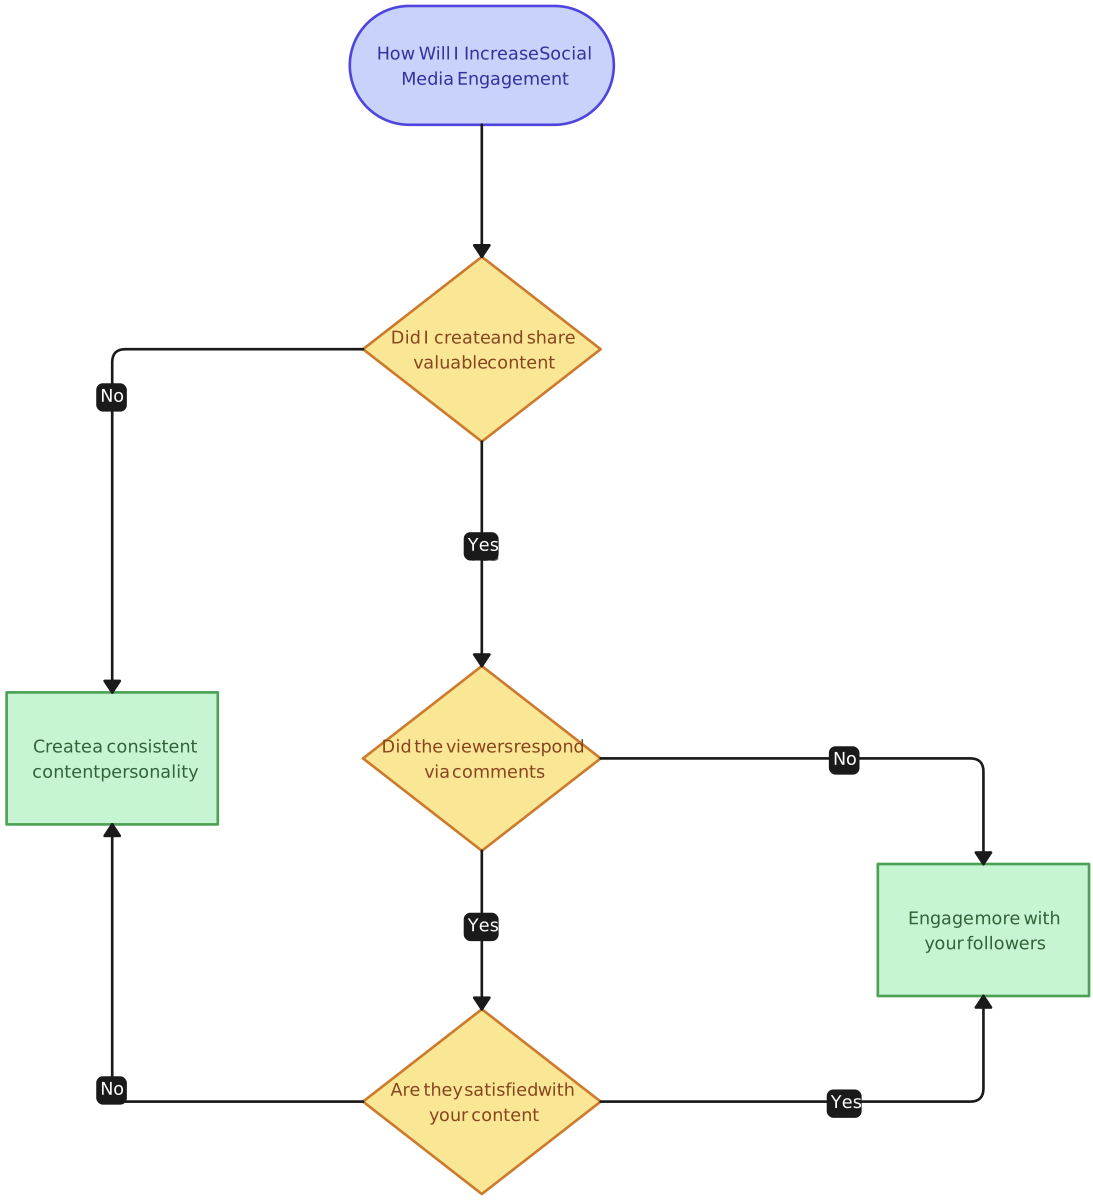
A yes/no flowchart is a simple decision-making tool that guides users through a series of yes-or-no questions to determine an outcome. It starts with a question or condition, and based on the answer (yes or no), it directs the user to the next step in the process. These flowcharts are structured with decision nodes that branch into two paths, making them easy to follow. They are widely used for troubleshooting, diagnosing issues, and ensuring consistent decision-making.
When to use them
- Customer support: To determine the next steps based on a customer’s issue.
- Troubleshooting: To diagnose technical problems, like fixing a computer or a machine.
- Compliance checks: To guide employees through safety or legal procedures.
18. Business Process Flowchart
Best for: Standardizing business operations, improving efficiency, and identifying bottlenecks in workflows.
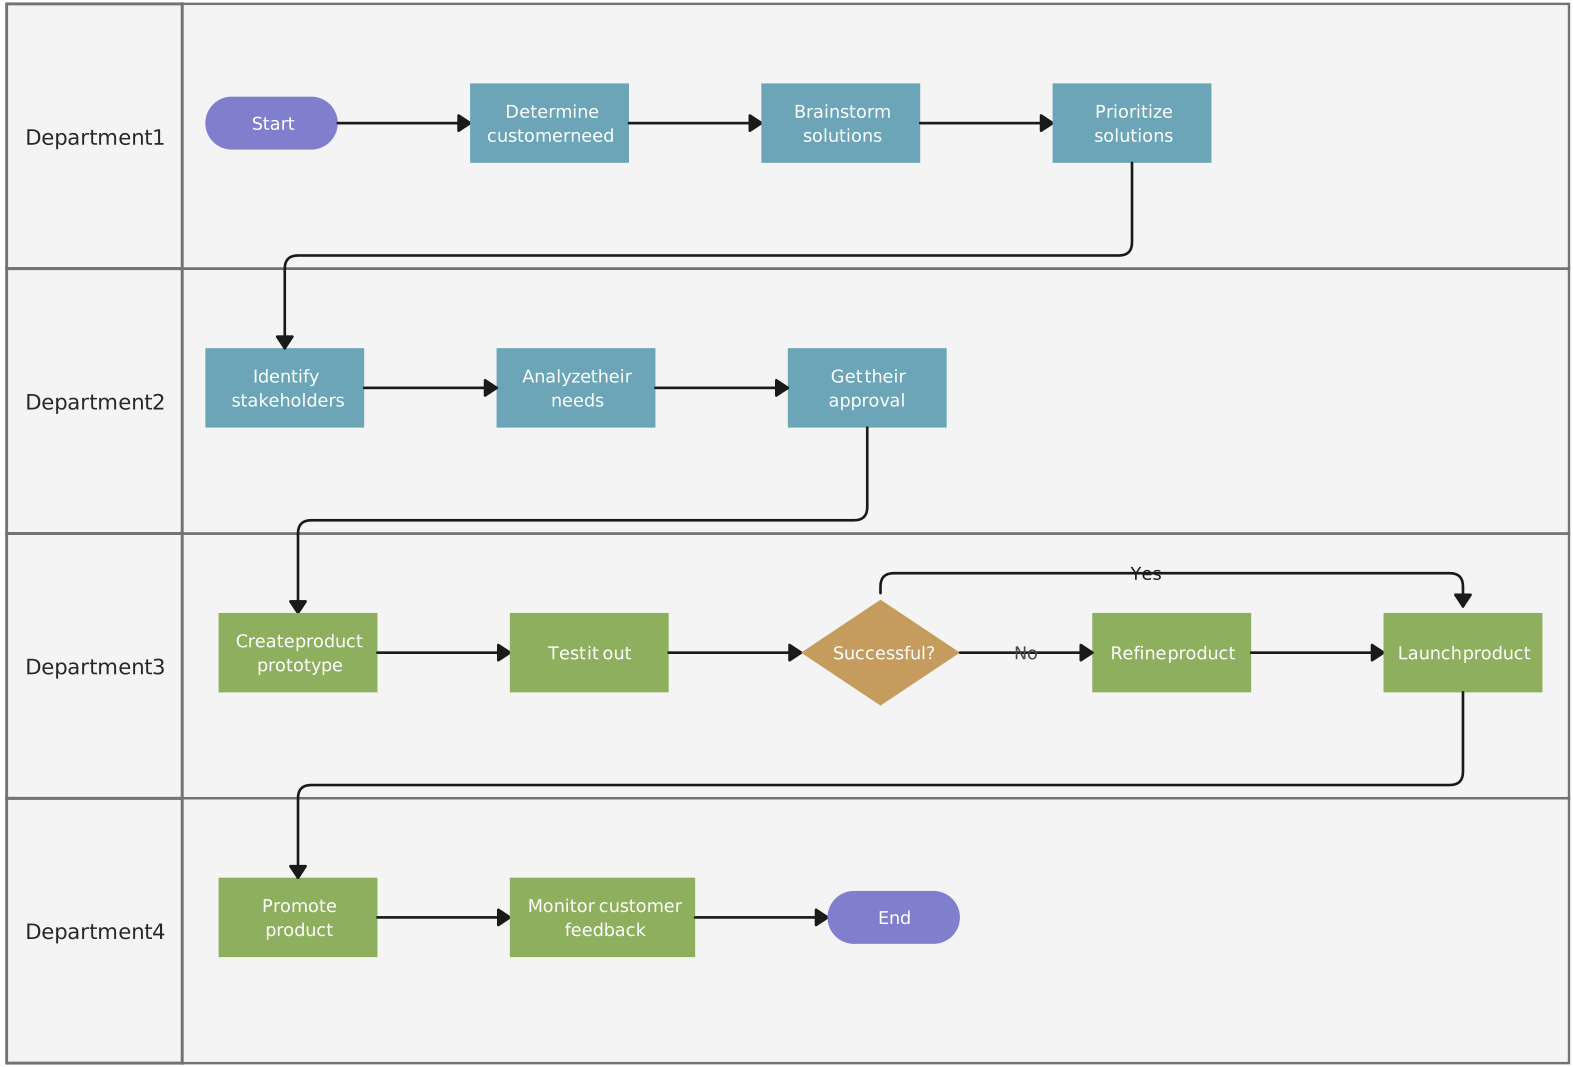
A business process flowchart is a step-by-step diagram that illustrates how tasks, workflows, or operations are completed within an organization. It helps visualize how different roles, teams, and departments interact throughout a process. By mapping out the workflow, businesses can standardize procedures, improve efficiency, and identify areas for optimization. Business process mapping often uses standardized symbols, such as rectangles for tasks, diamonds for decisions, and arrows for direction.
When to use them
- Employee onboarding: To outline the steps for hiring and training new employees.
- Invoice processing: To ensure smooth approvals and payments.
- Project management: To visualize workflows and streamline team collaboration.
19. Product Flowchart
Best for: Managing product development, optimizing production efficiency, and tracking supply chain processes.
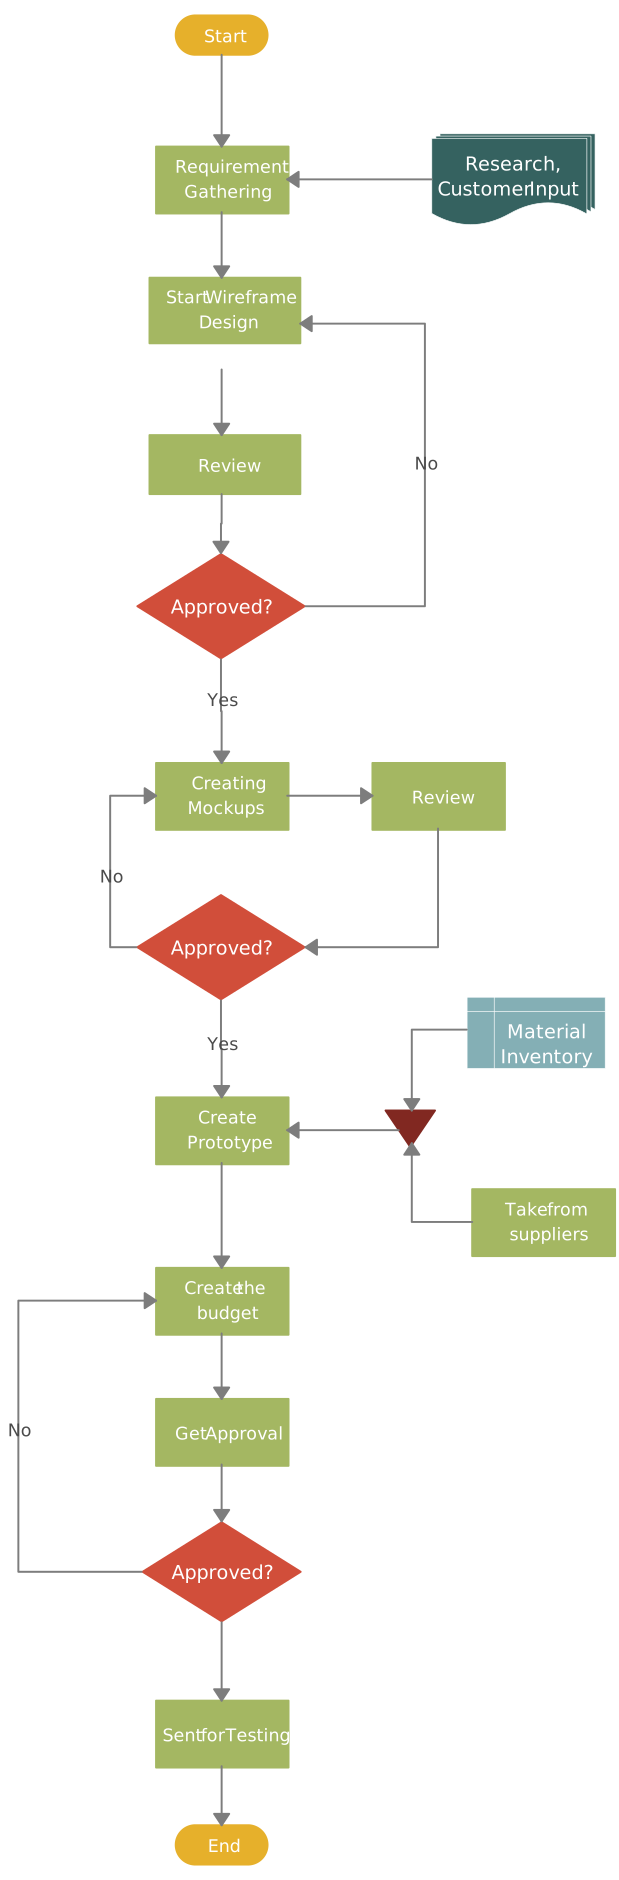
A product flowchart is a diagram that maps out the stages of a product’s lifecycle, from design to production and delivery. It outlines key steps such as raw material sourcing, manufacturing, quality control, packaging, and distribution. These flowcharts are used in industries such as manufacturing, retail, and product development to optimize processes and identify inefficiencies. They provide a clear picture of how a product moves through different stages, helping businesses improve production efficiency and quality.
When to use them
- Manufacturing: To map out production from raw materials to finished products.
- Product design: To show stages from concept to development.
- Quality control: To ensure product testing and approvals follow the correct steps.
20. Website Flowchart
Best for: Planning website design, improving user experience, and ensuring a logical navigation structure.
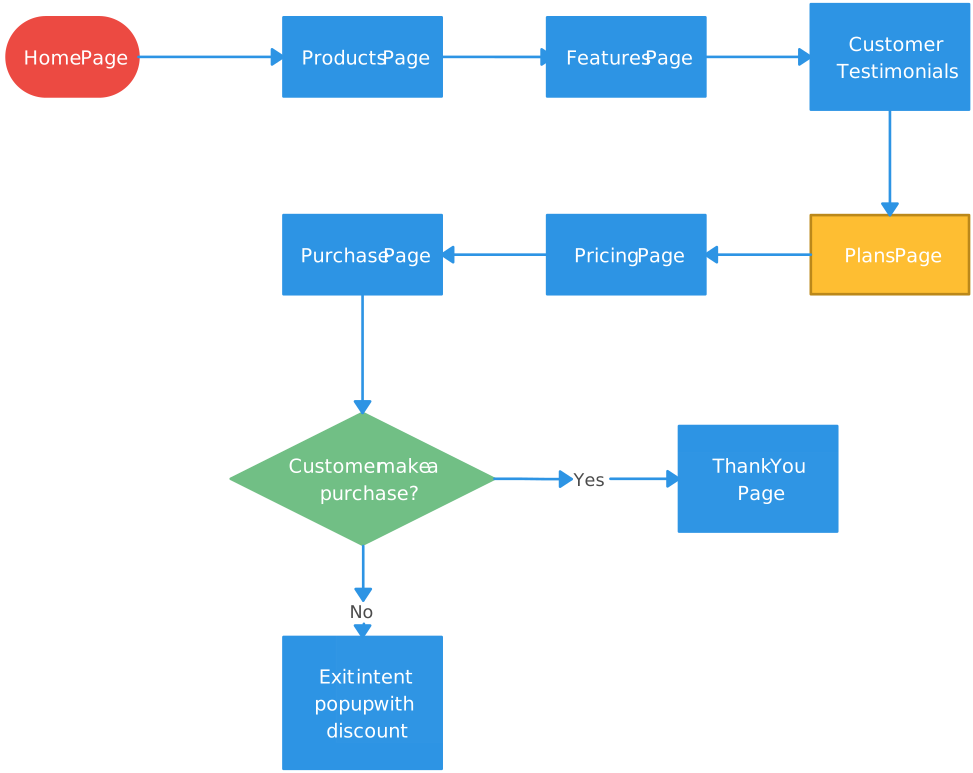
A website flowchart is a visual representation of a website’s structure, showing how pages are connected and how users navigate through the site. It typically includes main pages, subpages, and interactive elements such as menus and links. Website flowcharts are essential for planning site architecture, improving user experience, and ensuring intuitive navigation. They help developers, designers, and marketers align their goals and create a seamless user journey.
When to use them
- Website development: To organize pages and features before building the site.
- User experience (UX) design: To optimize site navigation and usability.
- SEO strategy: To create an intuitive structure for search engines and visitors.
21. E-Commerce Flowchart
Best for: Improving online shopping experiences, streamlining e-commerce operations, and reducing cart abandonment.
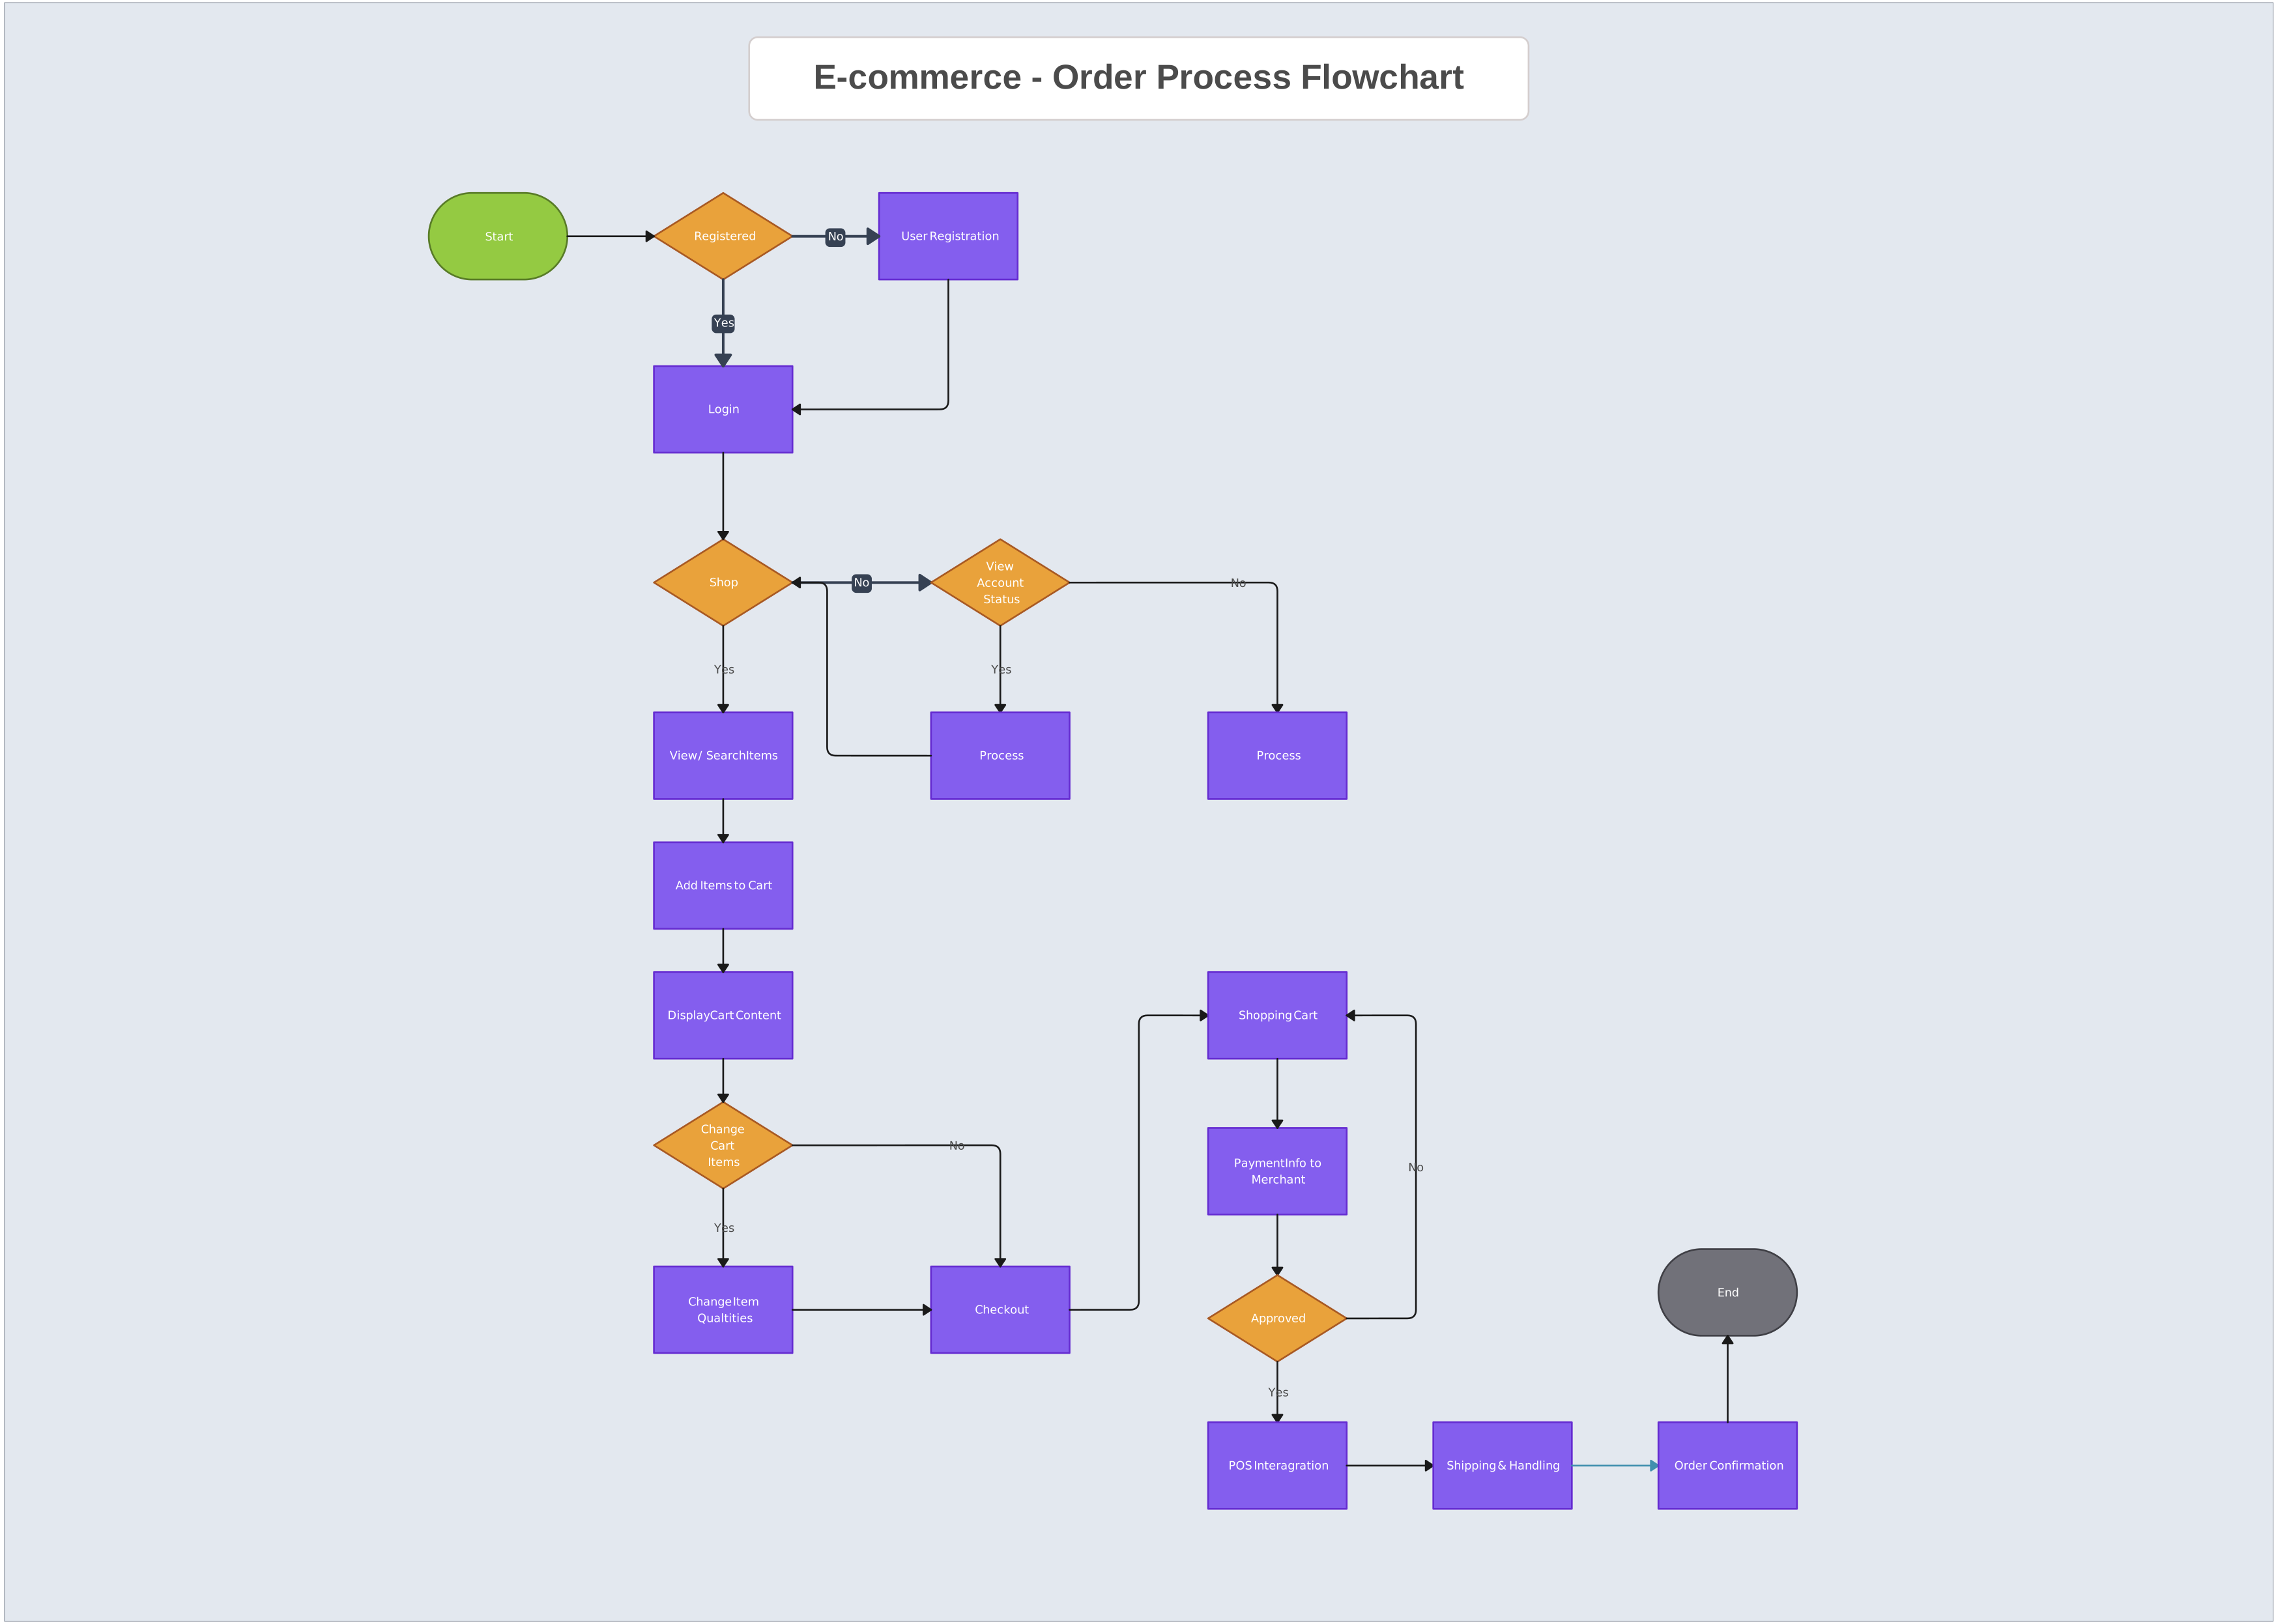
An e-commerce flowchart is a diagram that maps out the key processes involved in running an online store. It outlines steps such as product selection, checkout, payment processing, order fulfillment, and customer support. These flowcharts help businesses streamline their online operations by ensuring a smooth shopping experience, reducing friction in the checkout process, and improving backend workflows. By visualizing these steps, businesses can identify areas for improvement and enhance customer satisfaction.
When to use them
- Checkout process: To visualize the steps from adding items to completing a purchase.
- Order fulfillment: To ensure smooth inventory management and shipping.
- Customer support: To guide users through returns, refunds, or order tracking.
Simplify Drawing Flowcharts with Creately
Creately’s flowchart software simplifies the process of creating professional, clear, and accurate flowcharts. Whether you’re designing a business process, a software workflow, or a system map, Creately provides the right tools and features to help you visualize your ideas. With an intuitive interface and a wide array of customization options, Creately is ideal for both beginners and professionals looking to create effective flowcharts for any purpose.
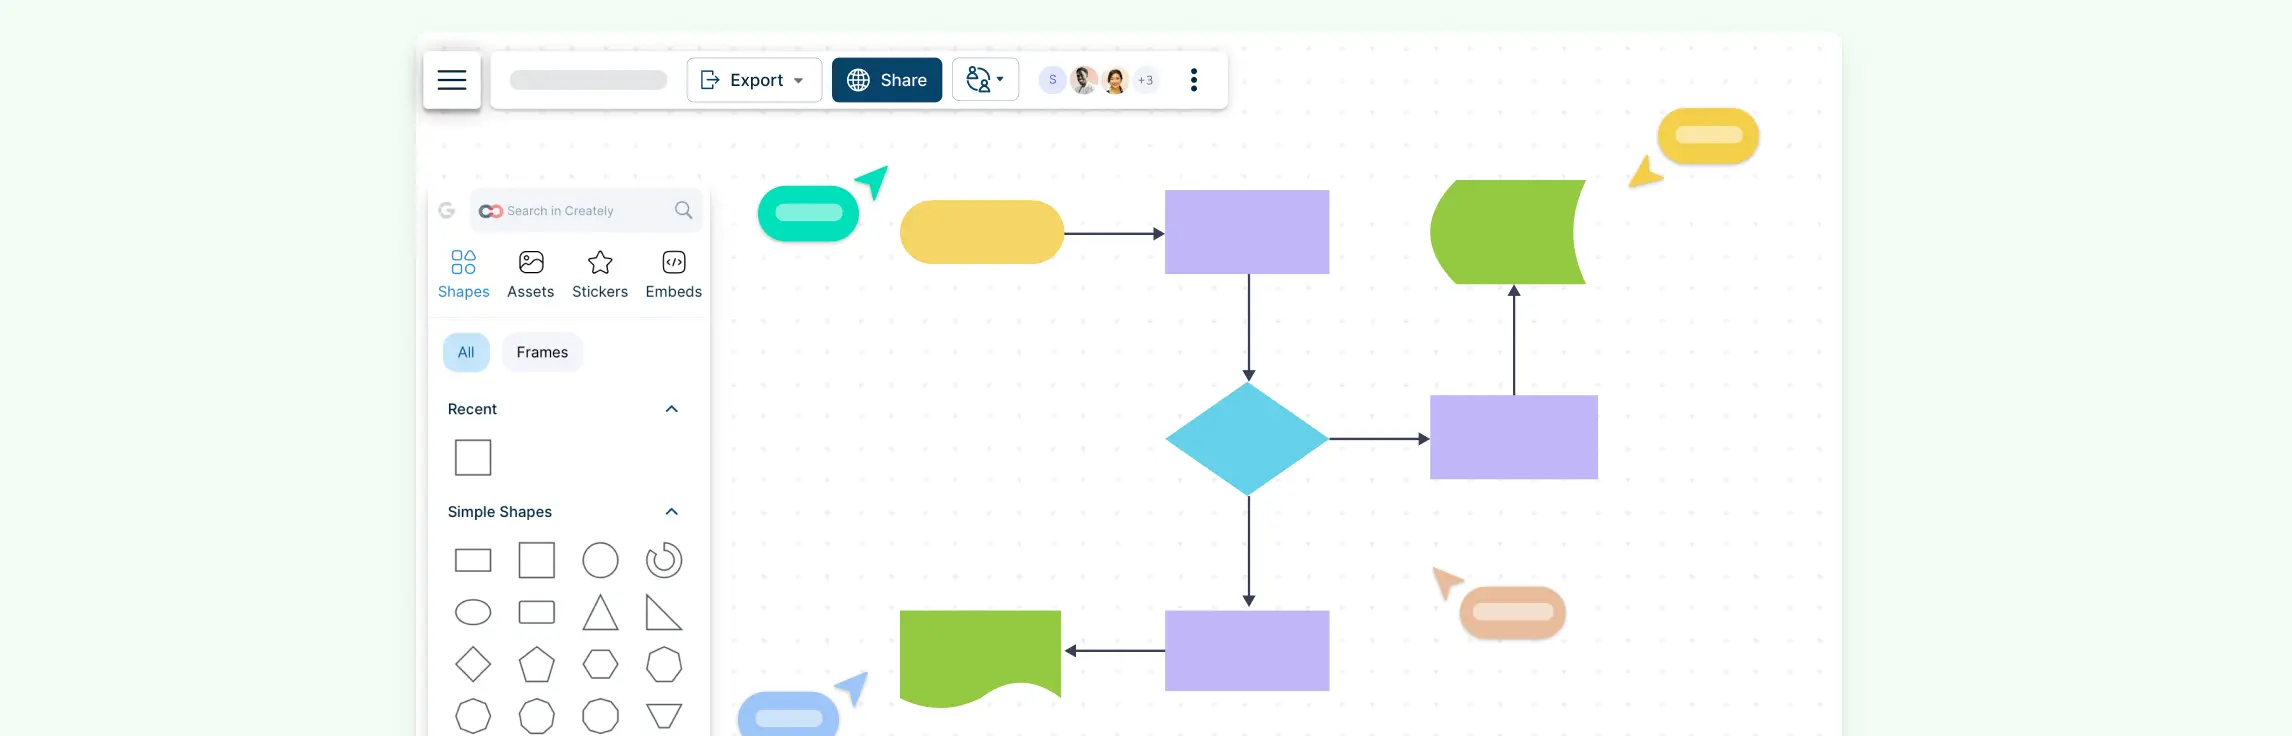
1. Intuitive drag-and-drop interface
Creately offers a simple, drag-and-drop interface that lets you quickly add and arrange shapes and connectors to design any type of flowchart. You don’t need any technical experience—just drag the components you need and connect them to create your process map.
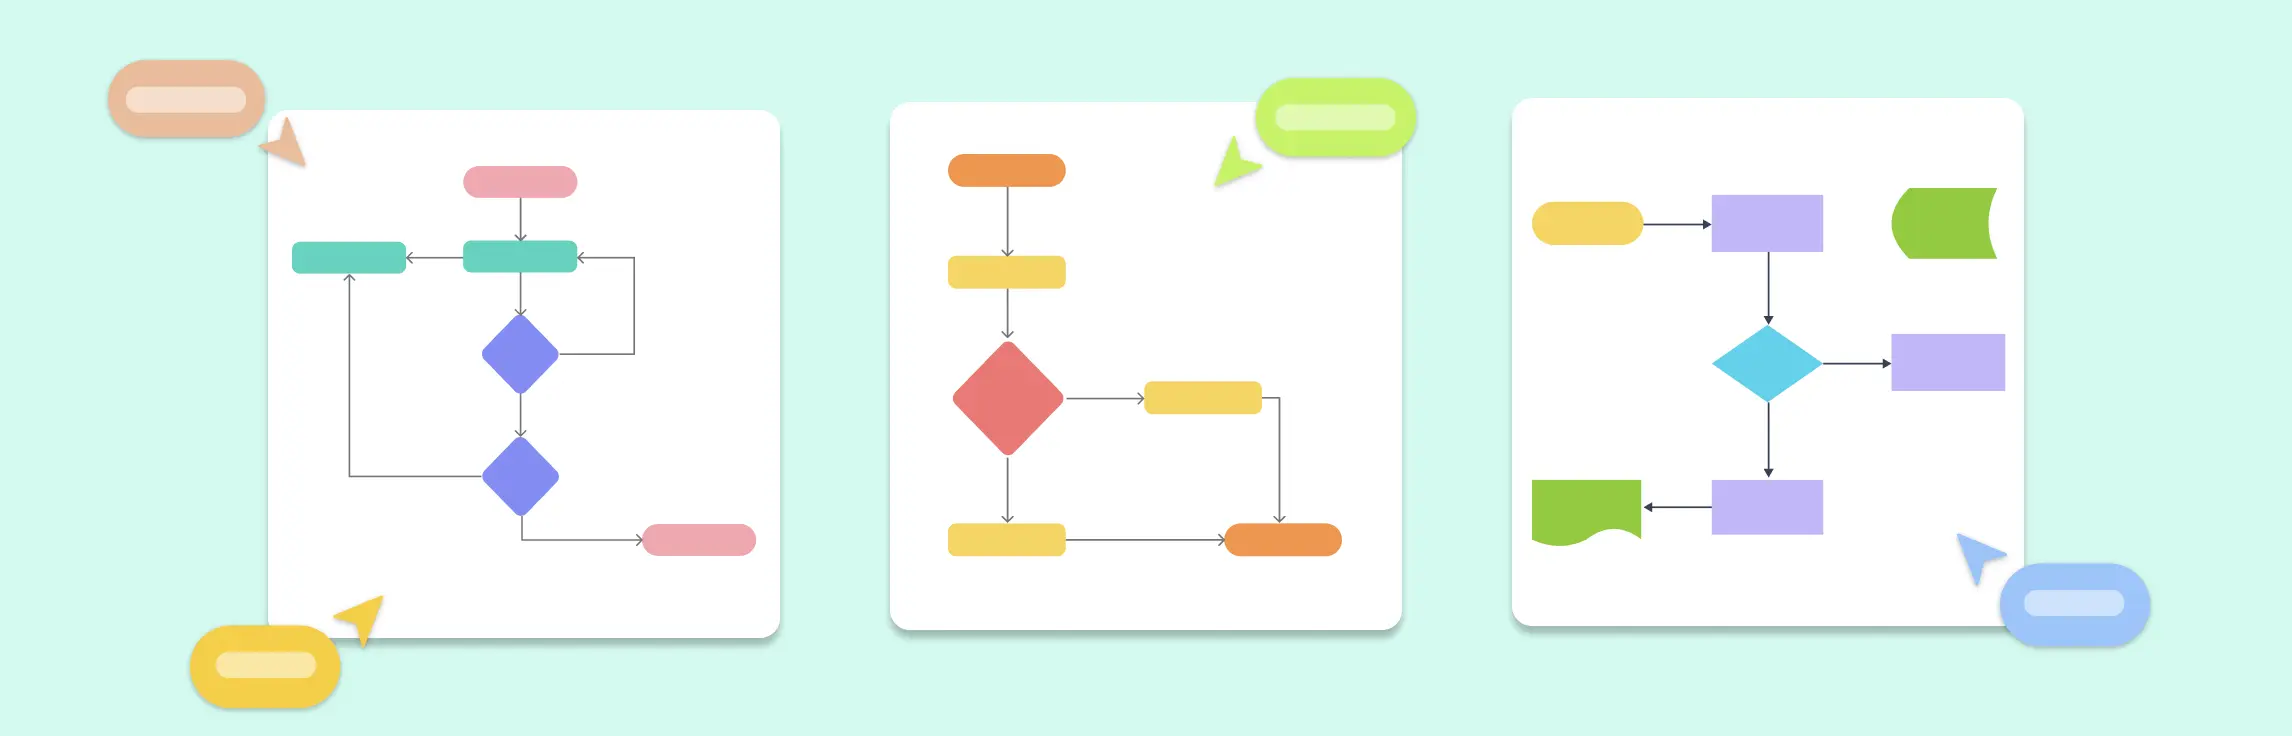
2. Extensive library of templates
With Creately, you have access to a wide variety of pre-designed flowchart templates that you can customize for your needs. These templates cover various industries and use cases, such as business processes, software design, and decision-making, and many types of flowcharts, making it easy to get started quickly.
3. Industry-standard shape libraries
Creately provides industry-standard shape libraries that are tailored for different types of flowcharts, including process flow diagrams, data flow diagrams, and swimlane flowcharts. These shapes follow the correct symbols and notations, ensuring your flowcharts are accurate and professional.
4. Real-time collaboration
One of the standout features of Creately is its real-time collaboration functionality. Multiple team members can work on the same flowchart simultaneously, making it easier to gather feedback, make edits, and brainstorm ideas together. This feature is especially useful for remote teams.
5. AI-powered features
Creately VIZ is an AI tool that helps you create AI flowcharts quickly and easily. It automatically adjusts the layout of your diagram to make it clear and organized. With just a command, you can generate flowcharts, and the AI will suggest new steps and help expand your ideas. It also turns idea boards and discussions into structured flowcharts, saving you time and effort. Creately VIZ makes flowchart creation faster and easier by automating tasks.
6. Presentation mode
Creately’s presentation mode allows you to present your flowchart directly from the tool, making it ideal for meetings, reviews, or sharing your flowchart with stakeholders. You can zoom in on specific areas and present your work without needing to export it to another tool.
7. Comprehensive symbol support
Creately includes a vast library of flowchart symbols, each designed to represent specific actions, decisions, or processes. This ensures that you can accurately map out complex systems, from decision trees to full process flows, using the appropriate symbols for each step in your process.
8. Documentation features
Creately makes it easy to document your flowcharts with built-in documentation per item and comment features. You can add detailed descriptions, explanations, and instructions directly on the flowchart, making it more informative and easier for team members to follow. Additionally, the ability to export flowcharts as PDFs or images ensures you can share your work effectively.
9. Integration with popular platforms
Creately integrates seamlessly with popular collaboration and storage platforms like Slack, Confluence, Google Drive, and Microsoft Teams. This makes it easier to incorporate your flowcharts into your existing workflow and share them across various platforms.
Conclusion: Types of Flowcharts
Understanding the different types of flowcharts can help you visualize and organize your processes more effectively. Whether you’re working on a simple task, designing complex systems, or mapping out user experiences, there’s a flowchart type that fits your needs. Each one serves a unique purpose, making it easier to communicate ideas, improve workflows, and identify potential issues.
By selecting the right type of flowchart, you can simplify complex information, streamline processes, and enhance decision-making. With the templates and tools available, creating flowcharts has never been easier.
We hope this guide helps you get started with using the right types of flowcharts to improve your work and communication. Explore and experiment with different flowcharts to see how they can make your processes clearer and more efficient.
Helpful Resources
Design clear system flowcharts to map data flow, system components, and workflows for better planning, troubleshooting, and documentation.
Create cross-functional flowcharts with swimlanes to show roles, responsibilities, and handoffs clearly across teams and departments.
Plan your website structure with visual sitemap-style flowcharts to organize pages, improve navigation, and streamline web development.
Build process flowcharts to document workflows, improve efficiency, and standardize steps for smoother business operations.
References
Kimber, O., Cromley, J.G. and Molnar-Kimber, K.L. (2018). Let your ideas flow: Using flowcharts to convey methods and implications of the results in laboratory exercises, articles, posters, and slide presentations. Journal of Microbiology & Biology Education, [online] 19(1). doi:https://doi.org/10.1128/jmbe.v19i1.1477.
Nabeel Allawi (2020). What is the FlowChart. [online] ResearchGate. Available at: https://www.researchgate.net/publication/342572223_What_is_the_FlowChart.
Ensmenger, N. (2016). The Multiple Meanings of a Flowchart. Information & Culture, [online] 51(3), pp.321–351. doi:https://doi.org/10.2307/44667617.
FAQs About Types of Flowcharts
What is a flowchart and why should I use one?
How do I know which type of flowchart to use?
What are the benefits of using flowcharts?
What is the difference between BPMN and flowchart?
What is the difference between a process flowchart and a workflow diagram?