A RASIC chart is a responsibility assignment matrix that shows who completes, approves, supports, is informed about, and is consulted on each task or decision. It helps teams make ownership and handoffs visible before work begins.
This guide explains the five RASIC roles, how to create and maintain the chart, and when to use RASIC instead of RACI. It also includes practical examples and editable templates.
What Is a RASIC Chart?
A RASIC chart organizes project tasks or decisions against the people involved in them. Teams use it to clarify who performs the work, who makes the final decision, who provides hands-on support, whose input is required, and who needs updates.
In this guide, RASIC stands for Responsible, Approver, Supportive, Informed, and Consulted. Terminology varies: many RASCI frameworks and RACI matrices use Accountable for A. Define what A means in your organization before assigning roles, then use that definition consistently.
The chart provides a shared reference for questions such as “Who completes this?” and “Who gives final approval?” It can expose unclear ownership, missing support, and unnecessarily broad consultation before these issues delay the work.
RASIC Chart Components
Let’s break down what each letter in RASIC stands for and what it means in practice:
1. R – Responsible
This is the person (or people) who are actively working on the task. They’re the ones doing the work and getting things done. There can be more than one responsible person, but it’s best to keep it limited to avoid overlaps.
Example: If the task is writing a report, the responsible person might be the content writer.
2. A – Approver
The approver has the final say on whether the task or decision is good to go. They review the work, provide feedback, and give the green light. There’s typically only one approver to keep things clear and avoid delays in decision-making.
Example: If it’s a report, the approver could be the team manager or project lead who signs off on it before submission.
3. S – Supportive
The supportive role includes people who assist the responsible person in completing the task. They provide resources, expertise, or guidance as needed. Supportive team members don’t do the main work, but their help is essential for completing the task successfully.
Example: If the task is launching a product, the supportive role might include the graphic designer creating visuals or the IT team setting up the tech.
4. I – Informed
These are the people who need to be kept in the loop about progress or outcomes. They don’t contribute directly but need to stay updated. Keeping the right people informed ensures transparency without overwhelming them with unnecessary details.
Example: In a report task, the informed might include other departments who rely on the report’s findings.
5. C – Consulted
The consulted role includes people whose input is needed before a task or decision is finalized. They offer expertise, feedback, or opinions. Consulted individuals help improve the quality of decisions, but they don’t have the final say.
Example: For a report, the consulted role could include subject matter experts or analysts who provide data or insights.
How to Create a RASIC Chart
Creating a RASIC chart is a straightforward process, but it’s also a thoughtful one. The goal is to bring clarity to roles and tasks, not add unnecessary complexity. By taking it step by step, you’ll set up a clear structure that helps everyone know exactly what’s expected of them. Here’s how to do it:
Step 1: Identify the tasks and deliverables
Start by listing all the tasks, actions, or deliverables in your project. This is the “what” that needs to get done. A clear, detailed list ensures you don’t miss anything. It’s the foundation for assigning roles later.
Break the project into smaller steps. Think about every major task, decision, or milestone required to complete the project successfully.
Example: If you’re launching a marketing campaign, your tasks might include:
- Creating campaign content
- Designing visuals
- Getting stakeholder approval
- Scheduling posts
- Monitoring results
Step 2: List all the team members and stakeholders
Now that you know the tasks, it’s time to list who’s involved in the project. Write down everyone’s name, role, and expertise. Knowing who’s on your team will help you match the right people to the right responsibilities.
This includes:
- Team members working on the project.
- Managers or leaders who oversee progress.
- Anyone outside the team who needs to provide input, support, or approvals.
Example:
- Content writer
- Graphic designer
- Project manager
- Marketing lead
- Analytics team
Step 3: Assign the RASIC roles to each task
Next, assign the appropriate RASIC role to each person involved in a task. Ask:
- Who’s responsible? Who will do the work?
- Who’s the approver? Who will review and give the final approval?
- Who’s supportive? Who will help or provide resources?
- Who needs to be informed? Who should stay updated on progress?
- Who should be consulted? Whose input or expertise do we need?
Use a table or spreadsheet to organize the chart. Write the tasks down the left side and list team members across the top. For each task, assign the appropriate role (R, A, S, I, or C) to each person.
| Task | Alice | Bob | Charlie | Diana | Eve |
|---|---|---|---|---|---|
| Create campaign content | R | S | I | ||
| Design campaign visuals | R | S | |||
| Approve campaign assets | A | I | |||
| Schedule posts | R | S | |||
| Monitor campaign results | R | S | I |
The completed matrix gives the team a shared reference for who handles the work and who approves it.
Step 4: Review and refine the chart
Once you’ve assigned all the roles, take a moment to review the chart. Share it with your team to make sure everything makes sense.
Ask questions like:
- Does everyone understand their role?
- Are there too many people assigned to a task?
- Is there only one approver for each task to avoid delays?
For example, if two people are listed as approvers for the same task, that could cause confusion. The review helps catch these issues early so you can fix them.
Step 5: Share the finalized chart
Finally, share the chart with everyone involved in the project. Make sure it’s easy for the team to access and refer to whenever they need it.
For example, you can post it in your project management tool, send it via email, or even print it out if your team works in person. Walk the team through it so they understand how it works and how it will keep the project running smoothly.
RASIC Chart Example
To see how a RASIC chart works in real life, let’s use an example of a website redesign project. In this project, different team members contribute in specific ways, and the RASIC chart helps clarify who does what.
Scenario: Website Redesign Project
The company is launching a refreshed website. The main tasks include updating the design, improving functionality, and creating new content. Here’s how roles are mapped using the RASIC chart:
| Task | Responsible (R) | Approver (A) | Supportive (S) | Consulted (C) | Informed (I) |
|---|---|---|---|---|---|
| Define project scope | Project Manager | CEO | Team Leads | Clients, Stakeholders | Marketing Team |
| Design website layout | UI/UX Designer | Design Lead | Graphic Designer | Marketing Manager | Project Manager |
| Develop website | Developers | Tech Lead | QA Tester | UI/UX Designer | Team Leads |
| Create website content | Content Writer | Marketing Lead | SEO Specialist | Design Lead, Stakeholders | Project Manager |
| Test and QA website | QA Tester | Tech Lead | Developers | Project Manager | Marketing Team |
| Launch website | Project Manager | CEO | Developers, Designers | Marketing Lead | Entire Company |
How to read the chart:
- Responsible (R): The person who does the work.
- Example: The UI/UX Designer creates the website layout.
- Approver (A): The person who makes the final decision.
- Example: The CEO approves the project scope and gives the green light for the website launch.
- Supportive (S): The person(s) who actively assists with the task.
- Example: For testing, Developers provide fixes while the QA Tester runs checks.
- Consulted (C): Experts or stakeholders who provide input.
- Example: The Marketing Manager consults on the website layout to ensure it aligns with branding.
- Informed (I): People who are kept updated on progress.
- Example: The Entire Company is informed when the website is launched.
In a website redesign, the RASIC chart makes responsibilities and decision points easier to see. It can reveal missing owners or overlapping assignments, but it should complement—not replace—a project schedule and task-tracking process.
RASIC Chart Templates
RASIC chart templates make it easy to organize team responsibilities for any project. With these ready-made layouts, you can quickly assign tasks and roles without starting from scratch. They help keep everyone clear, aligned, and working together smoothly.
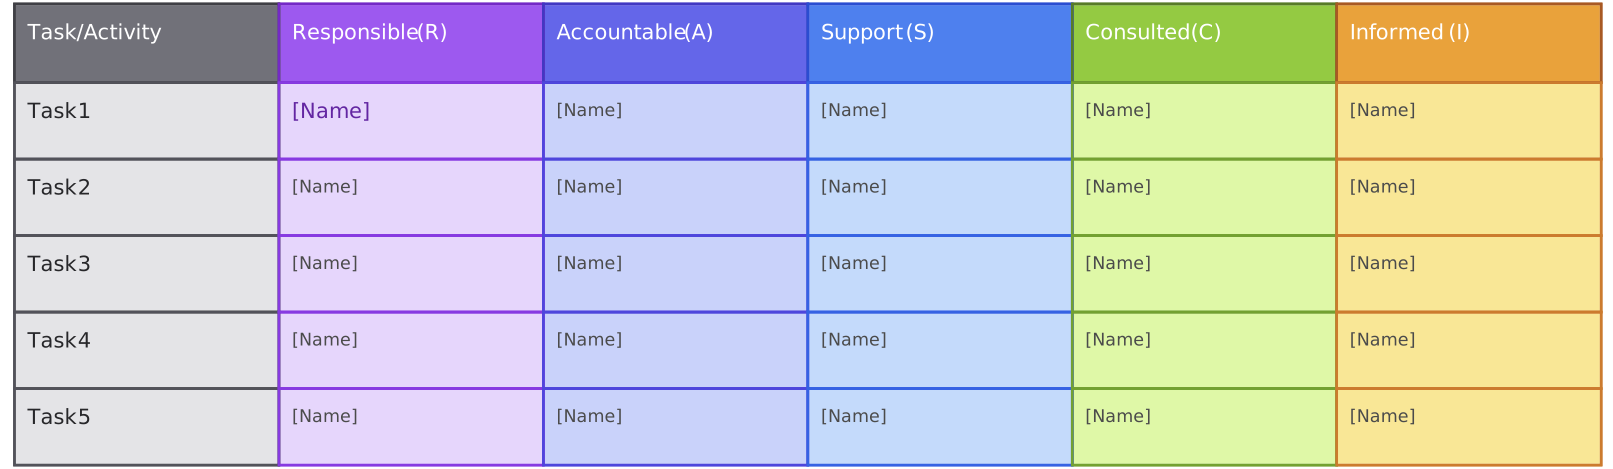
RASIC Chart Template for Project
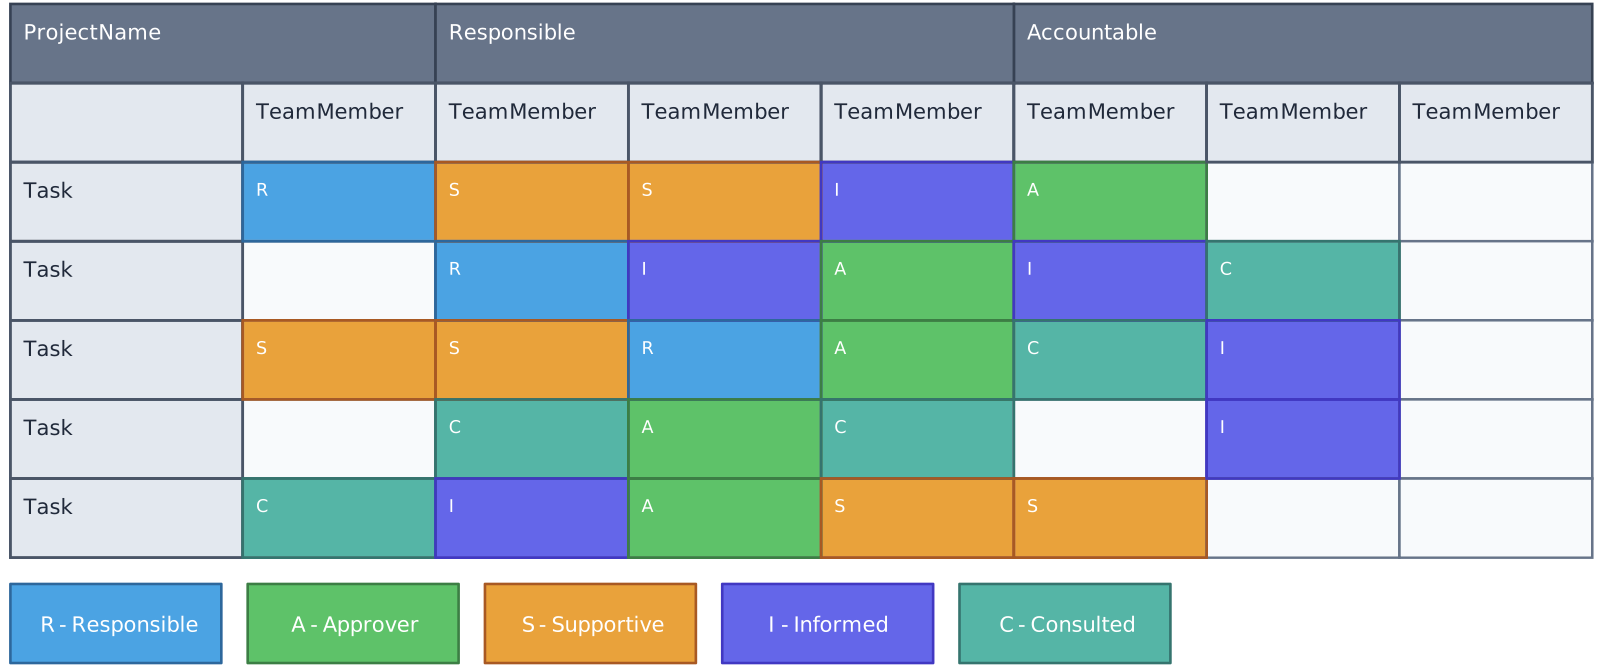

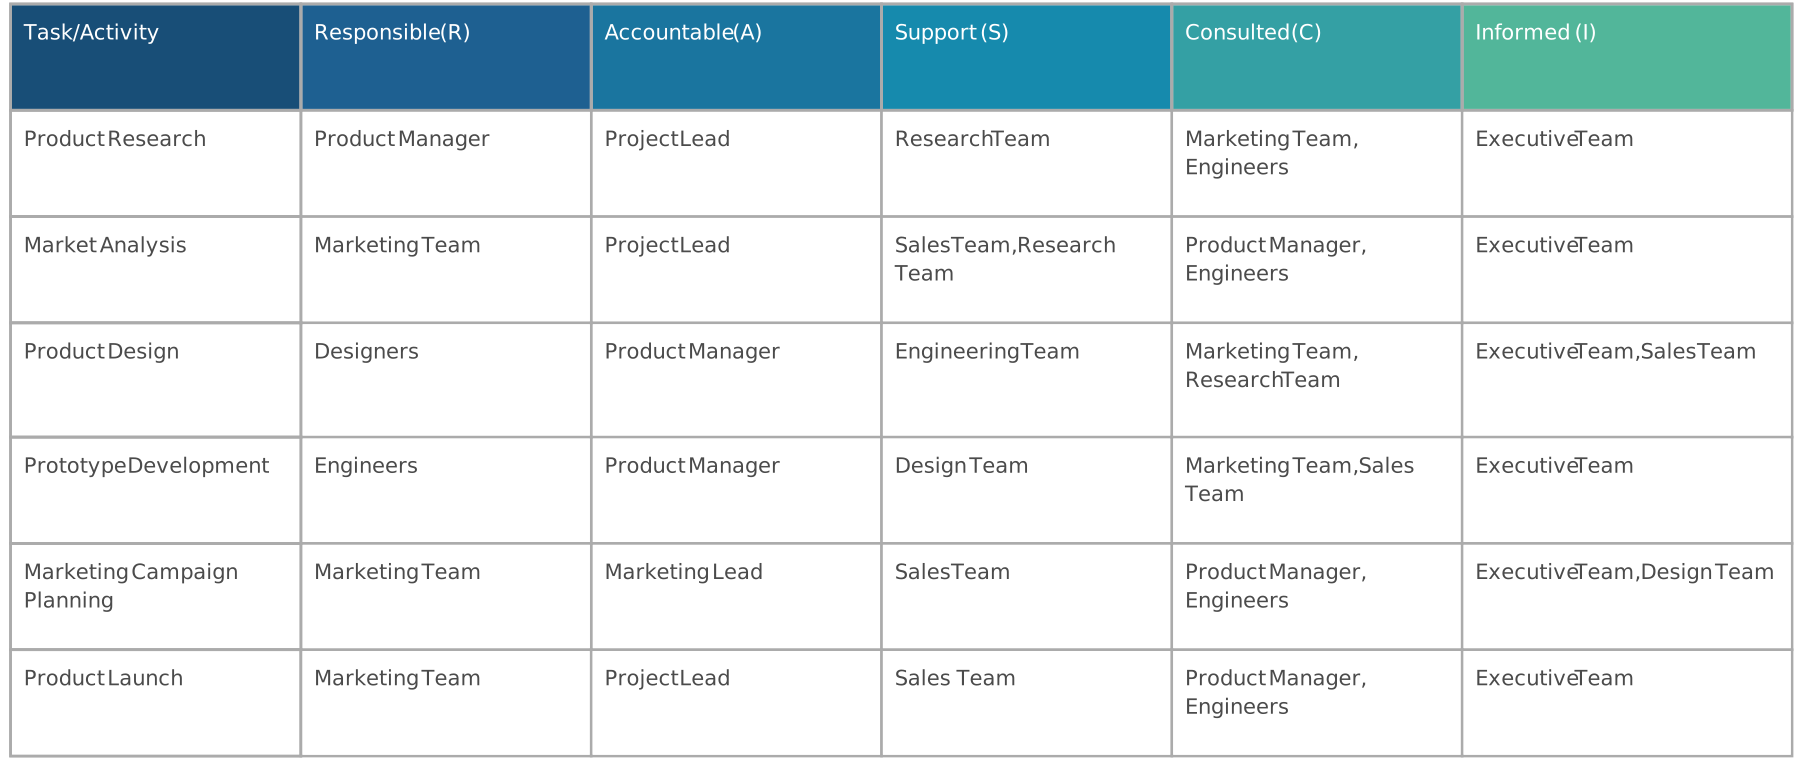
RASIC Matrix Template for Project Planning
RASIC Chart for Product Launch
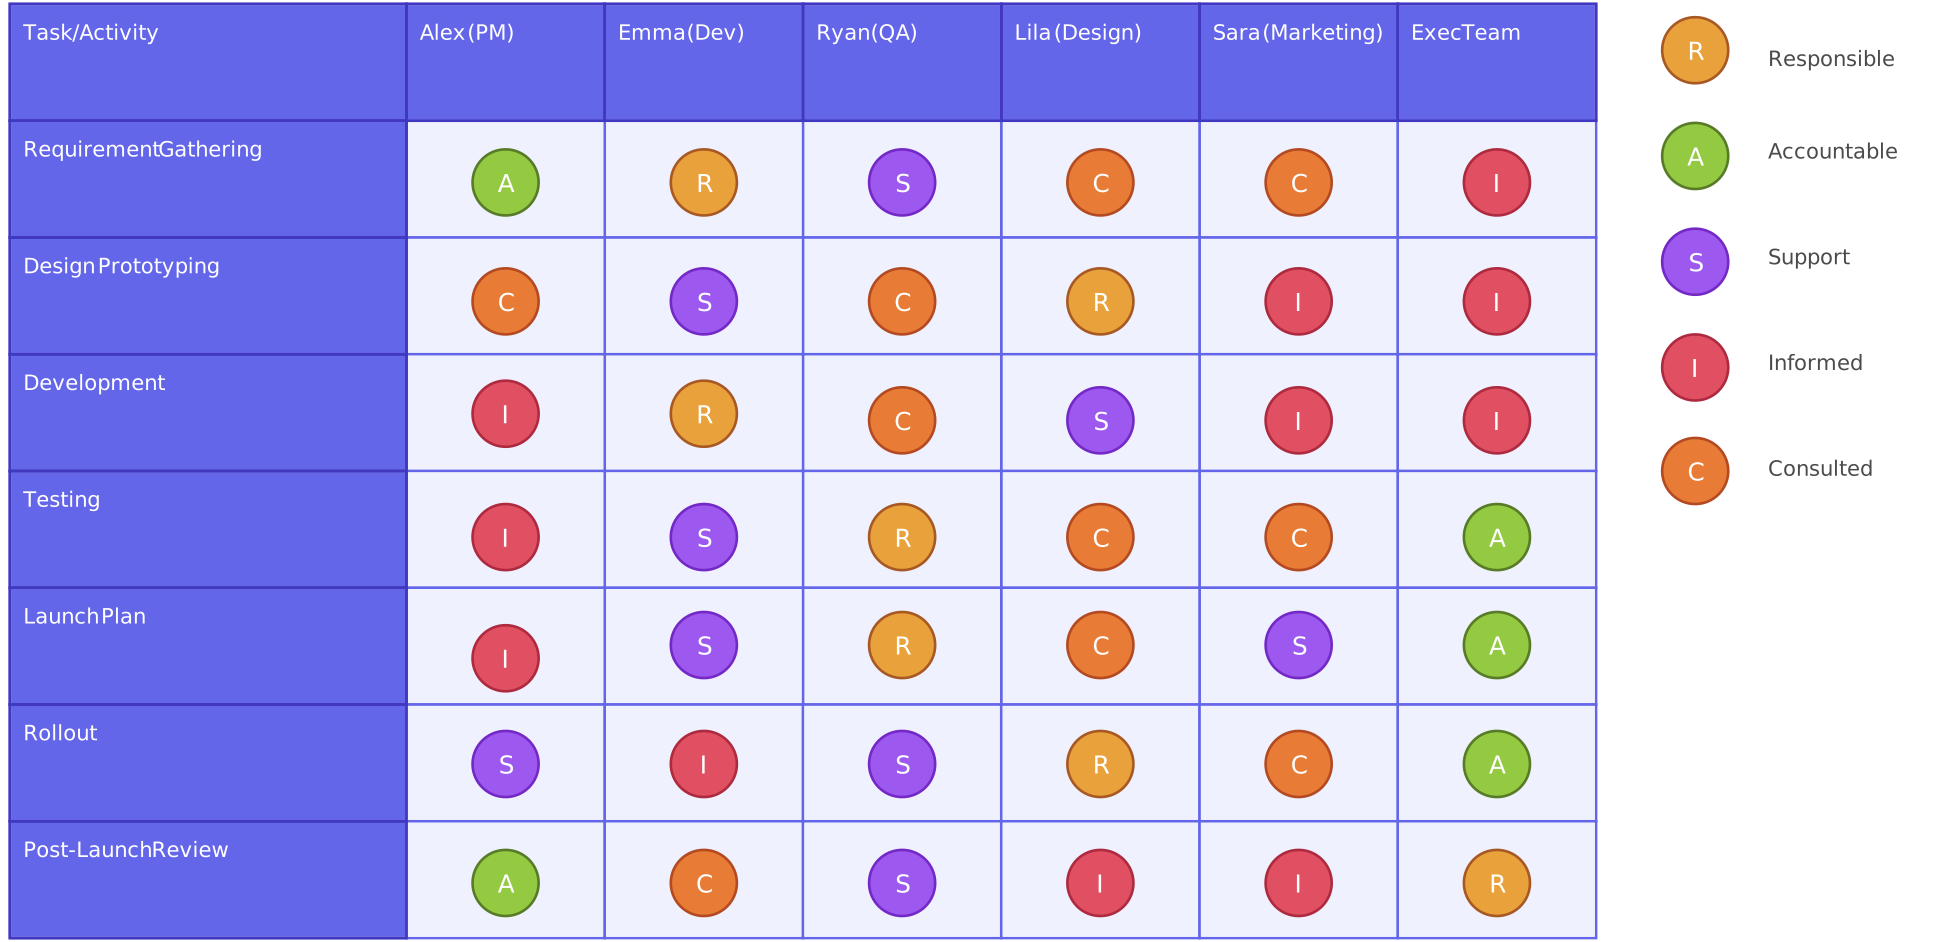
RASIC Chart for Software Update Rollout
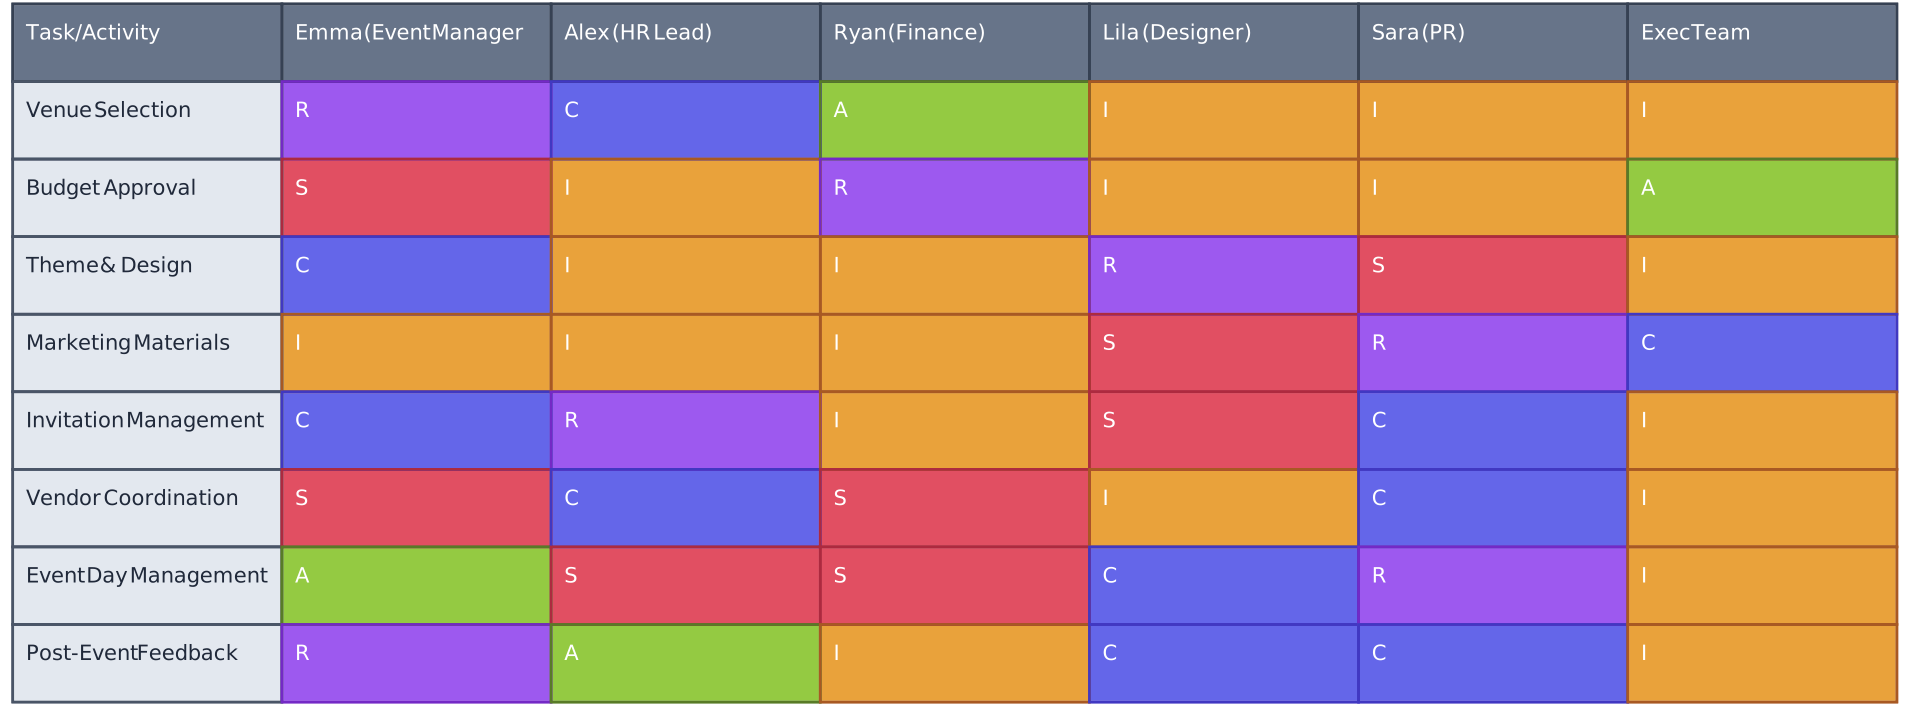
Event Planning RASIC Matrix Example
When to Use a RASIC Chart
A RASIC chart is most useful when a project involves multiple people, overlapping tasks, or complex workflows. It helps bring clarity to who’s doing what, especially when confusion or missed responsibilities can cause delays. Here are the situations when a RASIC chart becomes your best friend:
- When roles and responsibilities are unclear: If team members keep asking, “Is this my task, or yours?” or decisions get stuck because no one knows who has final approval, it’s a clear sign that a RASIC chart can help. It eliminates guesswork and makes responsibilities crystal clear.
- For projects with many tasks and stakeholders: When there are lots of moving parts—like a product launch, construction project, or system rollout—assigning roles keeps everything organized. Each task will have specific people assigned to it, which avoids overlaps and ensures nothing gets missed.
- When working with cross-functional teams: Teams with different expertise often work together on a single project. A RASIC chart helps clarify how these teams interact—for example, which team provides input, who makes decisions, and who’s kept updated.
- To improve accountability: If you notice that deadlines are slipping or tasks are incomplete, a RASIC chart can highlight who is responsible. It creates ownership, so everyone knows their part and feels accountable for completing it.
- When approvals are slowing things down: In projects where sign-offs are critical—like marketing campaigns, software updates, or legal reviews—it’s important to know exactly who approves the work. A RASIC chart avoids delays caused by unclear decision-makers.
Who Can Use a RASIC Chart?
One of the best things about a RASIC chart is that it’s flexible—it can work for anyone, in any team or industry. Whether you’re managing a large team, working on a small project, or coordinating with external stakeholders, the RASIC chart brings clarity to the process. Here’s a look at who can benefit the most:
- Project managers: Project managers use RASIC charts to define roles, streamline workflows, and ensure that every task has clear ownership. It’s an essential tool for organizing team members and keeping projects on track.
- Team leaders: Whether you’re leading a marketing, software development, or operations team, a RASIC chart helps you delegate tasks effectively and avoid confusion.
- Cross-functional teams: When teams with different specialties (like design, development, and content) collaborate, a RASIC chart prevents tasks from slipping through the cracks. Everyone knows their responsibilities and when to consult each other.
- Business executives and decision-makers: Leaders overseeing high-level projects can use RASIC charts to set expectations and track accountability without getting lost in the details.
- Small businesses and startups: In smaller teams where people often wear multiple hats, a RASIC chart helps clarify who owns each task. This prevents misunderstandings, especially when team members juggle different roles.
- Consultants and freelancers: If you work with clients or external teams, a RASIC chart can clearly outline roles and approvals to keep collaboration smooth. It ensures everyone is aligned from the start.
- Anyone managing complex projects: Whether it’s organizing a product launch, building a new website, or handling an event, anyone juggling multiple people and tasks can benefit from a RASIC chart.
Benefits of Using a RASIC Chart
A RASIC chart brings clarity, structure, and accountability to your team’s work. It’s more than just a project management tool—it’s a practical way to help teams collaborate effectively and avoid confusion. Here’s how it makes a real difference:
1. Eliminates confusion about roles and responsibilities
One of the biggest challenges in any project is knowing who’s doing what. Without clear roles, people often hesitate to take action, duplicate work, or miss tasks altogether. A RASIC chart removes that uncertainty.
For example, instead of two team members thinking they’re both responsible for approving a document, the chart makes it clear that only one person has the “approver” role. This way, decisions happen faster, and work flows smoothly.
2. Improves accountability
When roles are defined in a RASIC chart, every team member knows exactly what they’re responsible for. It’s no longer possible to say, “Oh, I thought someone else was handling that.”
If a deliverable is delayed, it’s easier to pinpoint where the bottleneck happened and resolve it. Accountability doesn’t mean blaming—it means creating ownership. People are more likely to step up and follow through when they see their role clearly laid out.
3. Simplifies decision-making
In many projects, decisions get stuck because no one knows who has the final say. With a RASIC chart, the “approver” role ensures there’s always a clear decision-maker for every task.
For instance, if a design needs approval before it’s shared with a client, the RASIC chart shows exactly who’s responsible for giving the green light. This cuts out unnecessary back-and-forth and keeps the project moving forward.
4. Prevents role overlap and duplication
When people step on each other’s toes by working on the same task, it can waste time and effort. A RASIC chart makes it clear who’s responsible for doing the work and who’s there to support or provide input.
For example, in a software development project, the developer might be responsible for coding a new feature, while the tester is consulted to give input during quality checks. This way, tasks are handled efficiently, and there’s no unnecessary overlap.
5. Enhances team collaboration
By clearly defining roles, a RASIC chart helps teams work together more effectively. Everyone knows when to step in, when to provide input, and when to stay informed. This reduces miscommunication and creates a smoother workflow.
For instance, a marketing team working on a campaign might have a content writer responsible for drafting the copy, a designer supportive for visuals, and the manager approving the final output. With everyone aligned, collaboration feels natural and productive.
6. Helps manage complex projects
The more tasks and stakeholders you have, the harder it is to keep everything organized. A RASIC chart brings order to even the most complicated projects by breaking tasks down and assigning roles.
For example, in a product launch with multiple phases—like research, content creation, design, and testing—a RASIC chart ensures that every step has clear owners. It turns chaos into a clear, manageable process.
7. Saves time and reduces delays
Clear roles can reduce time spent identifying who should act, provide input, or approve the work. A RASIC chart cannot prevent every delay, but it can help teams address ownership-related bottlenecks sooner.
For example, knowing exactly who needs to be consulted for input and who will give the final sign-off ensures that work keeps moving without unnecessary roadblocks.
RASIC vs RACI: Key Differences
A RASIC chart and a RACI matrix both clarify roles and responsibilities. RACI uses Responsible, Accountable, Consulted, and Informed. RASIC adds a Supportive role; in this guide’s convention, A is the Approver. Because organizations use these labels differently, document your chosen definitions before adopting either matrix.
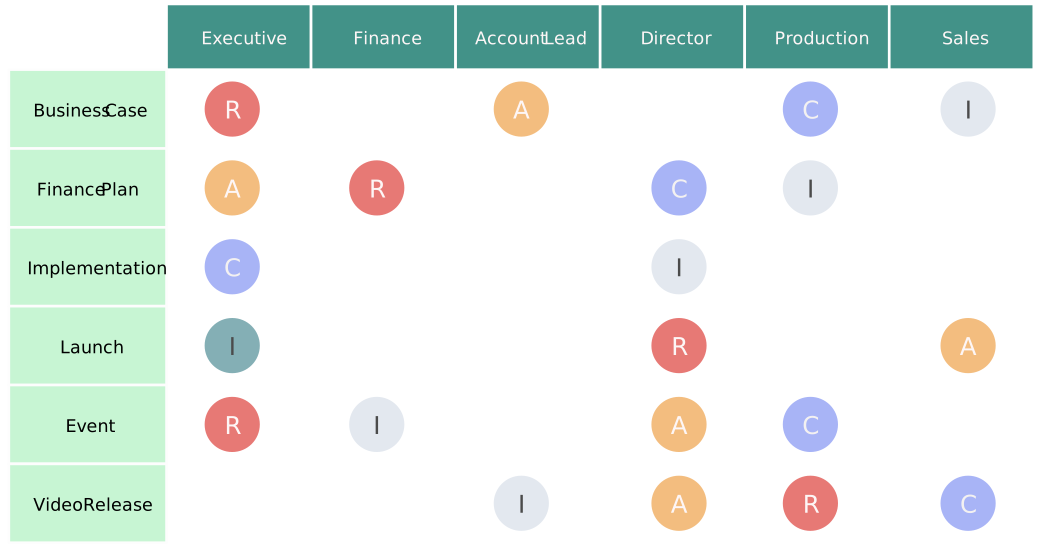
What’s the difference between RASIC and RACI?
Both charts use similar letters to define roles, but RASIC includes an extra “S” for Supportive. Here’s a side-by-side comparison to make it clearer:
| Role | RACI | RASIC |
|---|---|---|
| R – Responsible | Person or people who do the work. | Person or people who do the work. |
| A – Accountable or Approver | Accountable person who owns the outcome. | Approver who makes the final decision in this guide’s convention. |
| C – Consulted | People who provide input or expertise. | People who provide input or expertise. |
| I – Informed | People kept updated on progress or decisions. | People kept updated on progress or decisions. |
| S – Supportive | Not a separate RACI role. | People who provide hands-on help or resources. |
What does the extra “S” (Supportive) mean?
In RASIC, the “Supportive” role highlights people who actively assist the “Responsible” person in completing a task. They don’t lead the task, but they provide hands-on help or resources.
For example:
- In a content creation task, the content writer is Responsible, while a designer providing visuals could be Supportive.
- In software development, a developer may be Responsible for coding, and a tester might be Supportive, helping identify bugs.
In RACI, this “Supportive” role isn’t explicitly listed. It’s often assumed or overlooked, which can cause gaps in understanding who is providing practical help.
Why does this matter?
The “Supportive” role in RASIC adds clarity, especially for teams with multiple contributors. By calling out those who help, you ensure everyone knows their place and what’s expected of them. It prevents miscommunication like:
- “I didn’t know I was supposed to help with this.”
- “I thought you were handling that part!”
The extra “S” keeps teamwork smooth and avoids misunderstandings about who’s providing hands-on support.
When to use RACI vs. RASIC?
Here’s when each chart works best:
Choose RACI if:
- You need a simpler chart for small or straightforward projects.
- Tasks are clear, and the team doesn’t need to highlight who is assisting.
- There’s no confusion about who is helping the “Responsible” person.
For example, in a small team creating a presentation, you might not need to list “Supportive” roles. You’ll likely focus only on who’s creating the content (Responsible), who approves it (Approver), and who provides feedback (Consulted).
Choose RASIC if:
- The project is complex and involves multiple contributors assisting with tasks.
- Roles tend to overlap, and you want to clarify who is actively helping.
- You want to emphasize teamwork and resource-sharing.
For example, in a product development project, designers, developers, and quality testers may all support each other. RASIC highlights these “Supportive” roles to ensure no one’s help goes unnoticed.
Best Practices for Using RASIC Charts
A RASIC chart is a simple tool, but using it effectively takes thought and care. It’s not just about filling out roles—it’s about making the chart work for your team so everyone’s aligned and the project runs smoothly. Here are the best practices to follow for getting the most out of a RASIC chart:
1. Keep it clear and simple
A RASIC chart should clarify roles, not make things more confusing. Use simple language, avoid jargon, and make sure everyone understands what each role means—Responsible, Approver, Supportive, Consulted, and Informed.
2. Involve your team in building the chart
A RASIC chart works best when it reflects how the team actually works—not how you think they should work. Bring your team together when you’re assigning roles. They’ll know better where their responsibilities lie and where support might be needed.
3. Focus on balance—avoid overloading roles
One person shouldn’t be Responsible for everything, and not everyone needs to be Consulted for every decision. A RASIC chart is meant to streamline work, not create bottlenecks. Look for balance:
- Make sure tasks are spread evenly across team members.
- Use one Approver per task wherever practical to keep decision ownership clear.
- Avoid consulting too many people; only bring in those who truly add value.
4. Clearly define each role at the start
Roles like “Responsible” and “Supportive” can mean different things to different people. Before you create the chart, explain what each role means in your context.
For example:
- Responsible: The person who does the work and owns the task.
- Supportive: Someone who helps actively, such as providing data, feedback, or resources.
- Consulted: Experts or stakeholders who provide input before a decision is made.
- Informed: People who are updated on progress but not directly involved.
When everyone understands the roles, the chart becomes a shared language for your team.
5. Review and refine the chart regularly
A RASIC chart should change with the project. Review it at key milestones and whenever the scope, workflow, handoffs, or team changes.
6. Make the chart easy to access
Your RASIC chart should be visible and easy to find. Whether it’s in a shared document, project management tool, or displayed during meetings, ensure the team can reference it whenever needed.
7. Use it to identify gaps and overlaps
Before the project kicks off, review the chart for any missing roles or overlapping responsibilities. Are there tasks without clear ownership? Are two people assigned the same Approver role? Address these gaps to avoid problems later.
8. Communicate and align expectations
Once the chart is built, share it with everyone involved in the project. Use it to align expectations, so each team member knows their role, their contributions, and how they’ll interact with others.
9. Use it as a conflict resolution tool
If confusion arises about who is responsible for a task, refer to the agreed RASIC chart. If the chart no longer reflects the work, involve the affected stakeholders and update the assignment rather than treating it as a fixed authority.
How to Create a RASIC Chart with Creately
Creately gives teams a shared visual workspace for creating a RASIC matrix and viewing it alongside the workflow it supports. With Creately’s process mapping software, teams can clarify ownership and handoffs while keeping relevant process context connected to the work.
Start with a template or table: Use a RASIC template as a starting point, or create a custom matrix with a table. Add tasks down one axis and people or roles across the other, then mark each assignment with R, A, S, I, or C.
Map the workflow and its handoffs: Place the matrix beside a process map to compare role assignments with the actual sequence of work. This makes it easier to identify steps without a clear owner, decision-maker, or supporting role.
Keep supporting context connected: Add relevant notes, links, and files to the workspace so team members can refer to the instructions and source material associated with the process.
Review assignments together: Invite stakeholders to review the matrix on the shared canvas. Team members can collaborate in real time, use comments and mentions to provide contextual feedback, and revise assignments when responsibilities or handoffs change.
Document ownership clearly: Use the matrix to record who performs, approves, supports, is consulted on, and is informed about each activity. Where structured process properties are used, ownership and status details can provide additional context for the mapped process.
Maintain it as living process documentation: Revisit the RASIC chart during process reviews and after organizational or workflow changes. Keeping the matrix with the process documentation helps teams see the current agreed responsibilities. A RASIC chart records the intended approver; it does not replace a formal approval system where one is required.
Conclusion: Streamlining Teamwork with a RASIC Chart
A RASIC chart helps teams clarify who completes, approves, supports, is consulted on, and is informed about project work. Used well, it provides a practical reference for ownership, decisions, and cross-functional handoffs.
The chart is most useful when the team agrees on its role definitions, assigns one Approver per task where practical, and reviews the matrix when the work changes. It can reveal gaps and overlaps, but it still needs clear communication and regular maintenance.
Start with one of the templates above, adapt the roles to your organization’s convention, and validate the completed matrix with everyone involved in the process.
FAQs About the RASIC Chart
Can a person have more than one role in a RASIC chart?
How do I handle multiple people in the same role?
Can a RASIC chart be used for personal projects?
What if a task does not require one of the RASIC roles?
Is a RASIC chart the same as a responsibility matrix?
Can I use a RASIC chart for cross-functional teams?