Flowcharts and Gantt charts support different parts of project planning. A flowchart explains how work moves through steps, decisions, owners, and handoffs. A Gantt chart places project tasks on a timeline and shows dates, durations, milestones, progress, and dependencies. Project size or duration does not determine which one to use; the planning question does. Many teams use flowcharts to clarify process logic and Gantt charts to manage the schedule.
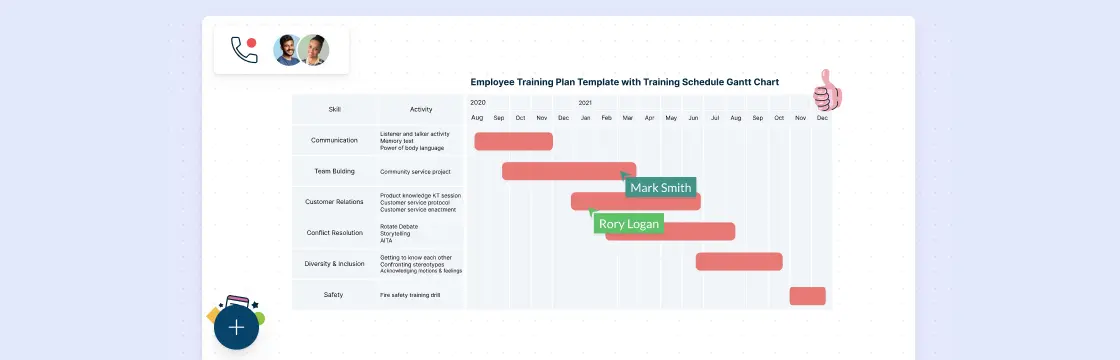
Creately’s flowchart software and Gantt chart maker let teams create both views in a shared workspace. Teams can assign owners, document handoffs, connect relevant notes, links, and files, and use comments and @mentions to review the plan. The project or process owner can then incorporate agreed changes and keep the visual documentation current.
Using Flowcharts for Project Planning
Flowcharts show the sequence and decision logic within a project workflow. They are useful for explaining what happens next, who owns each step, where work changes hands, and how alternate outcomes affect the path. Although labels can include dates or durations, a flowchart is not designed to manage a schedule against a time scale. A clear project flowchart should show:
- A clear beginning
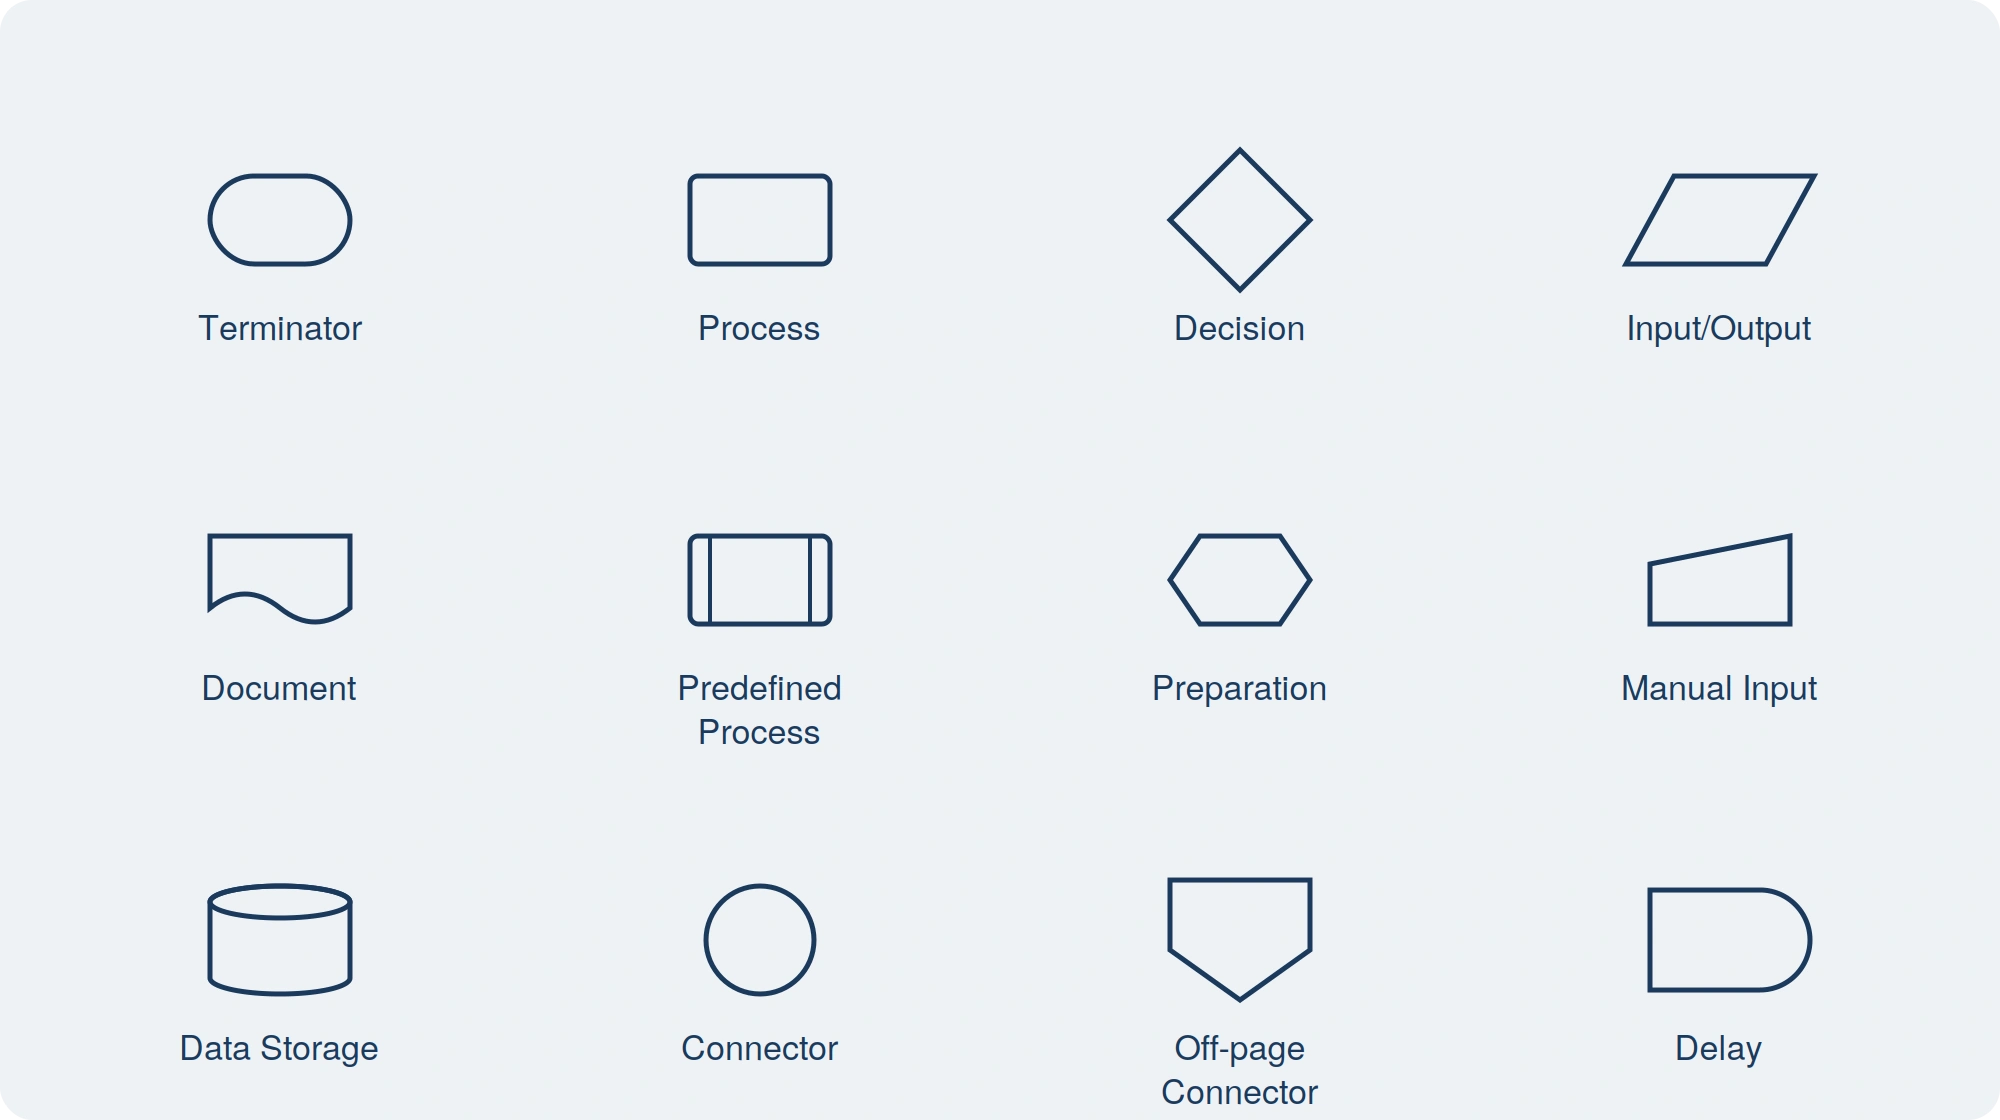
- Clearly labeled stages represented by rectangular boxes
- Diamond-shaped boxes for decisions or quality checks
- A clearly defined end
Arrows show the direction of flow. At a decision, label each outgoing path with its condition, such as yes and no, so readers can follow every outcome. You can create a simple project flowchart in Creately and use swimlanes when the workflow crosses roles or teams.
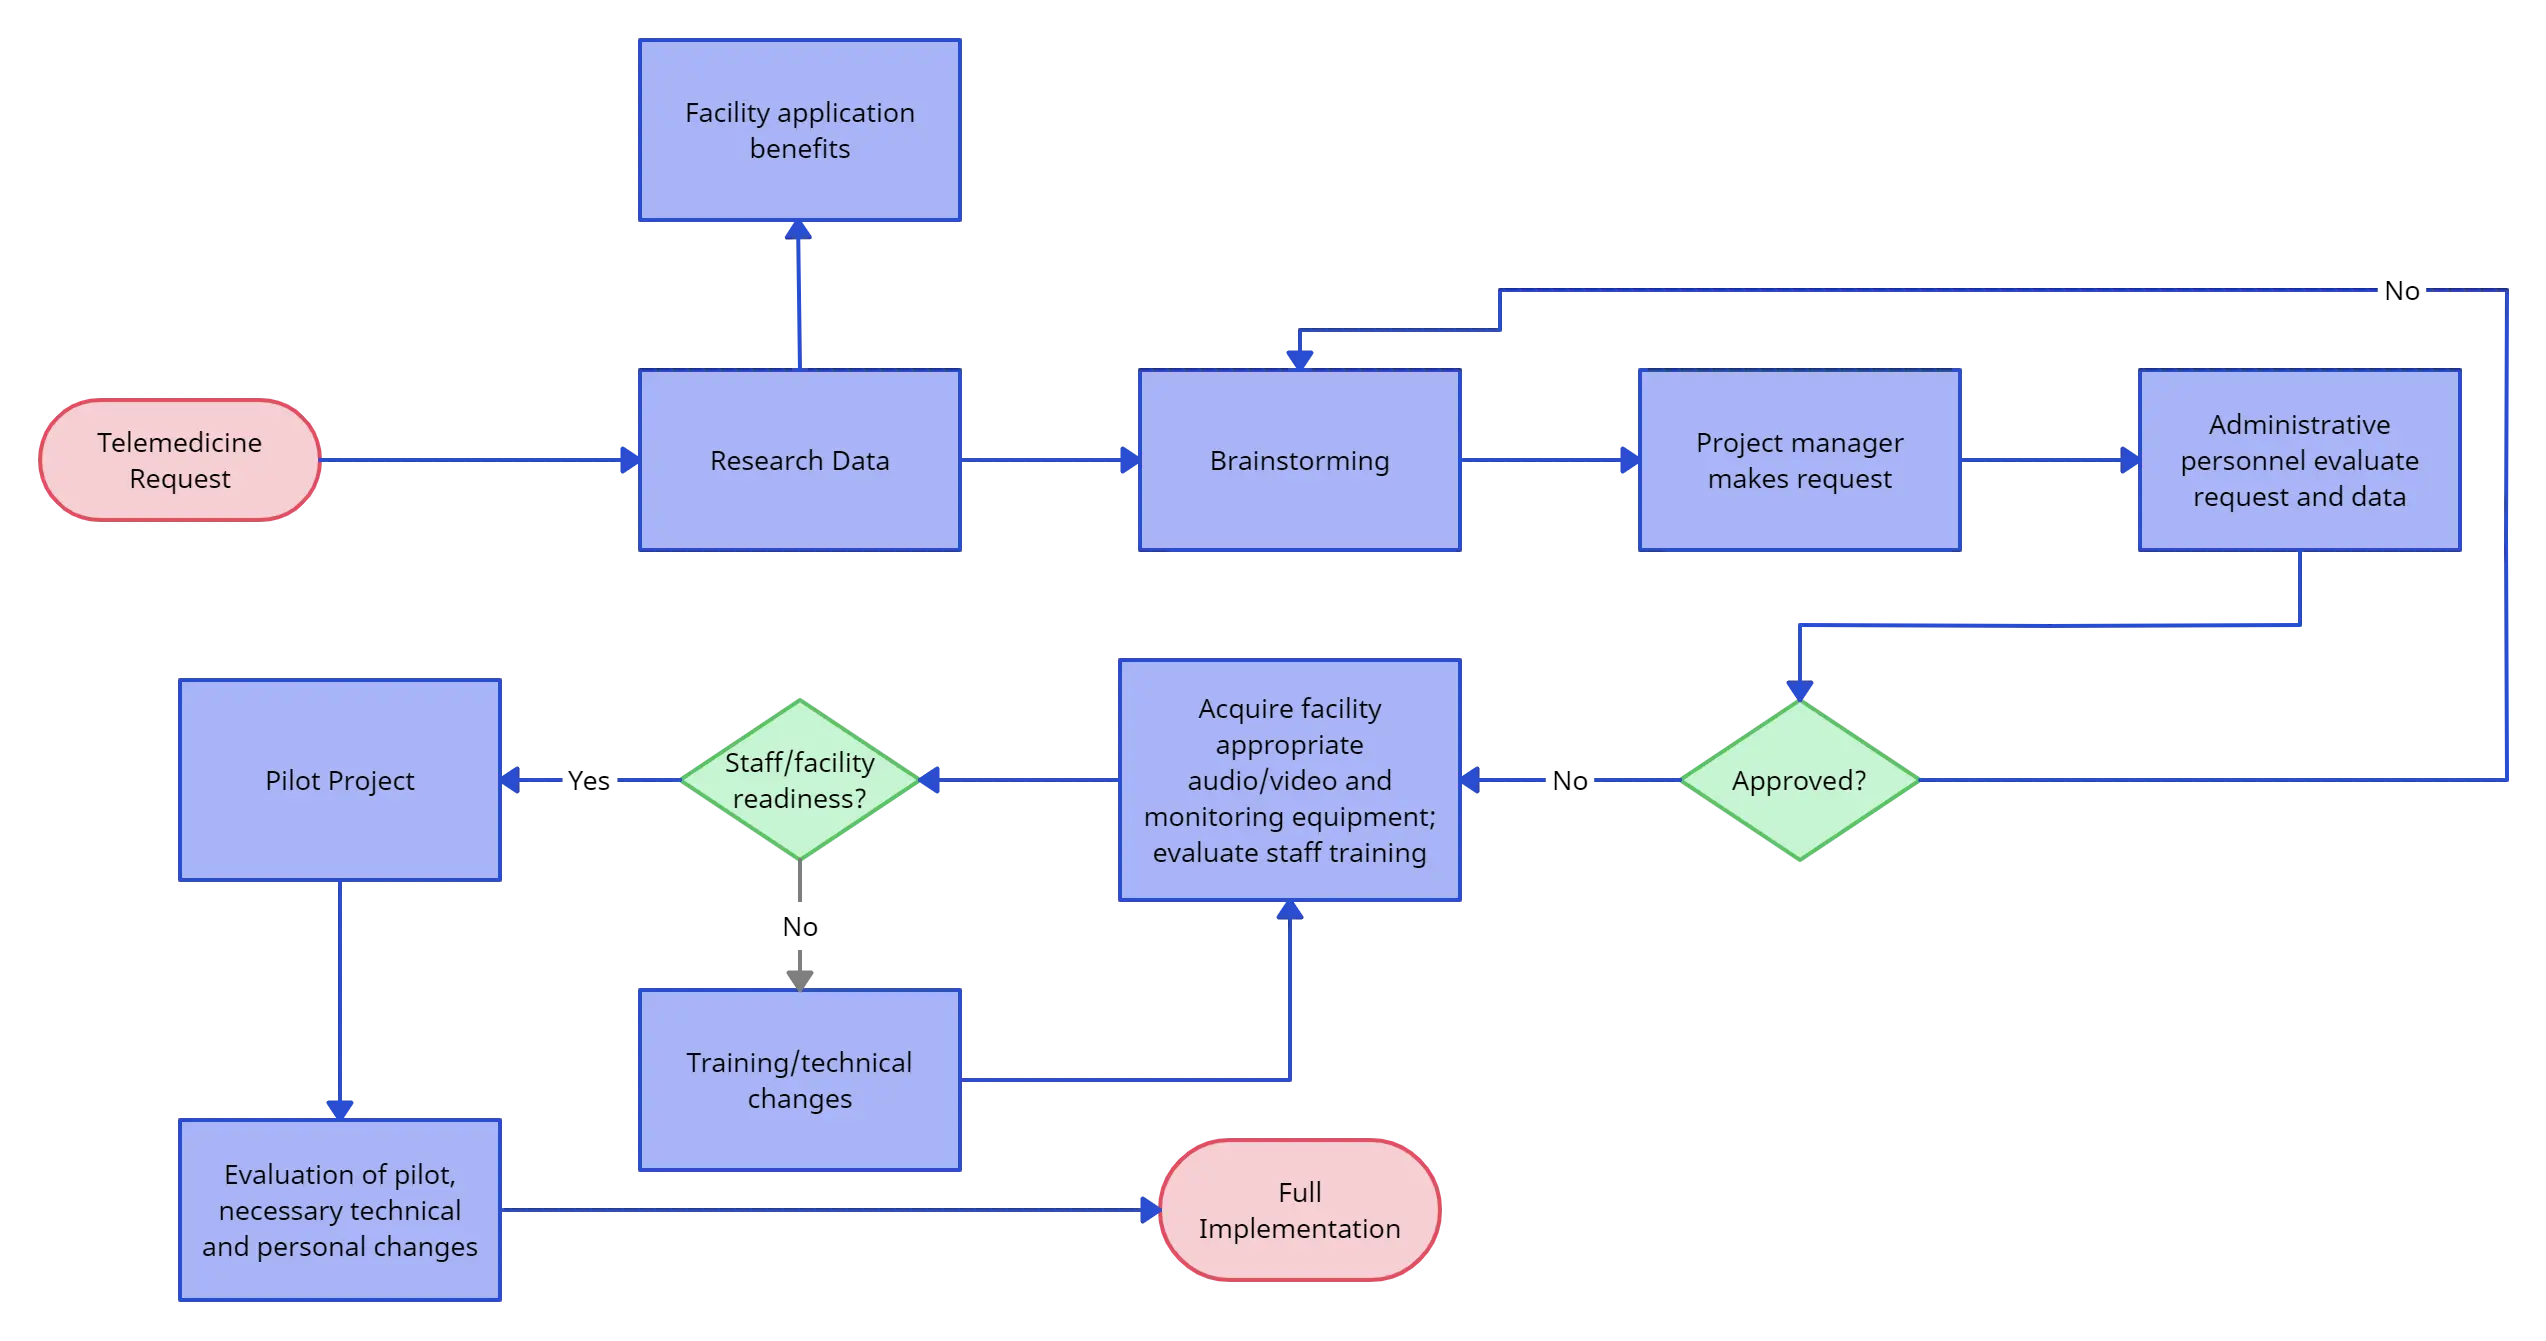
The diagram shows the stages and decisions in the project clearly, but it does not place them against a calendar. When dates, durations, milestones, progress, or schedule dependencies matter, complement the flowchart with a Gantt chart or another scheduling view.
Use a flowchart on projects of any size when the goal is to explain workflow logic. Use a Gantt chart when the goal is to plan tasks over time. For complex projects, using both can connect detailed process logic with the higher-level schedule.
Using Gantt Charts for Project Planning
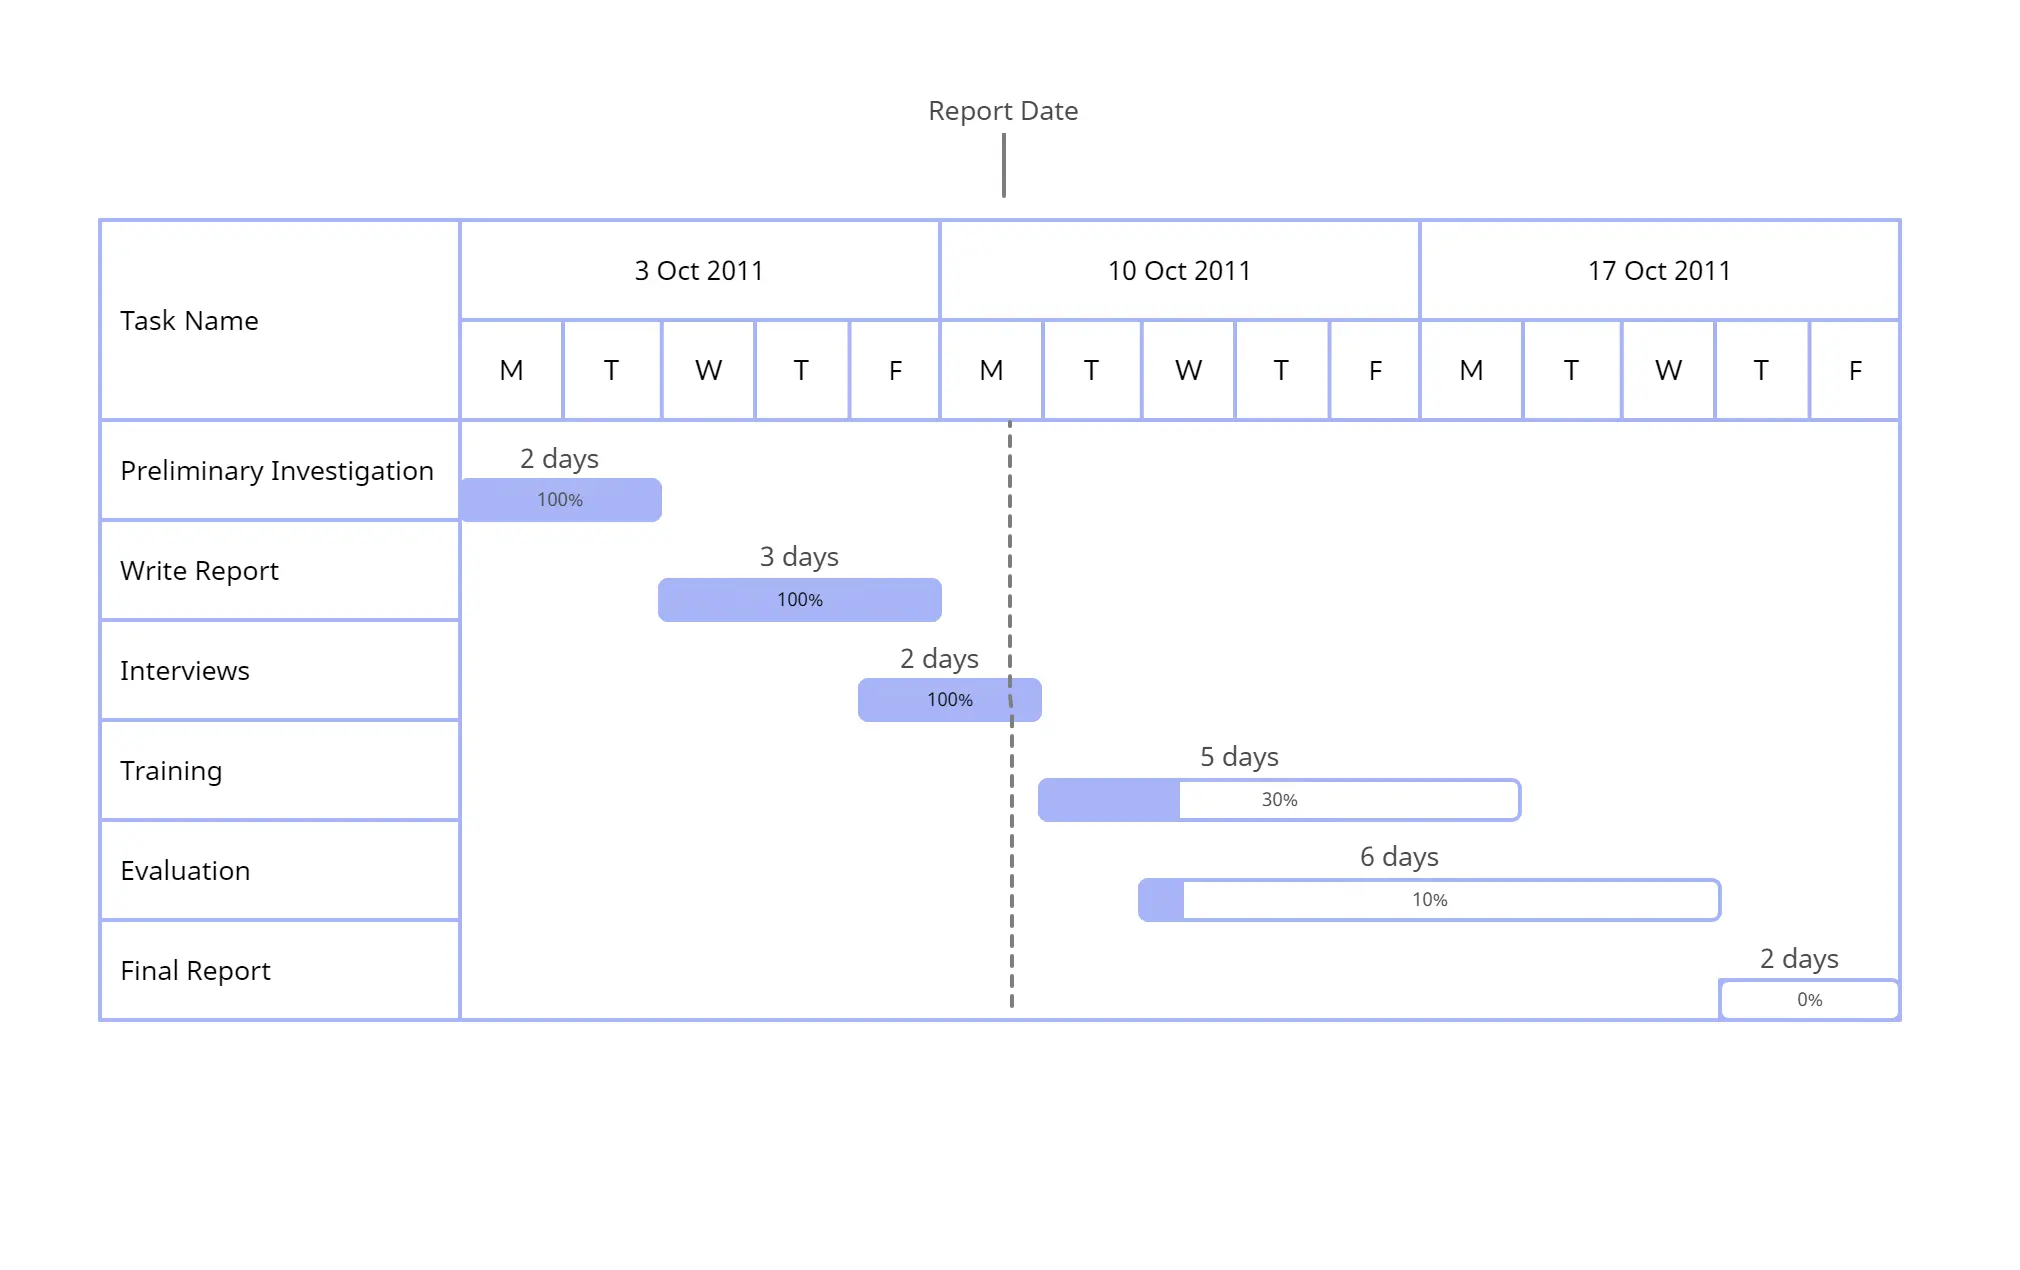
A Gantt chart displays project tasks as bars against a time scale. It can show planned start and end dates, durations, milestones, progress, owners, and dependency relationships. It does not normally explain the detailed decision logic or alternate paths within each task; use a flowchart for that view. Creately’s Gantt chart maker can be used for simple or complex project schedules.
Use Gantt Charts for High-Level Plans
Gantt charts support high-level project planning by placing tasks, milestones, and dependencies on a shared timeline. For a complex project, begin by defining the scope and breaking the work into tasks and subtasks. If a task contains decisions, alternate paths, or cross-team handoffs that the schedule cannot explain clearly, map that workflow separately with Creately’s flowchart software.
After documenting the workflow, identify the project tasks that belong on the Gantt chart. Estimate each task’s duration using the best information available, assign an owner, and set appropriate dates or constraints. Record the initial task and duration estimates in a table:
| Task | Duration |
|---|---|
| Task A | 3 weeks |
| Task B | 2 weeks |
| Task C | 3 weeks |
| Task D | 4 weeks |
Once you have determined the duration for essential tasks, you can identify their relationships, see if they can function independently, and add to the table:
| Task | Duration | Dependent Upon |
|---|---|---|
| Task A | 3 weeks | |
| Task B | 2 weeks | A |
| Task C | 3 weeks | B |
| Task D | 4 weeks | C |
Next, identify which tasks can run in parallel and which depend on earlier work. In this example, every task depends on the preceding task, so the tasks cannot be completed simultaneously.
Complex projects often contain tasks that can run in parallel. Identify the required dependency type and any constraints before linking tasks, then review the schedule whenever dates, estimates, or dependencies change.
Once you have defined the tasks, documented any detailed workflow logic in a flowchart, and identified task relationships, you can construct the Gantt chart and validate it with project stakeholders.
A Few Templates to Get You Started
Use the following editable templates to start a project schedule or document the workflow inside a task. Keep task names, owners, and scope consistent between the flowchart and Gantt chart so stakeholders can move between process logic and schedule context without confusion. When the plan changes, review both views and update the affected decisions, handoffs, dates, and dependencies.
Here are a few templates to get you started in the meantime.
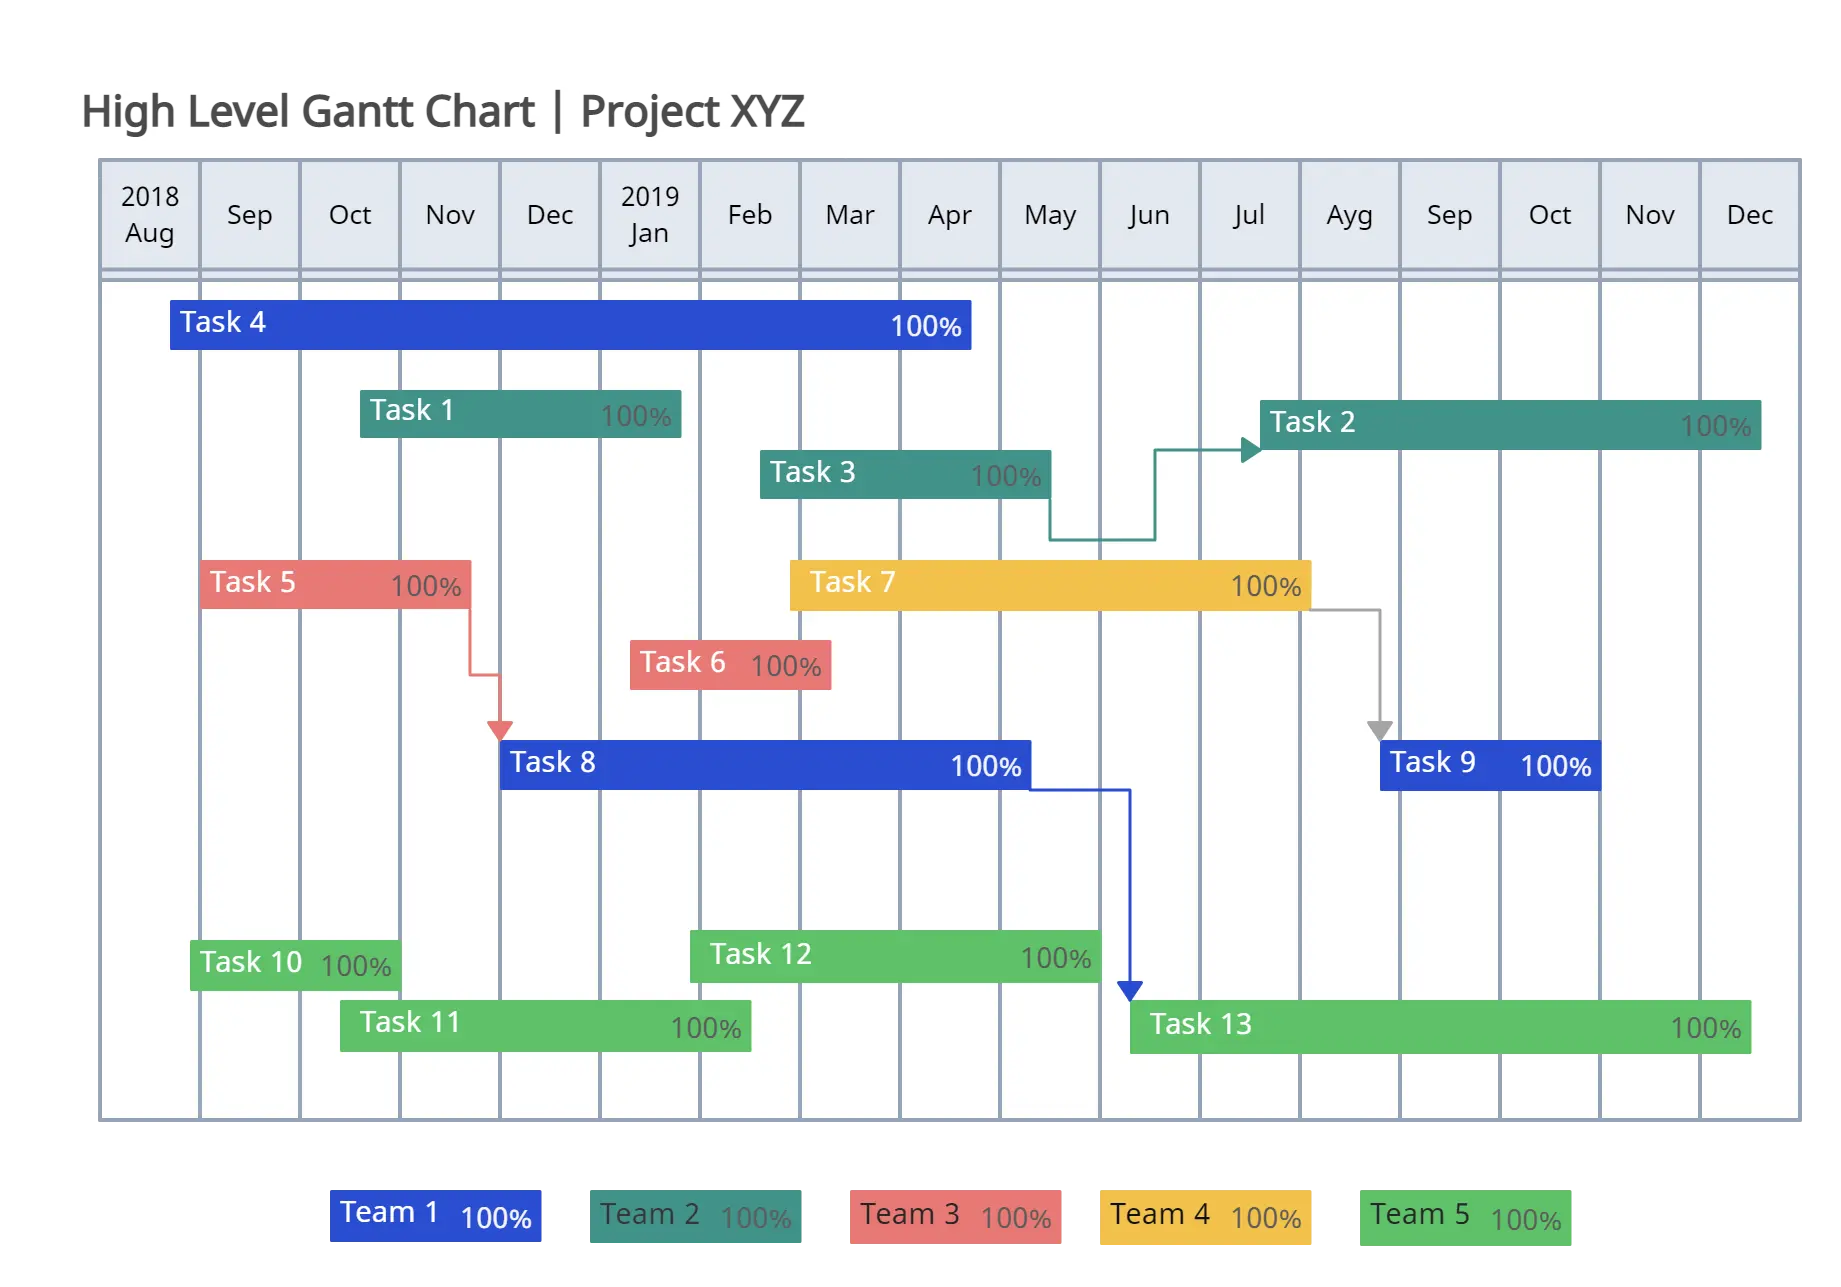
Template 1 - Gantt Chart for High Level Project Plan
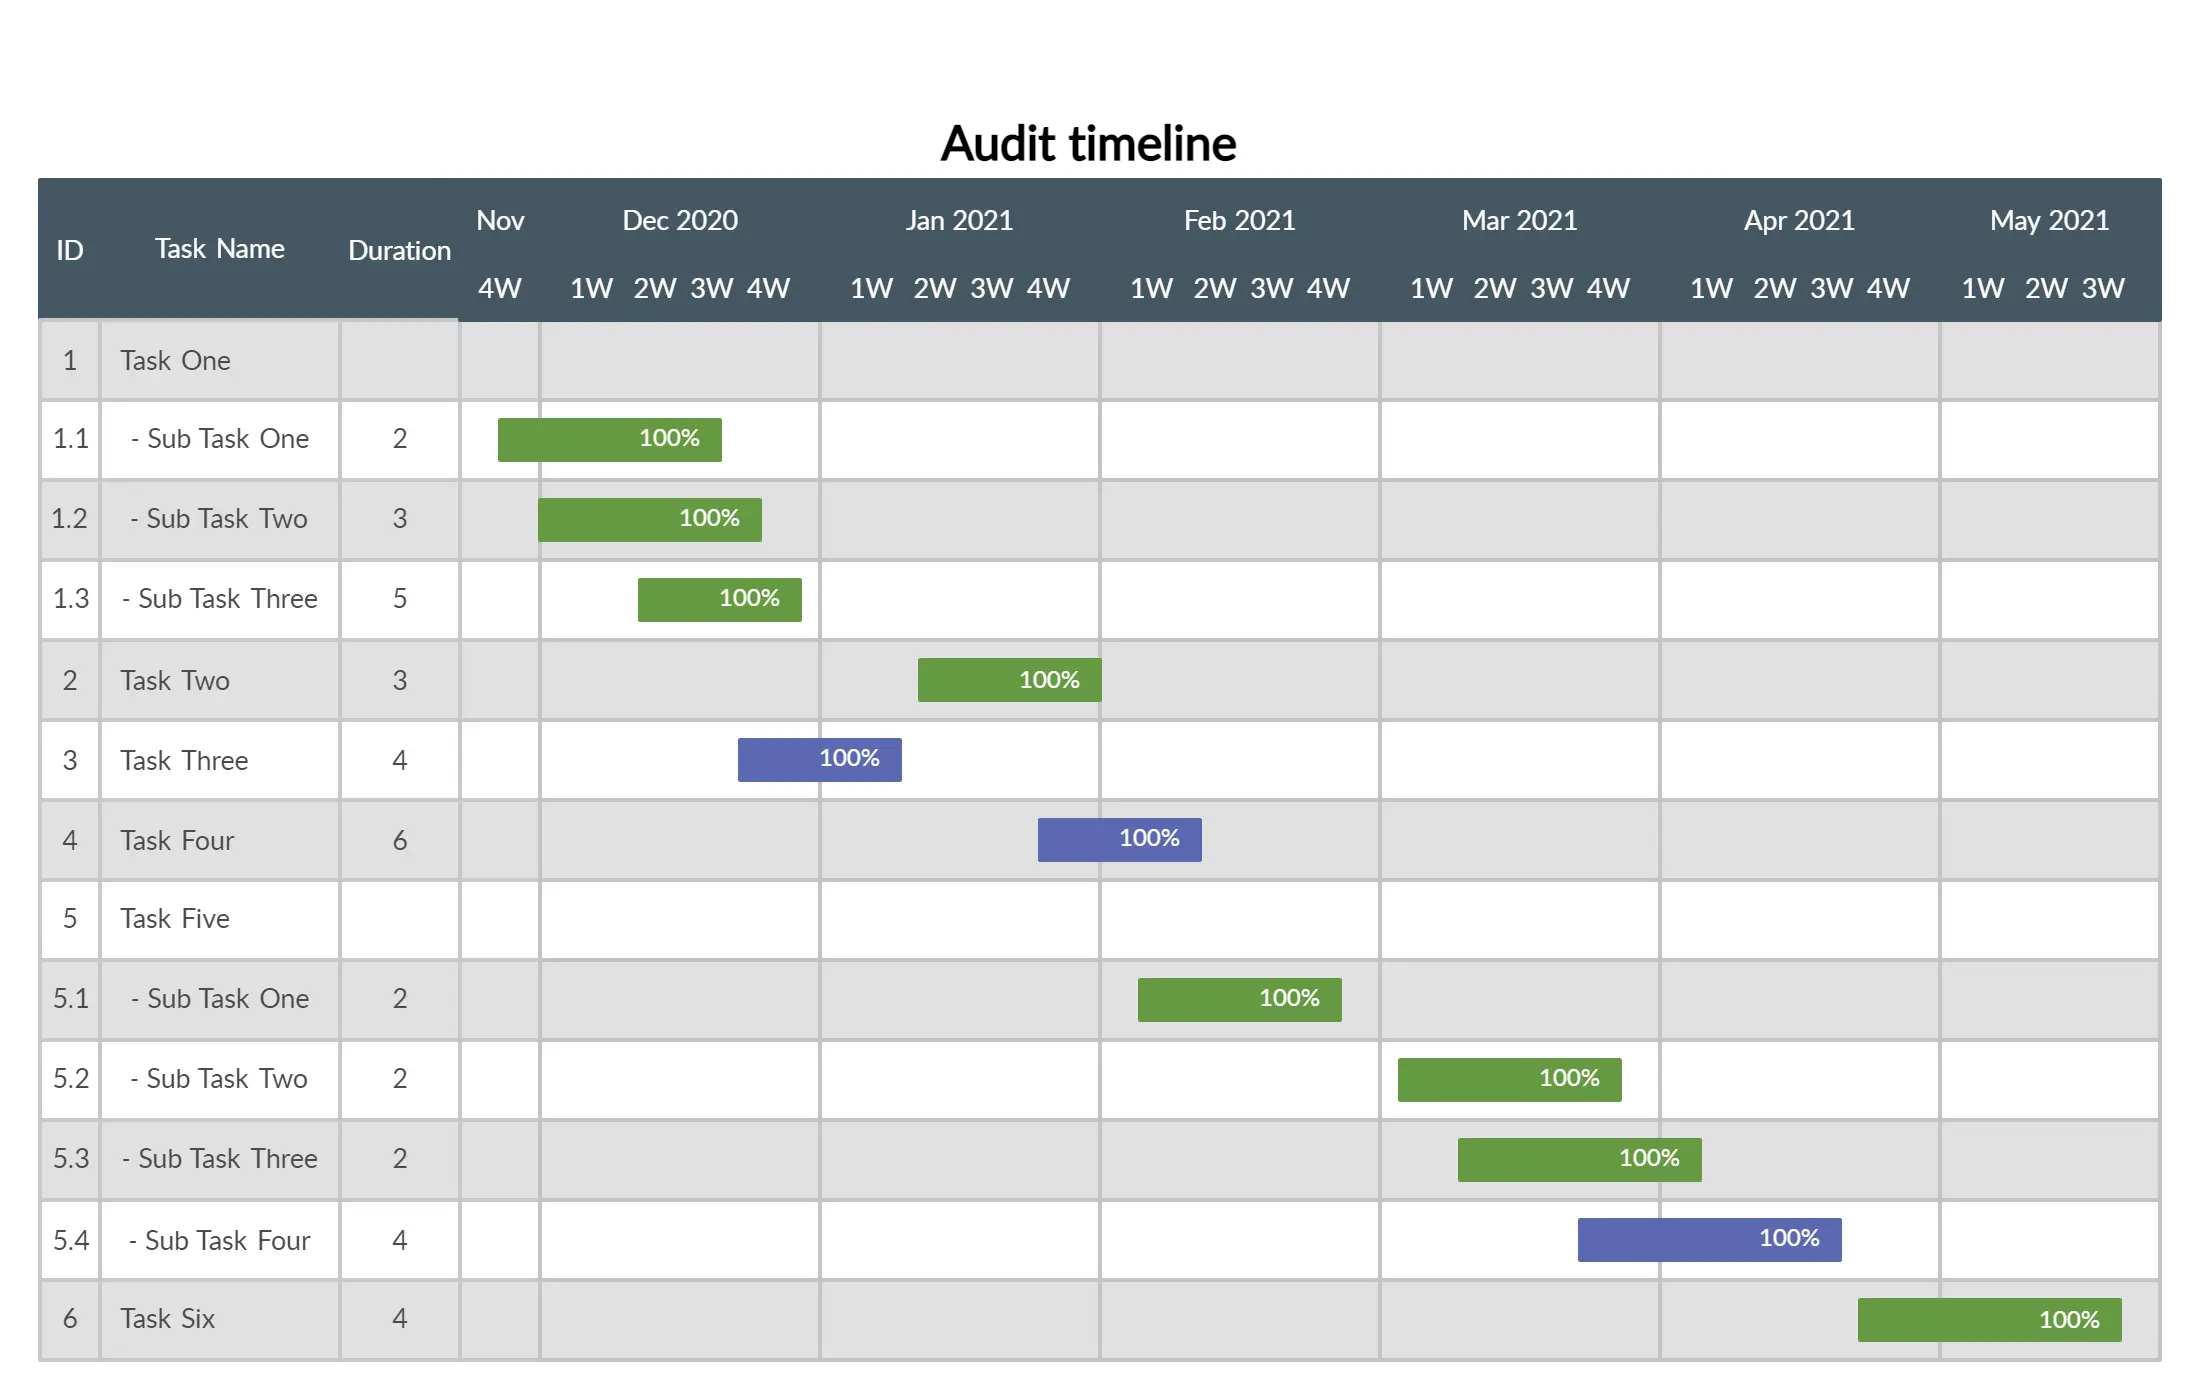
Template 2 - Gantt Chart for Company Audit
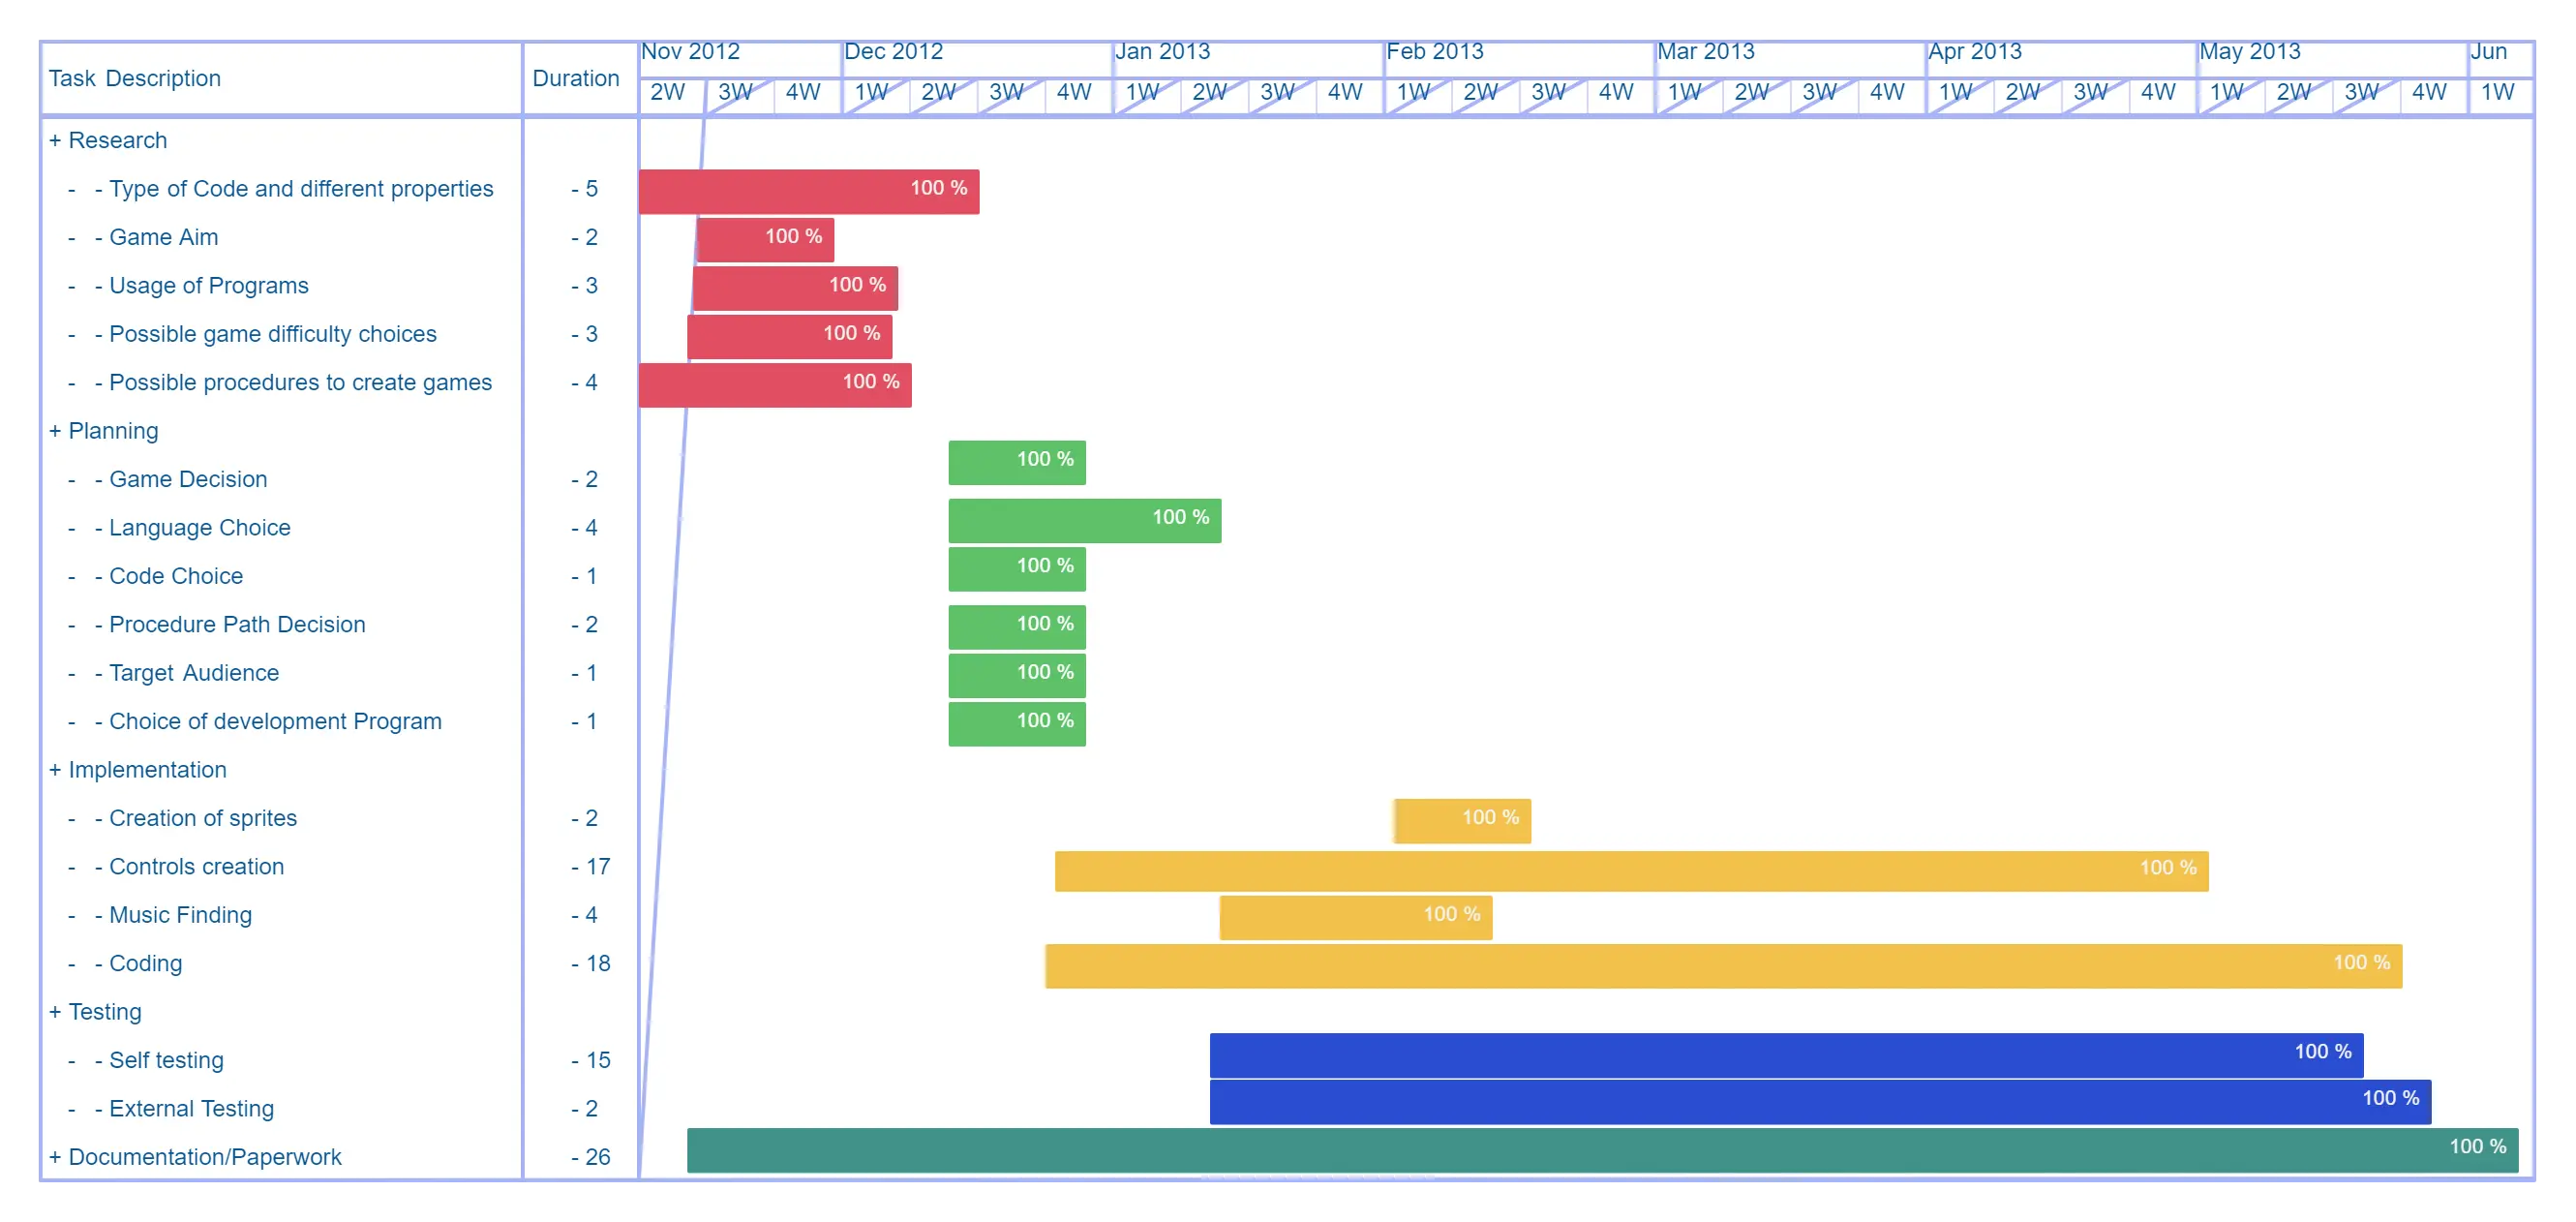
Template 3 - Game Development Project - Gantt Chart
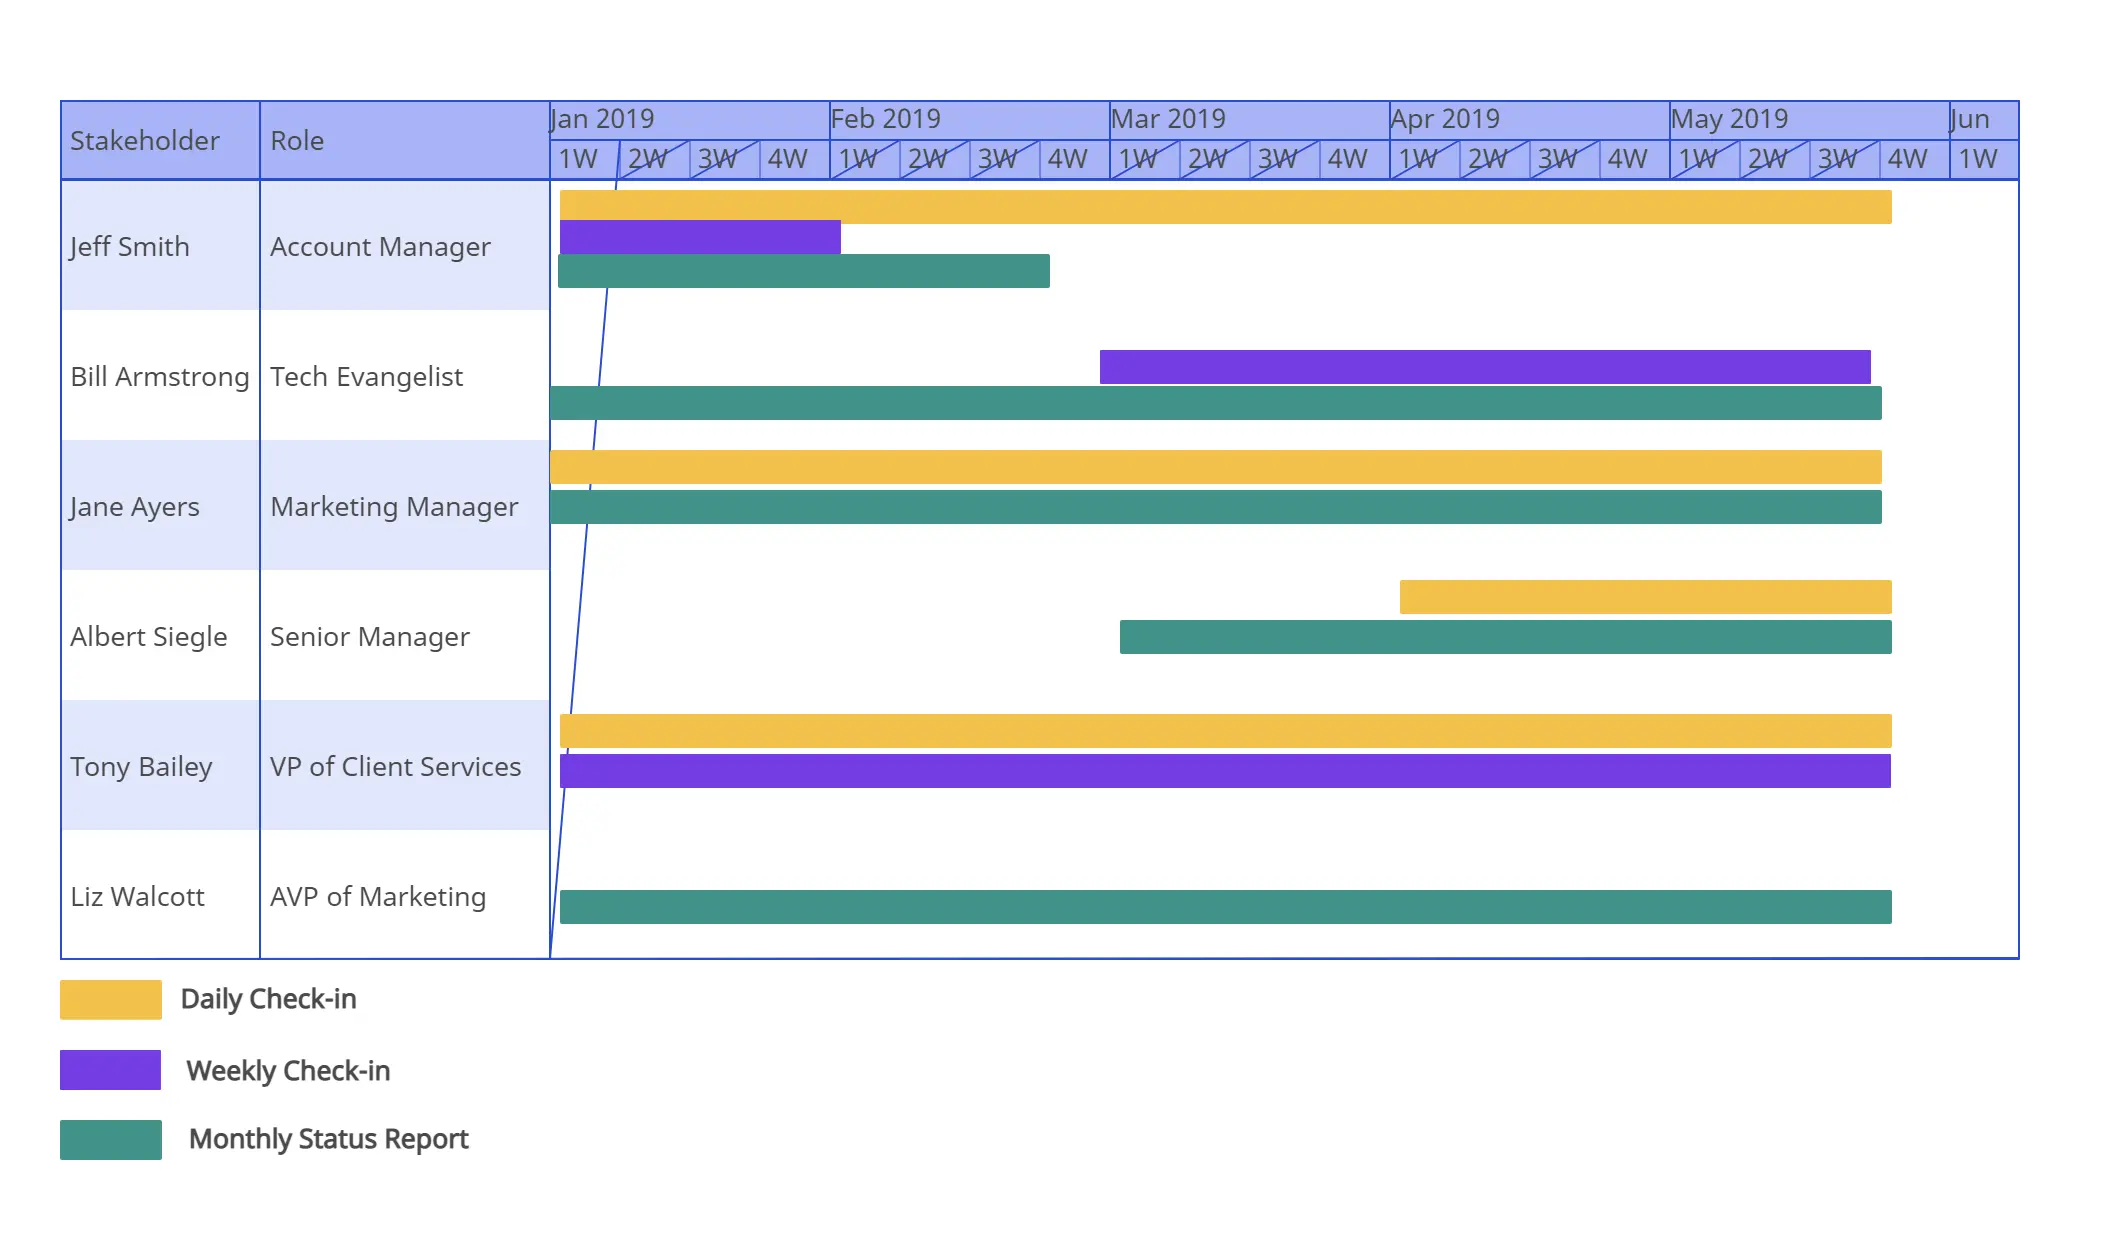
Template 4 - Communication Schedule Gantt Chart
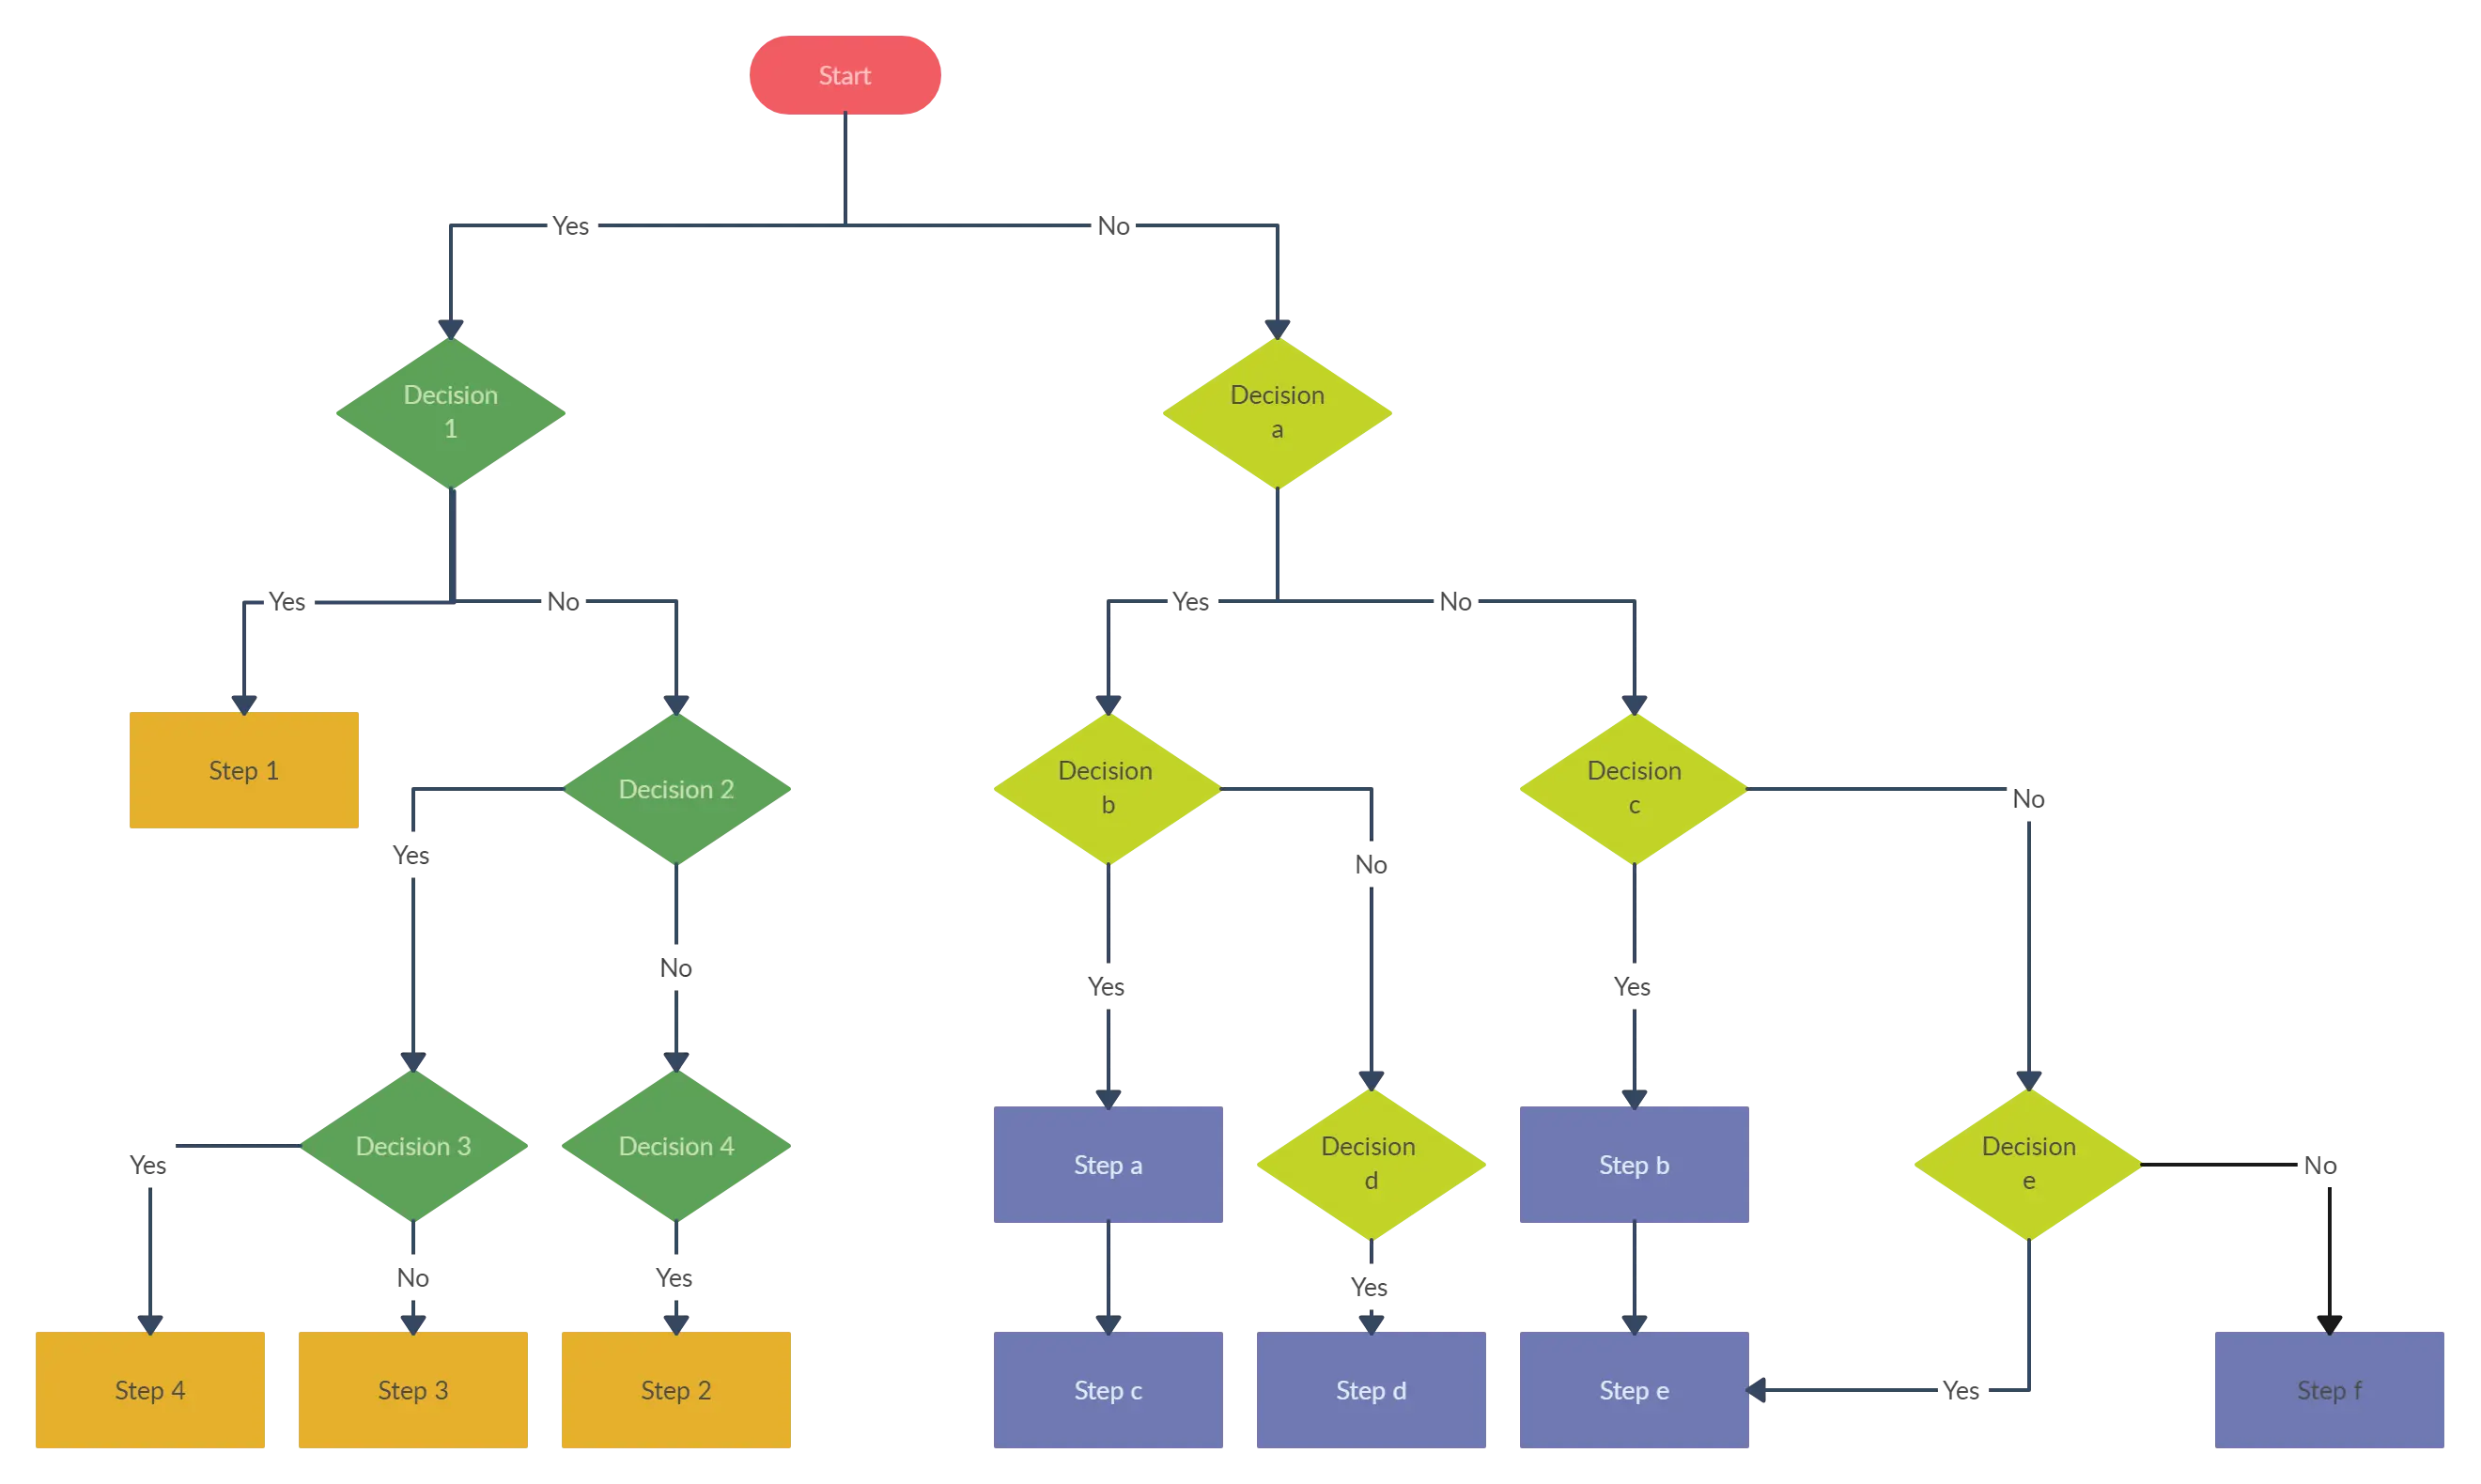
Template 5 - Decision Flowchart Template
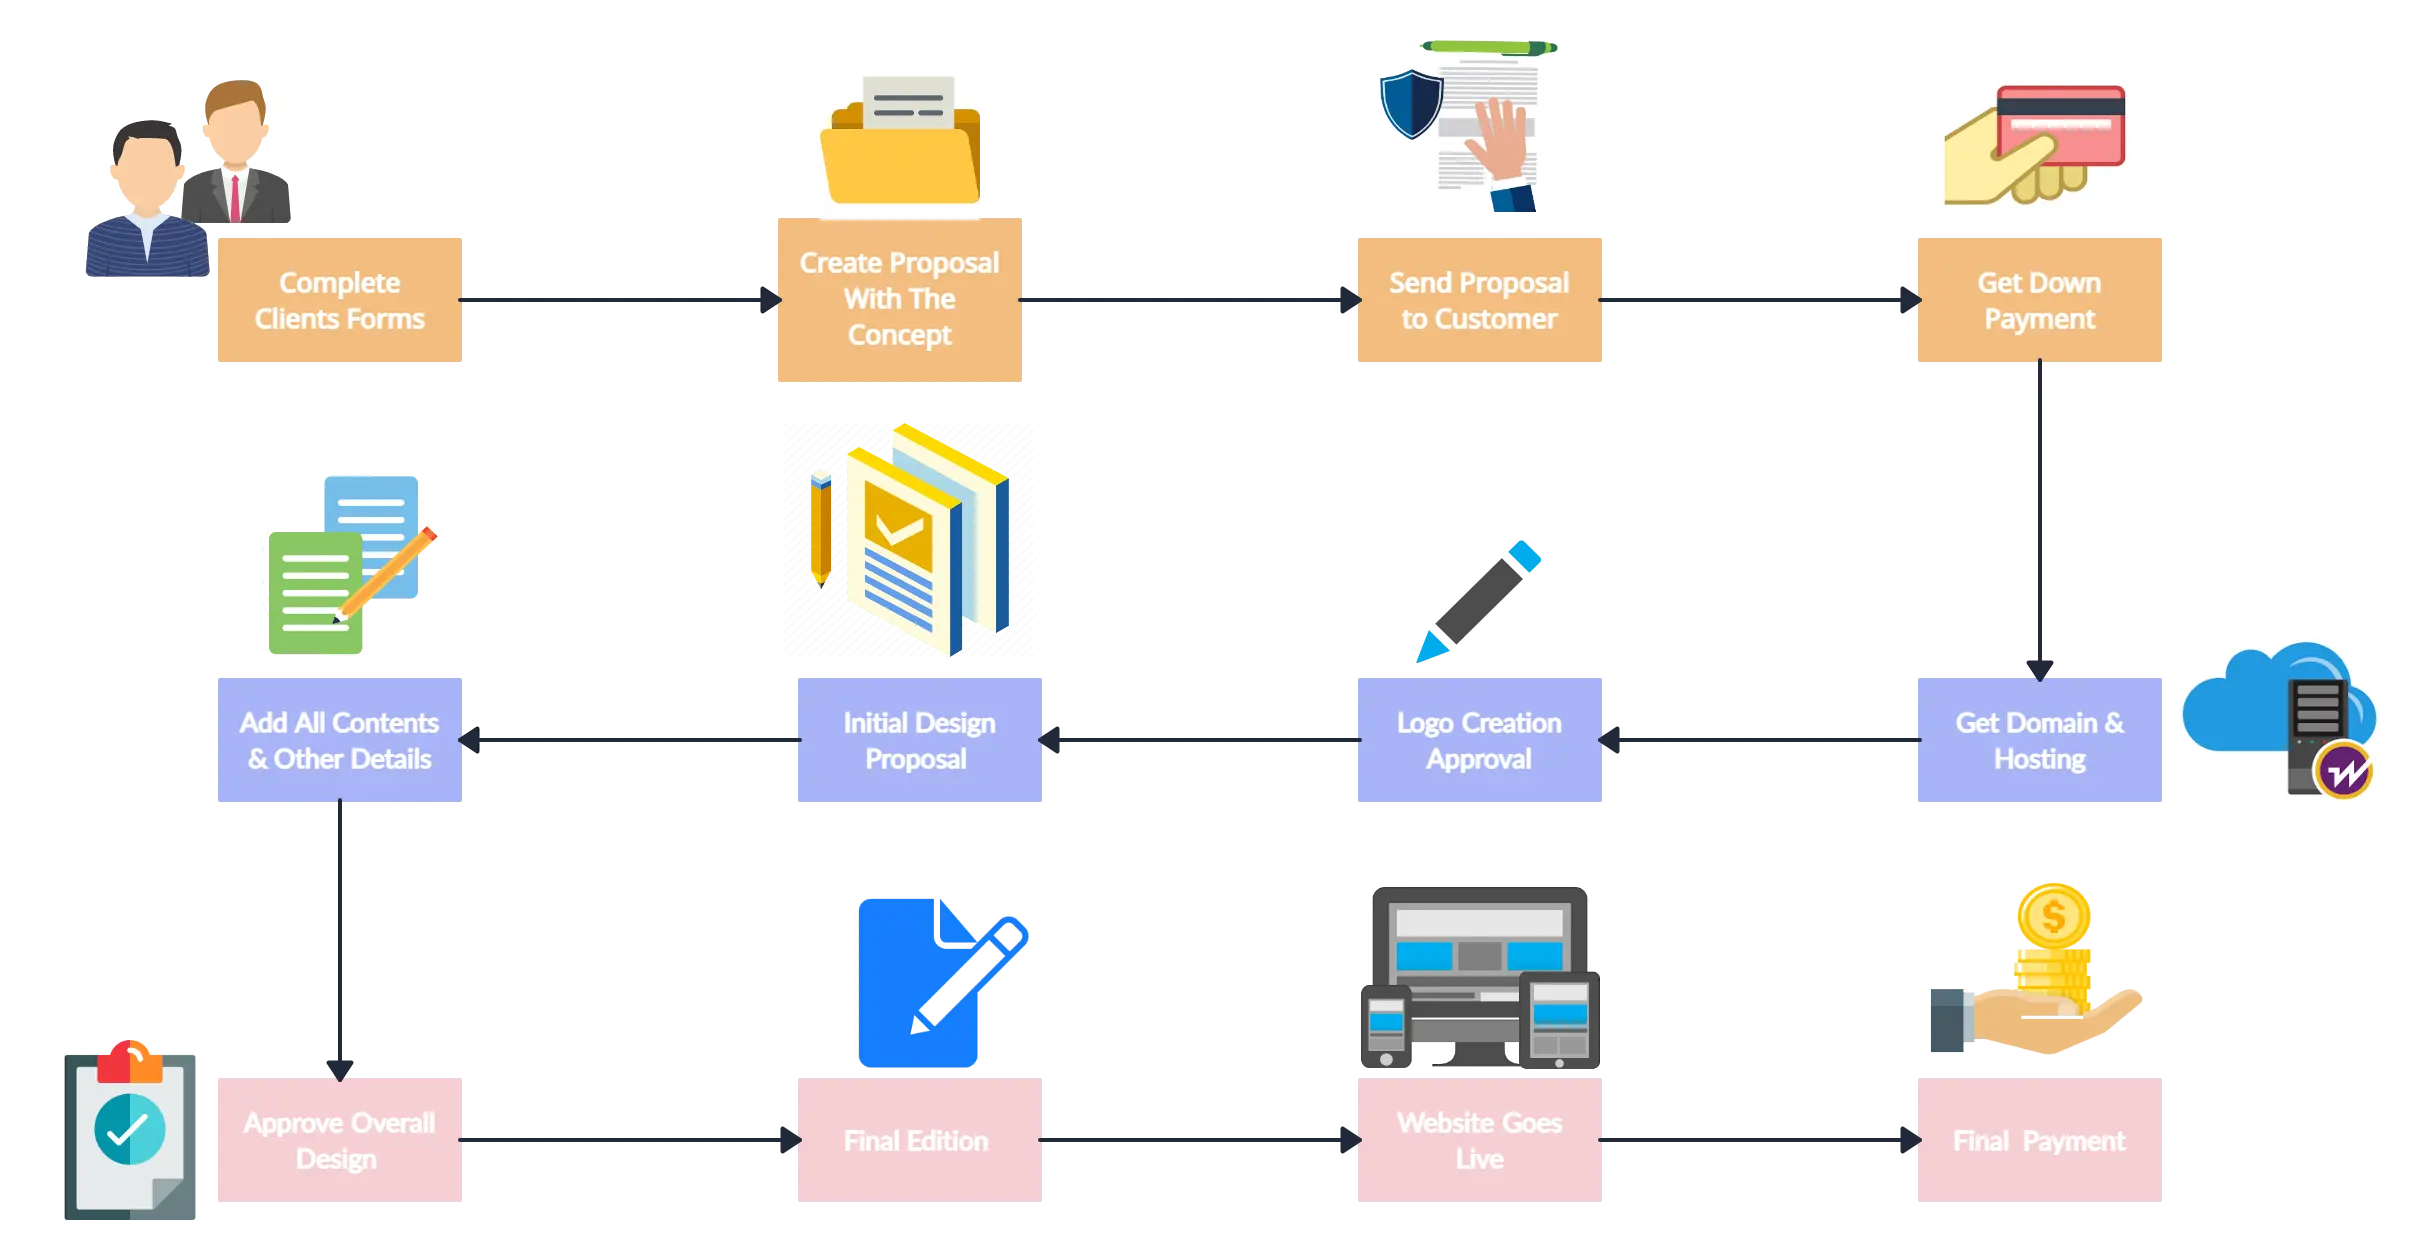
Template 6 - Website Design Workflow
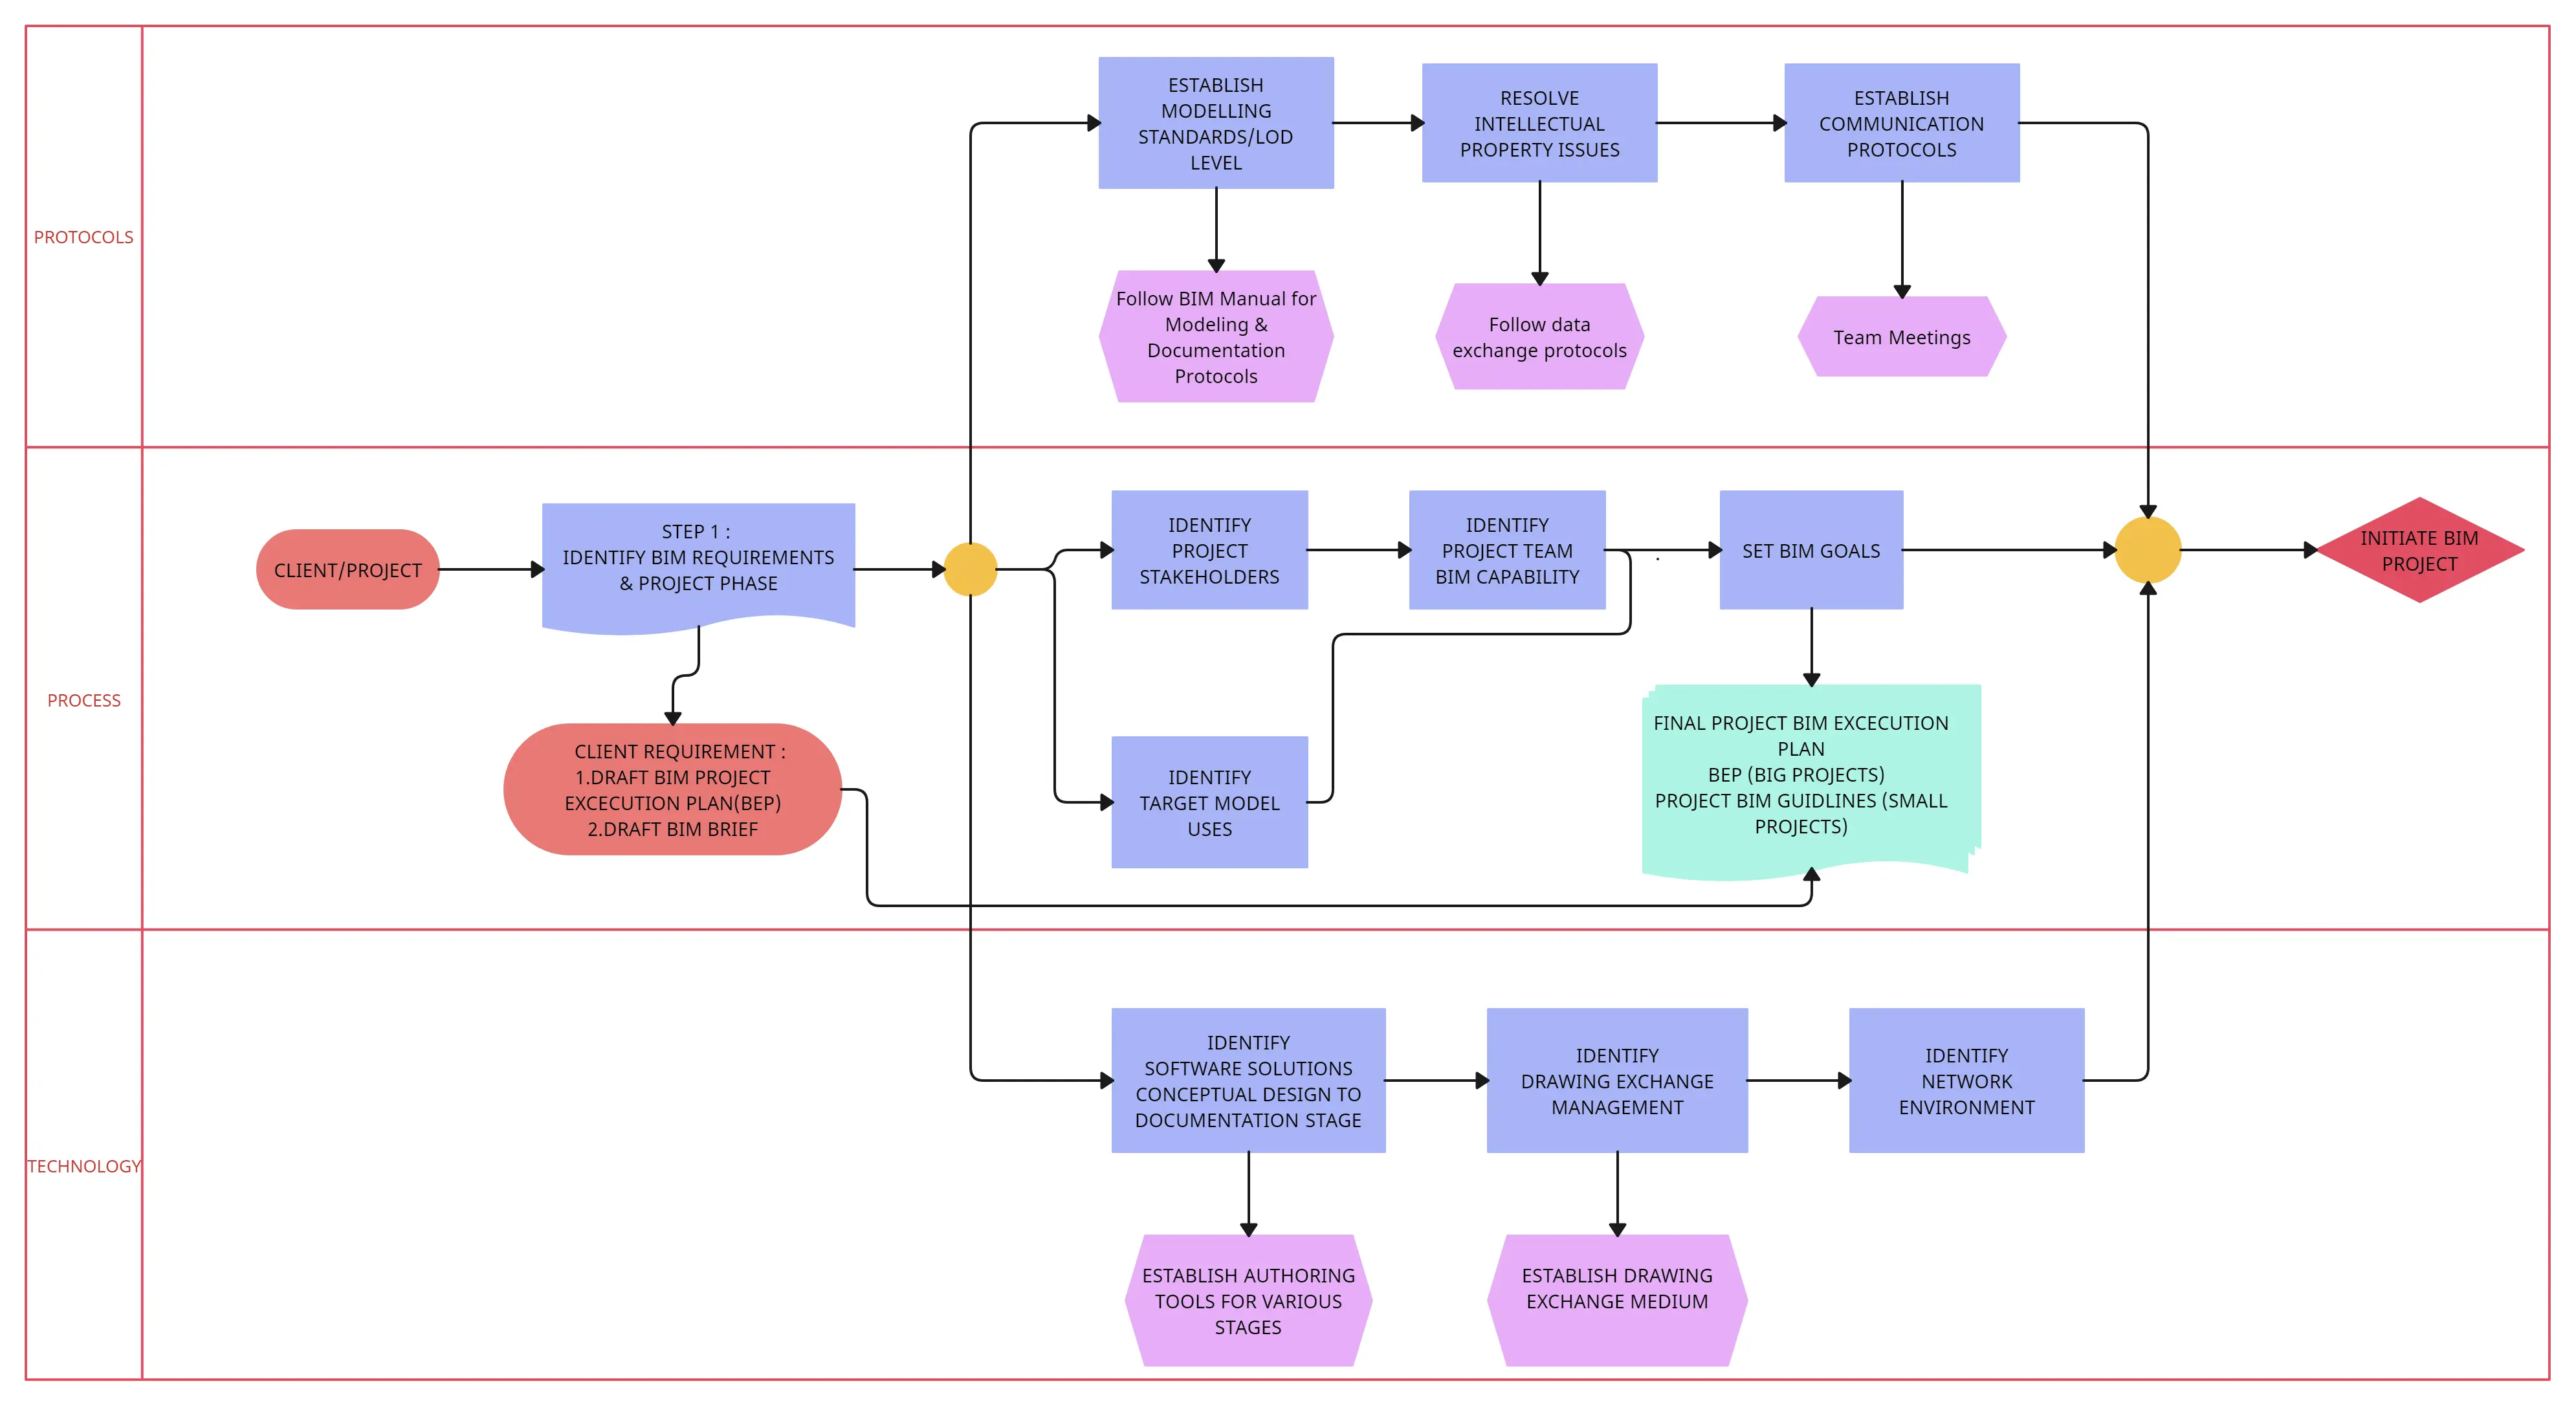
Template 7 - Project BIM Workflow