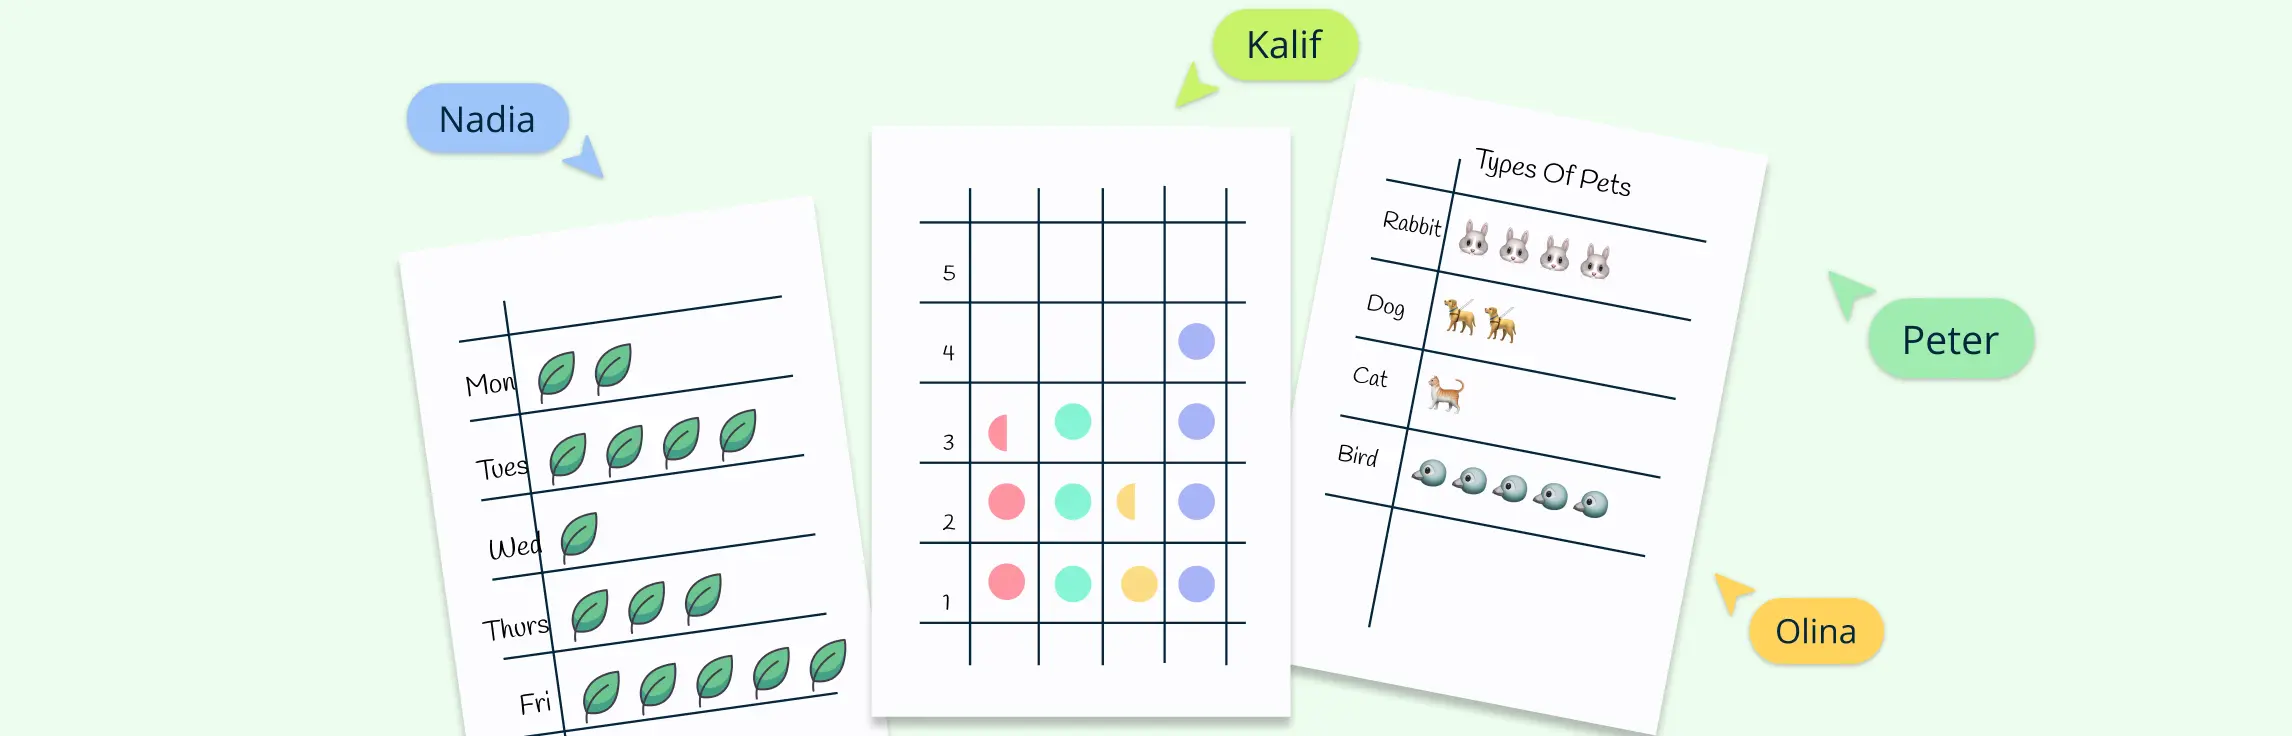
Pictographs turn numbers into pictures, making data easier to read and more fun to explore. Instead of plain figures, you can use icons—like apples for fruit, trees for planting projects, or people for population.
Pictographs turn numbers into pictures, making data easier to read and more fun to explore. Instead of plain figures, you can use icons—like apples for fruit, trees for planting projects, or people for population.
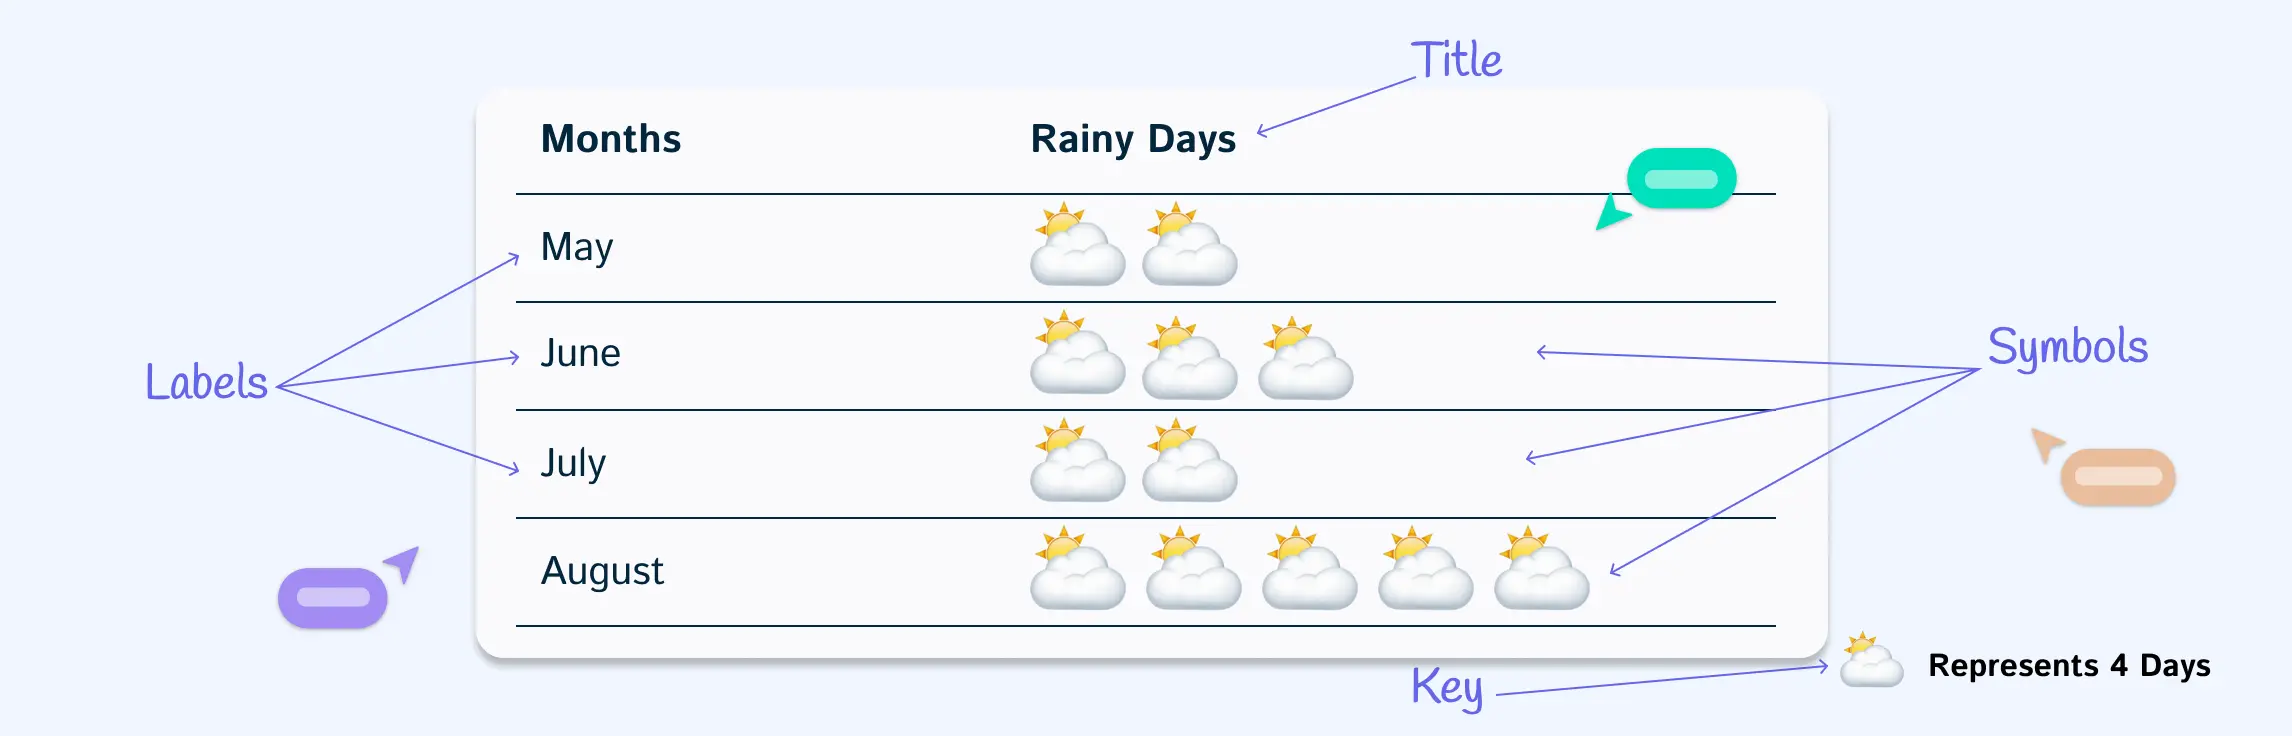
This guide will explain what a pictograph is and break down its key parts. You’ll also learn how to read pictograms, when to use them, and the advantages and disadvantages of using pictograms for visualizing data.
Ever struggled to make numbers or ideas instantly click with your audience? That’s where pictograms come in. Instead of overwhelming people with long tables or text, pictograms use simple icons and visuals to turn information into something clear and memorable. In this guide, you’ll learn how to make a pictograph step by step, explore ready-to-use templates, and discover best practices for creating designs that communicate with impact.