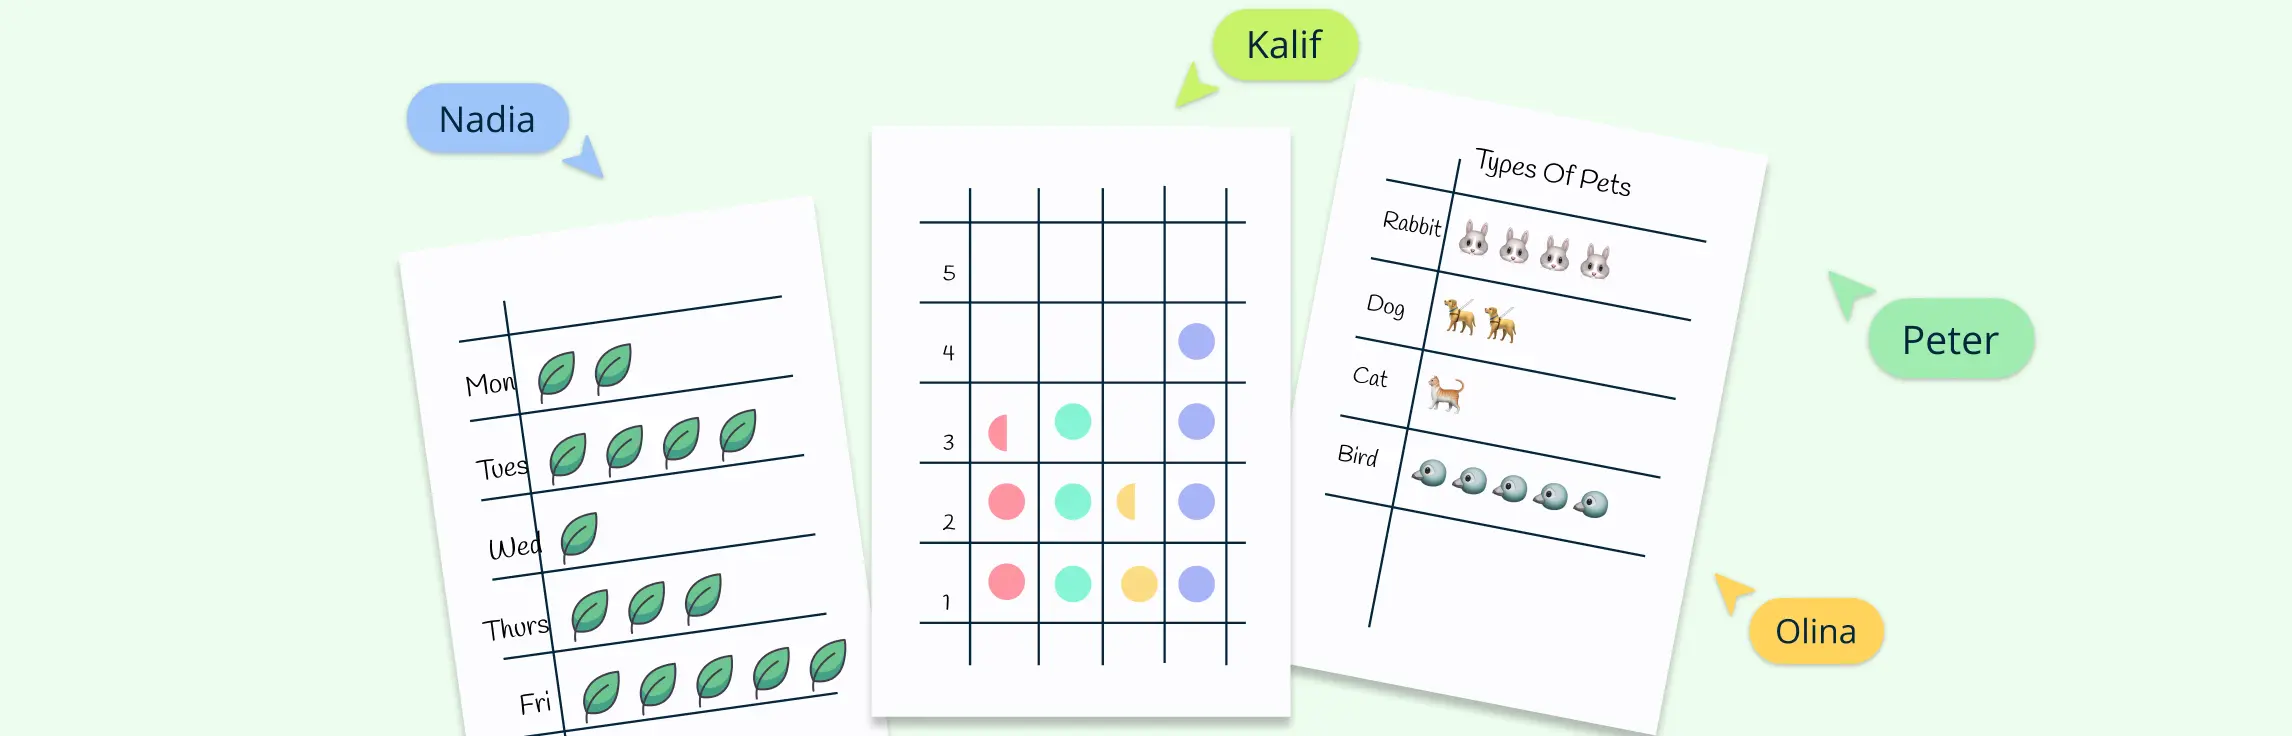
Pictographs turn numbers into pictures, making data easier to read, compare, and explain. Instead of showing only figures, they use icons such as apples, trees, animals, sports equipment, or people to represent quantities.
Pictographs turn numbers into pictures, making data easier to read, compare, and explain. Instead of showing only figures, they use icons such as apples, trees, animals, sports equipment, or people to represent quantities.
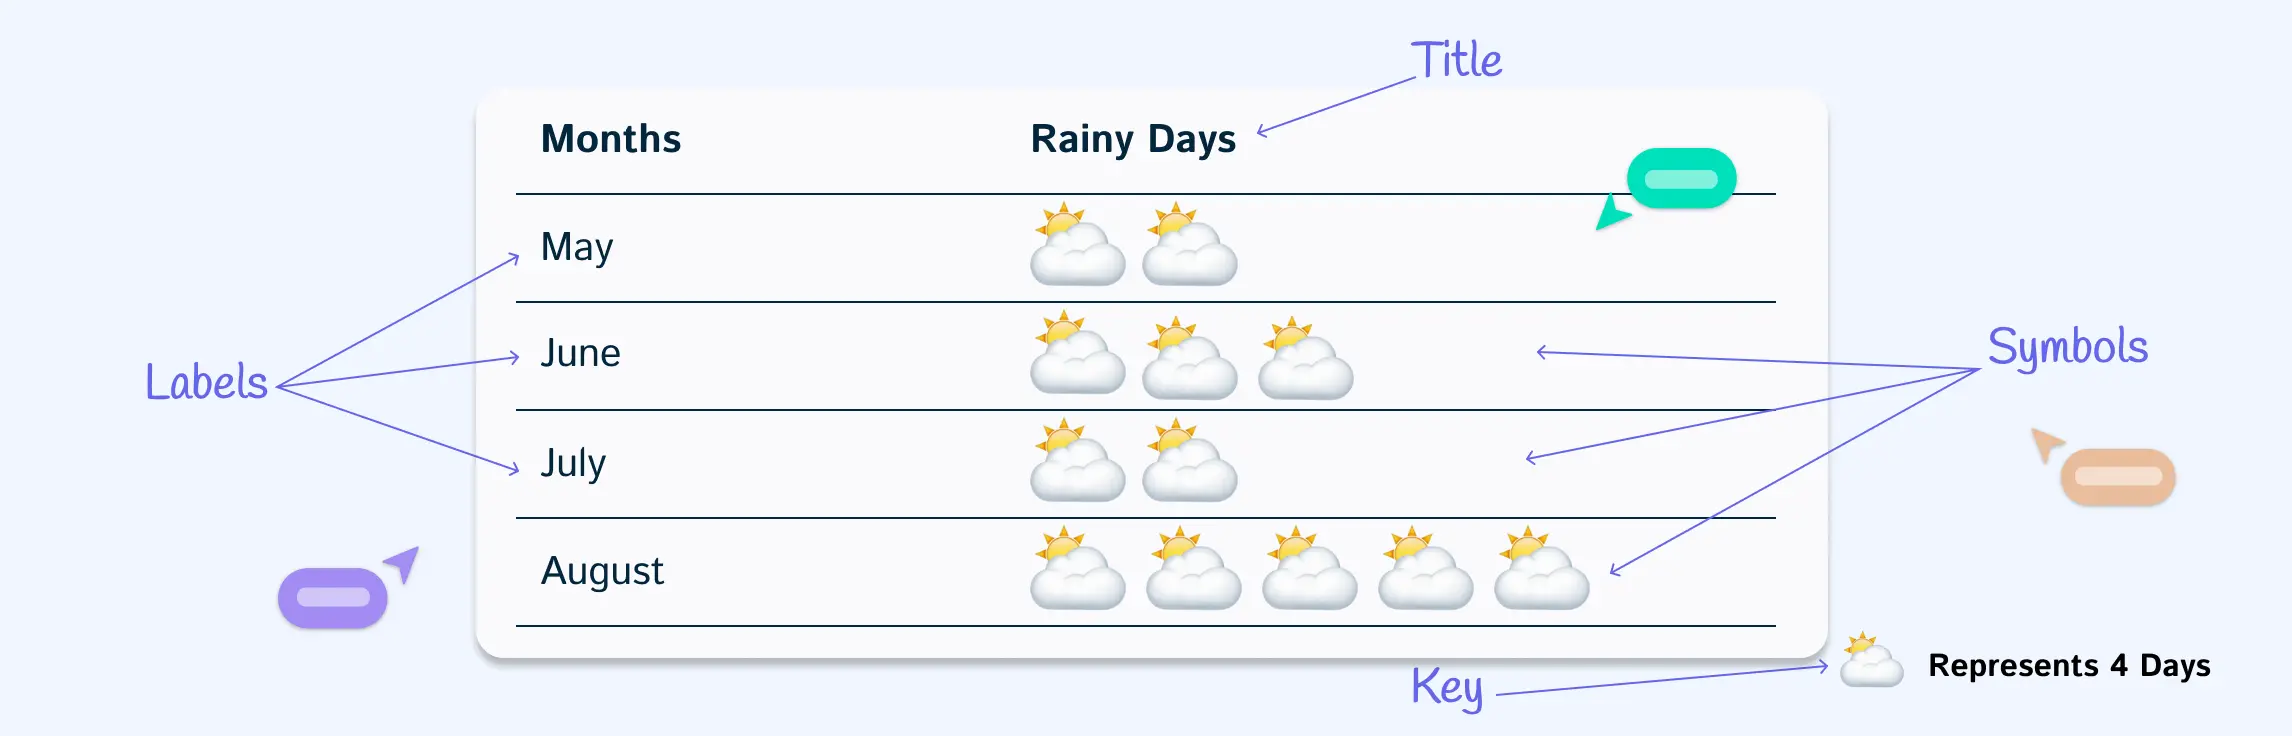
This guide will explain what a pictograph is and break down its key parts. You’ll also learn how to read pictograms, when to use them, and the advantages and disadvantages of using pictograms for visualizing data.