Product management is all about making the right decisions—what to build, when, and how to meet customer needs. With so many moving parts, frameworks help simplify the process by providing clear, structured approaches.
This guide covers essential product management frameworks, from discovery to execution and measurement. Whether you’re new to product management or refining your approach, these product frameworks will help you work smarter and build better products.
What Are Product Management Frameworks
Product management frameworks are structured approaches that help product managers make better decisions. They provide step-by-step guidance for tasks like understanding customer needs, prioritizing features, planning roadmaps, and measuring success.
Think of them as blueprints that simplify complex processes. Instead of starting from scratch every time, frameworks give product teams a proven way to solve problems and build great products. They bring clarity, improve teamwork, and help businesses stay focused on what matters most—creating value for customers.
35 Product Management Frameworks to Strategize for Success
In this section, we’ll cover product management frameworks that help you define your product vision, understand your market, and align your team around clear goals. These product management frameworks provide a structured way to make smart decisions, prioritize effectively, and set your product up for long-term success.
Strategic Product Management Frameworks
Strategic product management frameworks are tools that help businesses plan and execute their product strategies effectively. They provide structured approaches to understanding markets, defining product visions, and making informed decisions. Below are several key product frameworks:
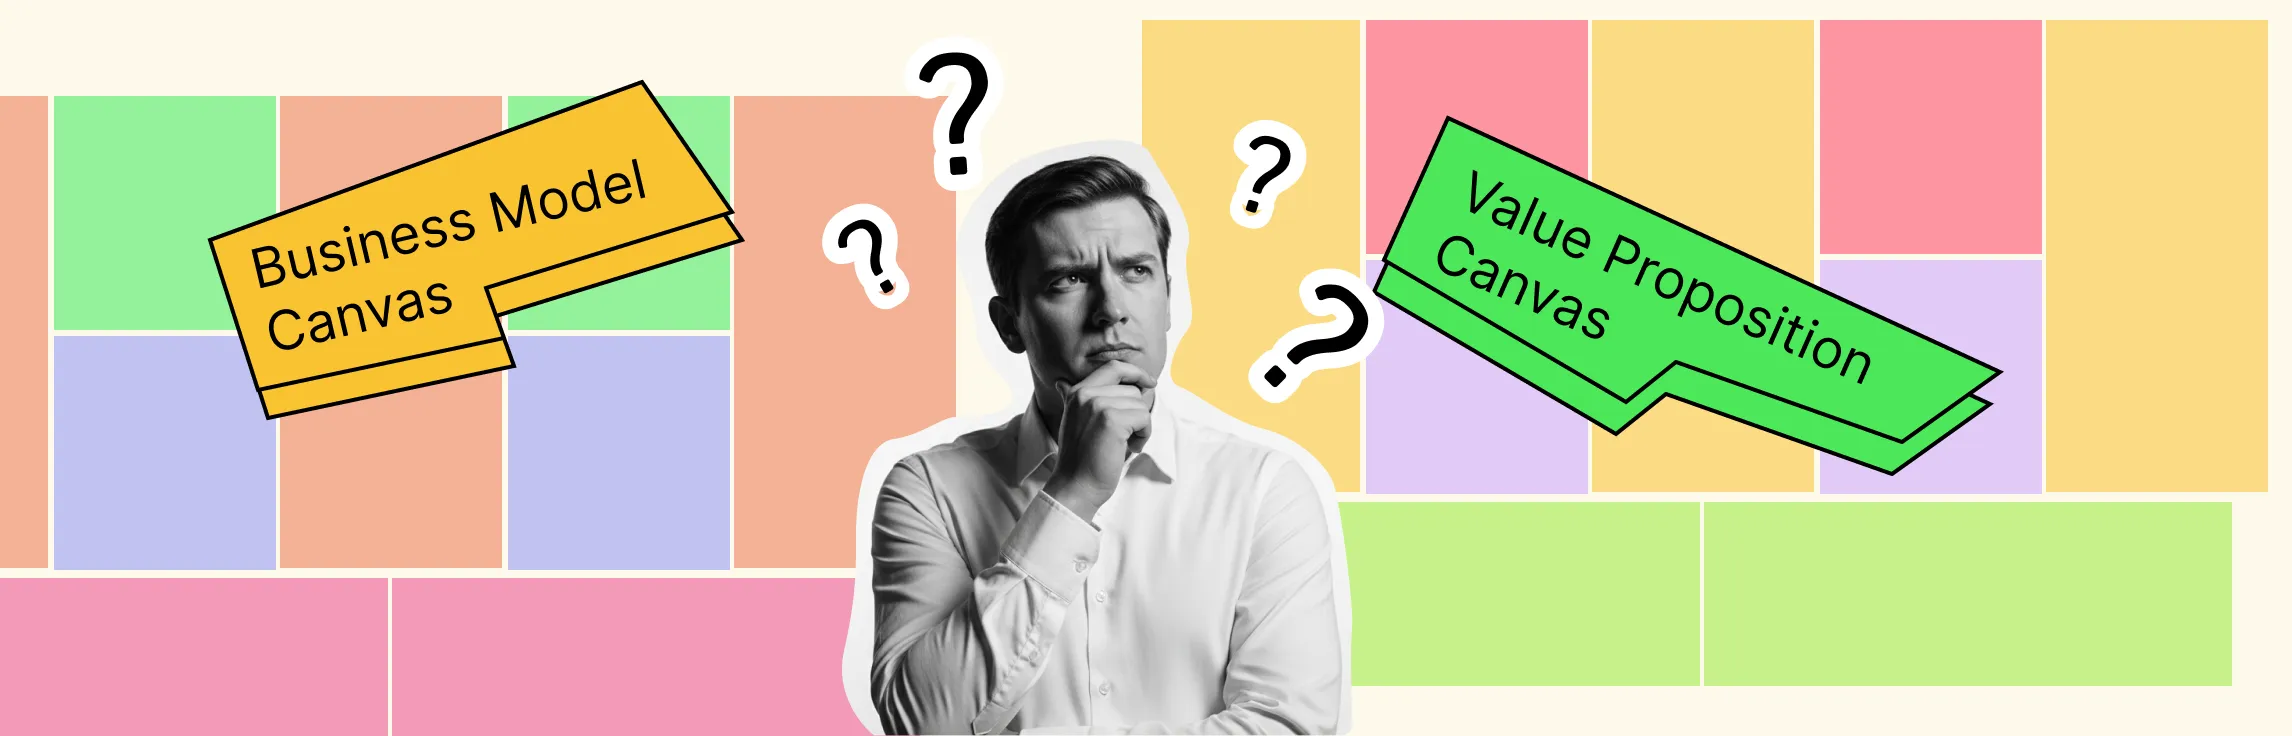
1. Business Model Canvas
The business model canvas is a strategic management tool that helps teams map out, visualize, and understand the key elements of a business or product. It breaks down the business model into nine key components, making it easier to see how different parts of the business interact and contribute to its overall success.
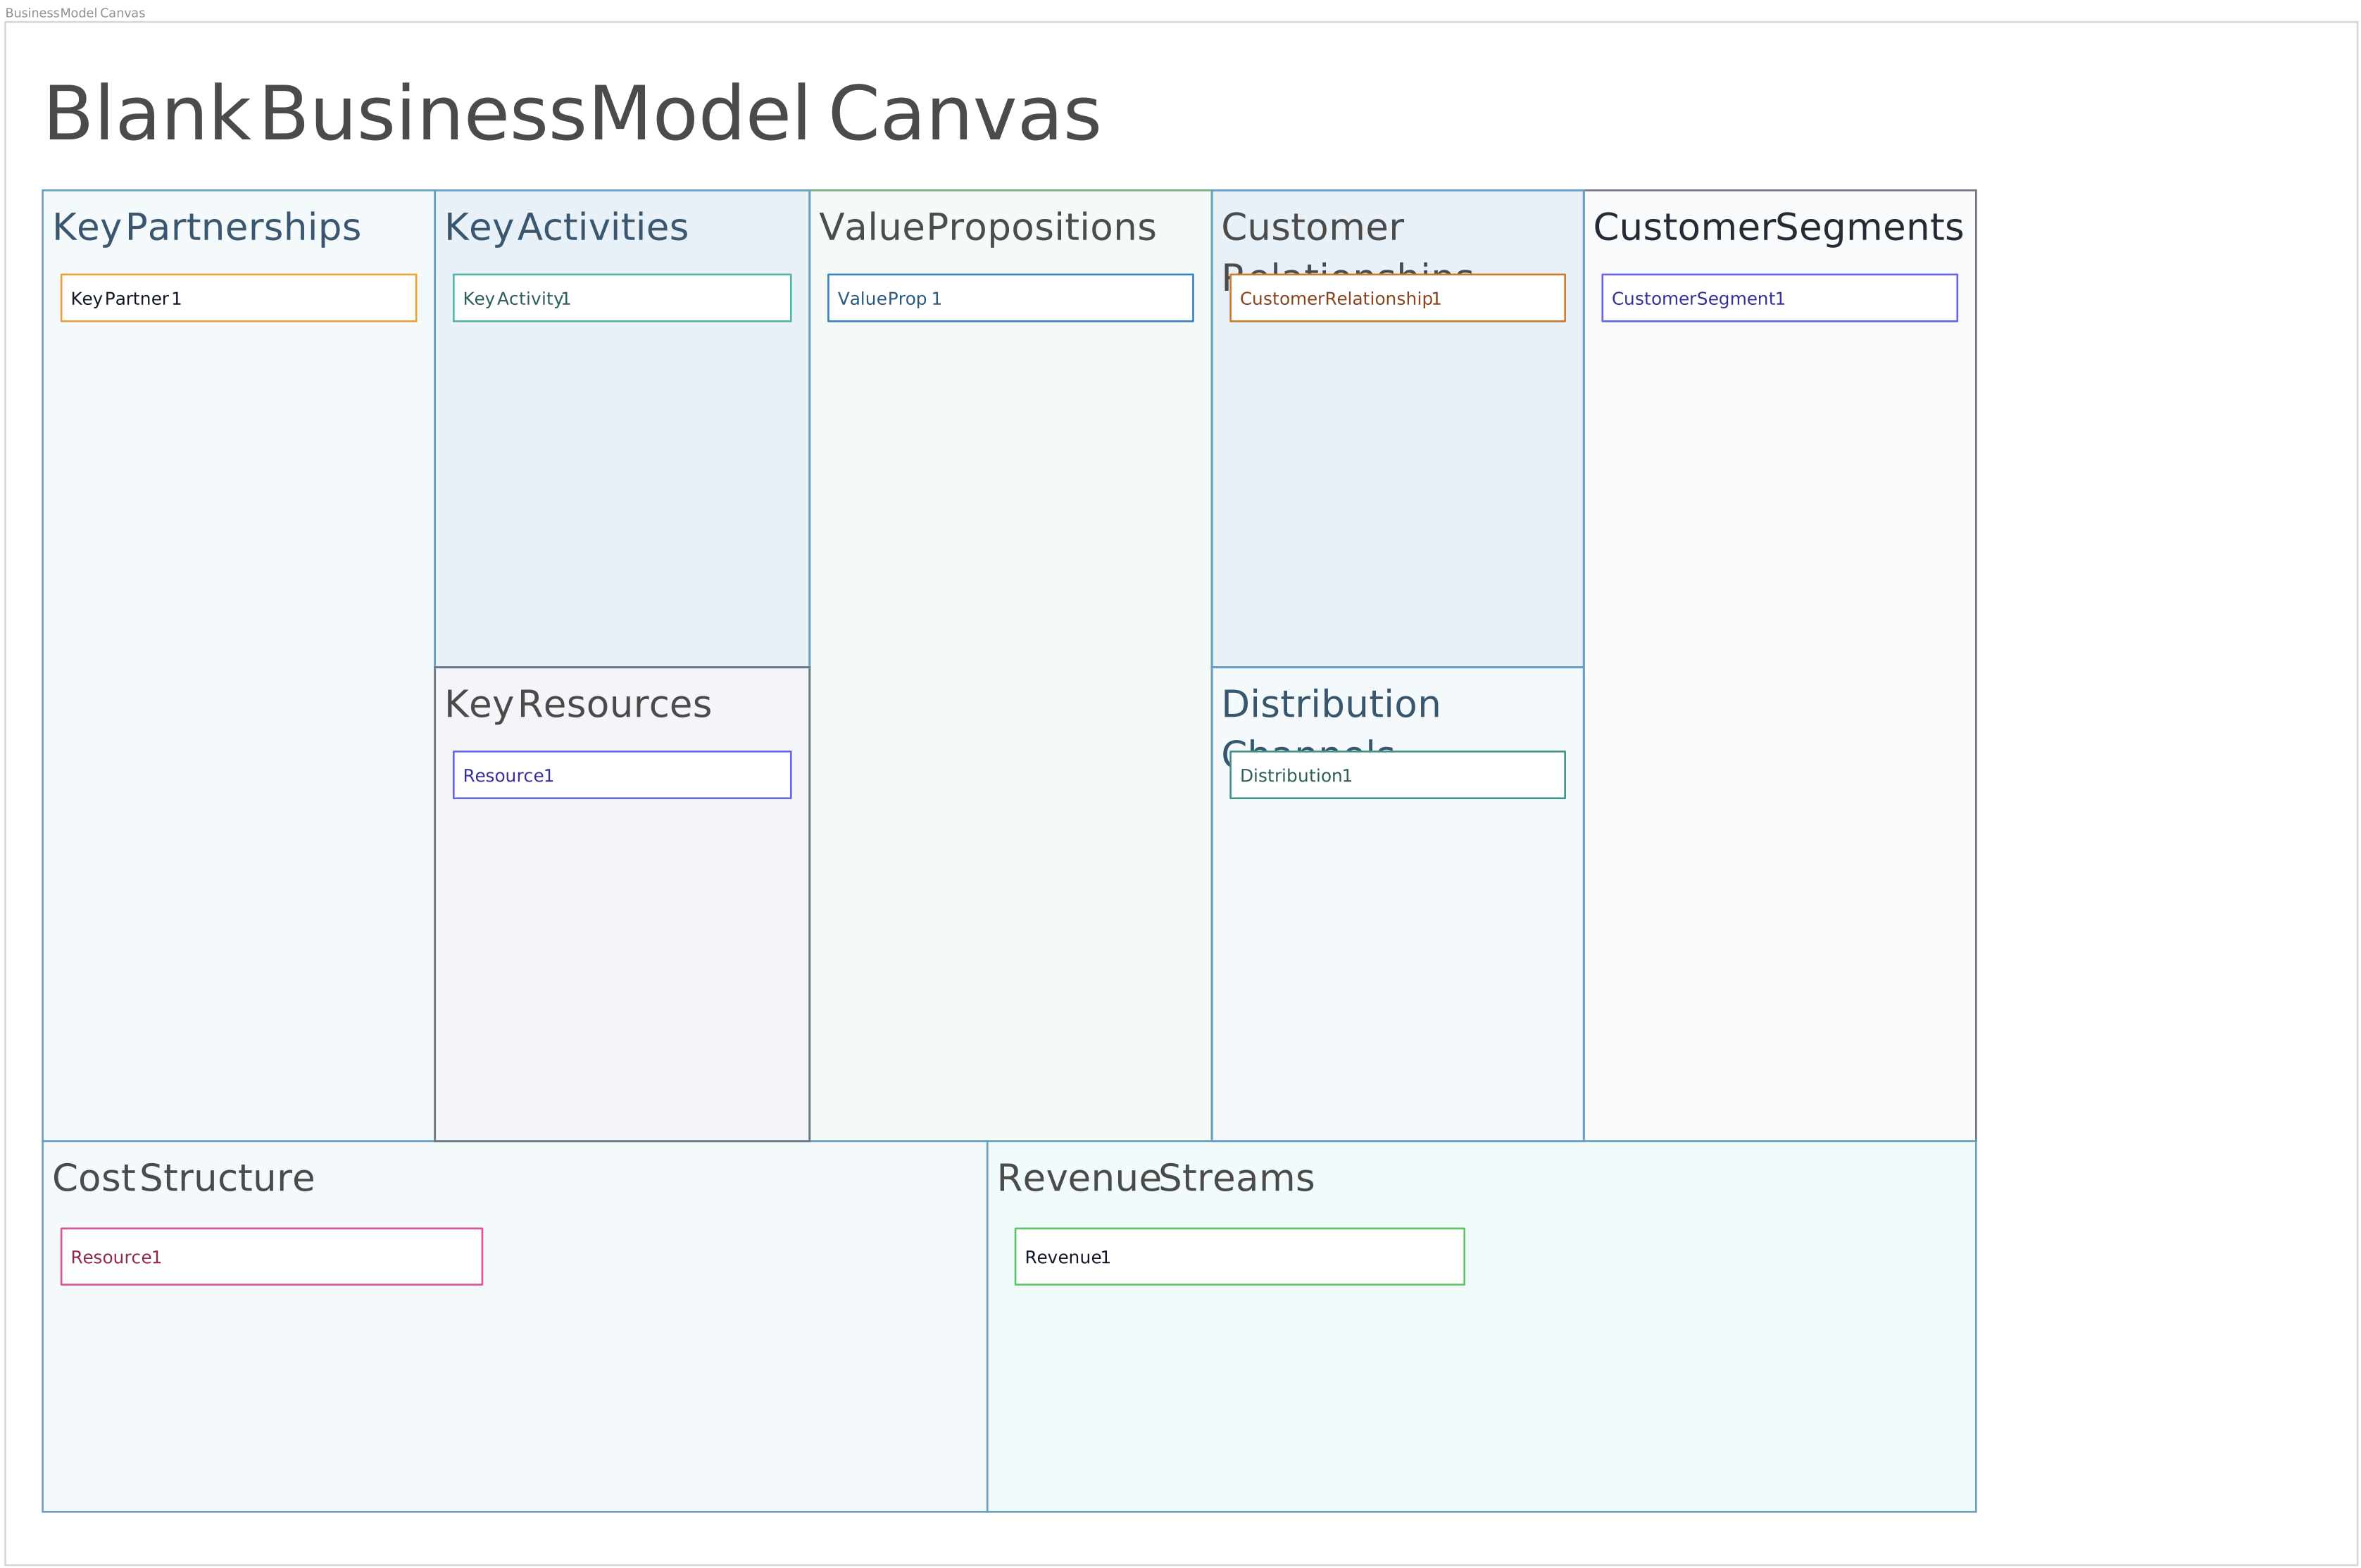

Here’s what the nine components typically include
- Customer Segments – Who are the target customers? This defines the different groups or segments of customers that the product serves.
- Value Propositions – What value does the product provide? This explains how the product solves customer problems or fulfills their needs.
- Channels – How is the product delivered to customers? This describes the ways the product reaches its customers, whether it’s through physical stores, online platforms, or partnerships.
- Customer Relationships – How do you interact with customers? This outlines the types of relationships the business establishes with its customers, such as self-service or personalized support.
- Revenue Streams – How does the business make money? This looks at the sources of revenue, like direct sales, subscriptions, or licensing.
- Key Resources – What assets are essential to the product? These include physical, intellectual, human, or financial resources needed to deliver the value proposition.
- Key Activities – What crucial activities must the business perform? These are the core processes that need to happen for the product to work, like software development or manufacturing.
- Key Partnerships – Who are the external companies or individuals that help? This includes suppliers, strategic alliances, or partners that help the business function.
- Cost Structure – What are the key costs involved in the business? This looks at the major costs of running the business, including fixed and variable costs.
Use it to
- Align the team: It provides a shared understanding of the product’s business model.
- Test and validate assumptions: It helps identify areas that need further research or validation.
- Iterate the business model: The canvas can be updated as the product or market evolves.
- Collaborate with stakeholders: It makes it easier to communicate with investors or partners.
- Guide decision-making: It helps prioritize resources and efforts based on the product’s strategy.
Resource:
Business model canvas template
2. Lean Canvas
The Lean canvas is a product management framework specifically designed to help startups and teams quickly map out and test the most critical aspects of their product or business model. It’s a simplified version of the business model canvas, focusing on what’s essential for early-stage product development.
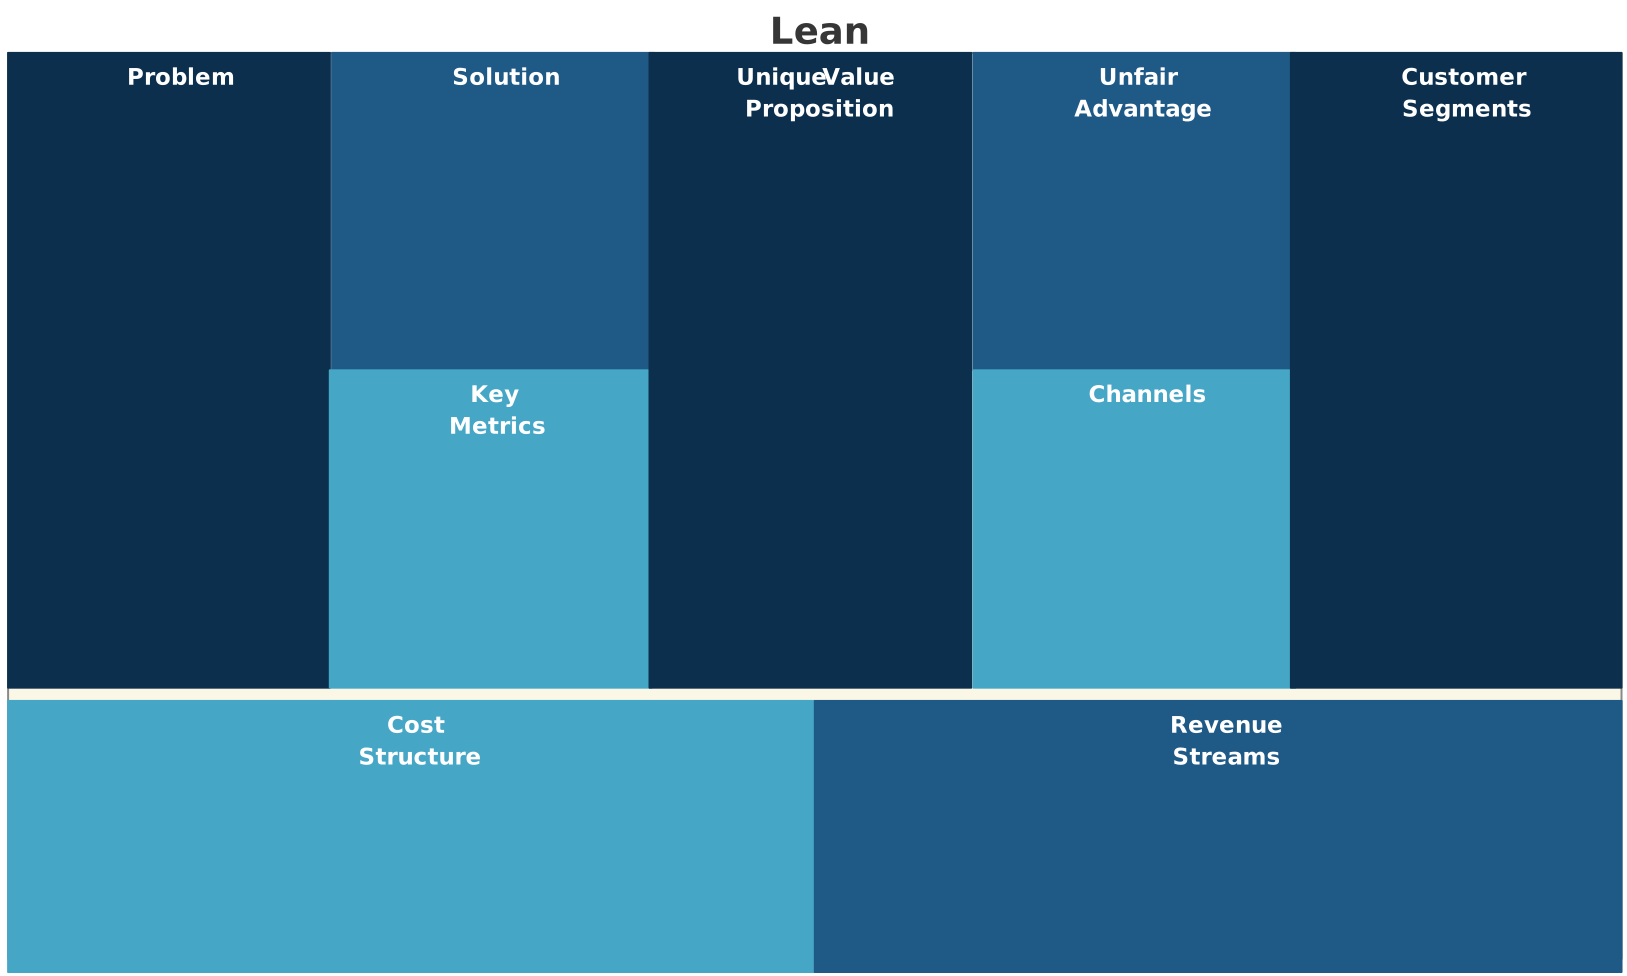
The Lean Canvas includes nine key components
- Problem – What is the core problem your product solves? This focuses on identifying the pain points your target customers are experiencing.
- Customer segments – Who are the customers facing this problem? This defines the different groups of people who would benefit from your solution.
- Unique value proposition – What makes your product stand out? This is a concise statement that explains why your product is different and better than alternatives.
- Solution – What is your product’s solution to the problem? This outlines the key features or services your product offers to address the identified problem.
- Channels – How will you deliver your solution to customers? These are the pathways through which you reach and communicate with your target customers.
- Revenue streams – How will your product make money? This focuses on the revenue model, such as subscriptions, one-time payments, or advertising.
- Cost structure – What are the major costs involved in building and delivering the product? This includes both fixed and variable costs.
- Key metrics – What key indicators will help you measure success? This highlights the metrics that are crucial for tracking the product’s progress, such as user growth or engagement rates.
- Unfair advantage – What unique aspect gives you a competitive edge? This is the factor that sets your product apart and makes it hard for competitors to replicate, such as a patent, a strong brand, or exclusive partnerships.
Use it to
- Quickly validate ideas: It allows teams to map out the key assumptions about their product in a concise format, enabling quick testing and validation.
- Focus on the essentials: The Lean canvas helps teams prioritize the most important elements of their business model, especially during the early stages.
- Refine product-market fit: By clearly understanding customer problems and solutions, teams can iterate and fine-tune their product to meet market needs.
- Communicate effectively: It’s a great tool for sharing ideas with stakeholders, investors, or team members in a simple, visual format.
- Track progress: The framework highlights key metrics to monitor, helping teams stay focused on achieving success and growth.
Resource:
3. Jobs to Be Done (JTBD)
Jobs to Be Done (JTBD) is a product management framework that focuses on understanding the underlying “jobs” that customers are trying to accomplish when they use a product or service. Instead of just looking at customer demographics or features, JTBD looks at the deeper reasons why people buy and use products, emphasizing their needs and desired outcomes. It’s about identifying the tasks customers are trying to complete and the problems they are trying to solve in their lives.
The core idea behind JTBD is that customers don’t buy products for the product itself—they “hire” products to get a specific job done. For example, when someone buys a drill, they aren’t looking for a drill; they want a hole in the wall. The job they want to accomplish is creating a hole, and the drill is just the tool to get that done.
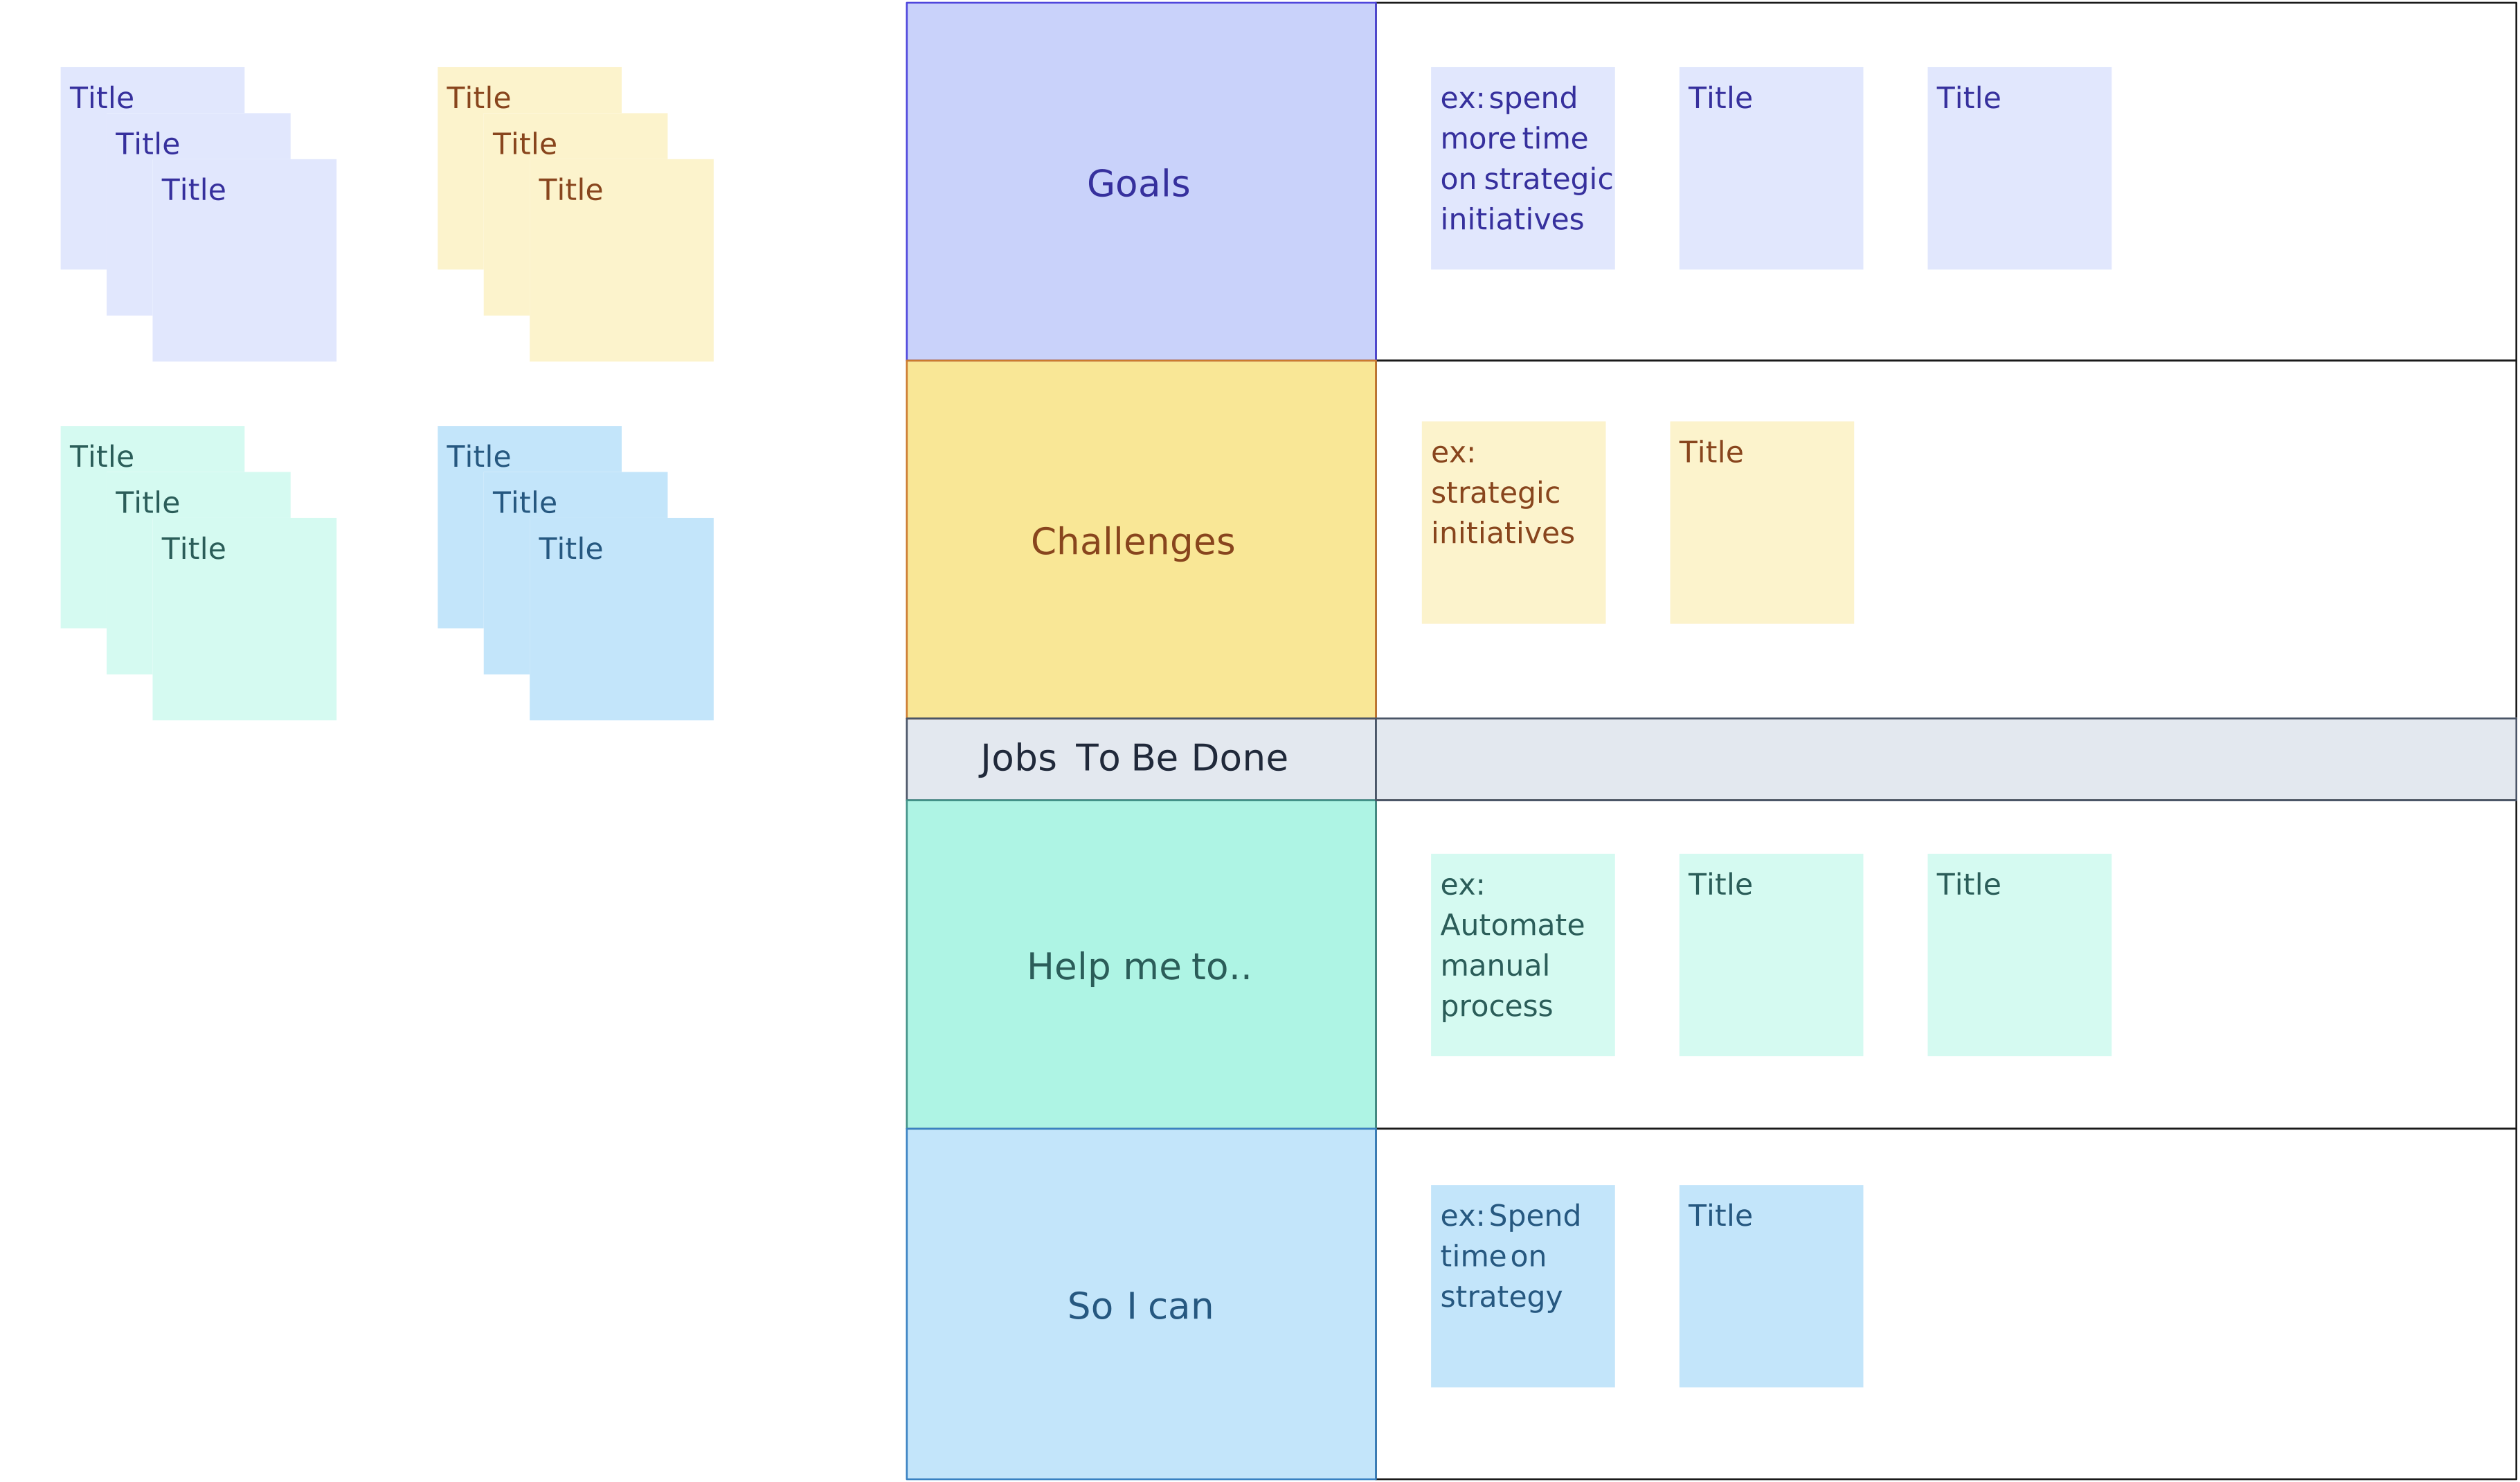
Key concepts of JTBD
- Job: The fundamental task the customer is trying to achieve.
- Job Executor: The person (or customer) trying to get the job done.
- Context: The situation in which the job needs to be completed.
- Desired Outcome: The result the customer wants to achieve once the job is done.
Use it to
- Understand customer motivations: JTBD helps teams focus on what customers are truly trying to achieve, not just their product features.
- Discover new opportunities: Identifying unmet jobs helps find opportunities for innovation.
- Align product features: Features should support the jobs customers are trying to complete, ensuring the product provides real value.
- Refine messaging: Knowing the job helps teams position the product based on how it helps customers, not just its features.
- Measure success: JTBD shifts focus to customer outcomes, such as job completion and satisfaction.
Resource:
4. SWOT Analysis
SWOT analysis is a simple but powerful framework used to evaluate the internal and external factors that can impact a product or business. It helps teams understand their strengths, weaknesses, opportunities, and threats in relation to their product, market, and competition.

SWOT components
- Strengths: What does the product or team do well? These are the internal advantages, such as unique features, strong customer loyalty, or effective processes.
- Weaknesses: What areas need improvement? This includes internal challenges, like limited resources, gaps in technology, or a lack of market awareness.
- Opportunities: What external factors could the product leverage? These are potential areas for growth, such as emerging trends, market gaps, or changes in customer behavior.
- Threats: What external factors could negatively impact the product? This could include competitors, changing regulations, or economic downturns.
Use it to
- Identify areas for improvement: By recognizing weaknesses, teams can take action to address gaps in resources or performance.
- Leverage strengths: Knowing the product’s strengths helps teams highlight and build upon these advantages to differentiate from competitors.
- Spot growth opportunities: Understanding market trends or customer needs helps product teams seize opportunities for innovation and expansion.
- Mitigate risks: By recognizing potential threats, teams can develop strategies to minimize risks, whether it’s strengthening defenses against competitors or adapting to external changes.
- Align strategy: SWOT helps teams create a clear and actionable strategy by focusing on what can be controlled (strengths and weaknesses) and what may affect the business externally (opportunities and threats).
Resources:
5. Porter’s Five Forces
Porter’s five forces is a framework that helps businesses analyze the competitive forces within an industry. Developed by Michael Porter, it identifies five key factors that influence competition and profitability in a market. Understanding these forces helps product teams make smarter decisions about product development, pricing, and strategy.
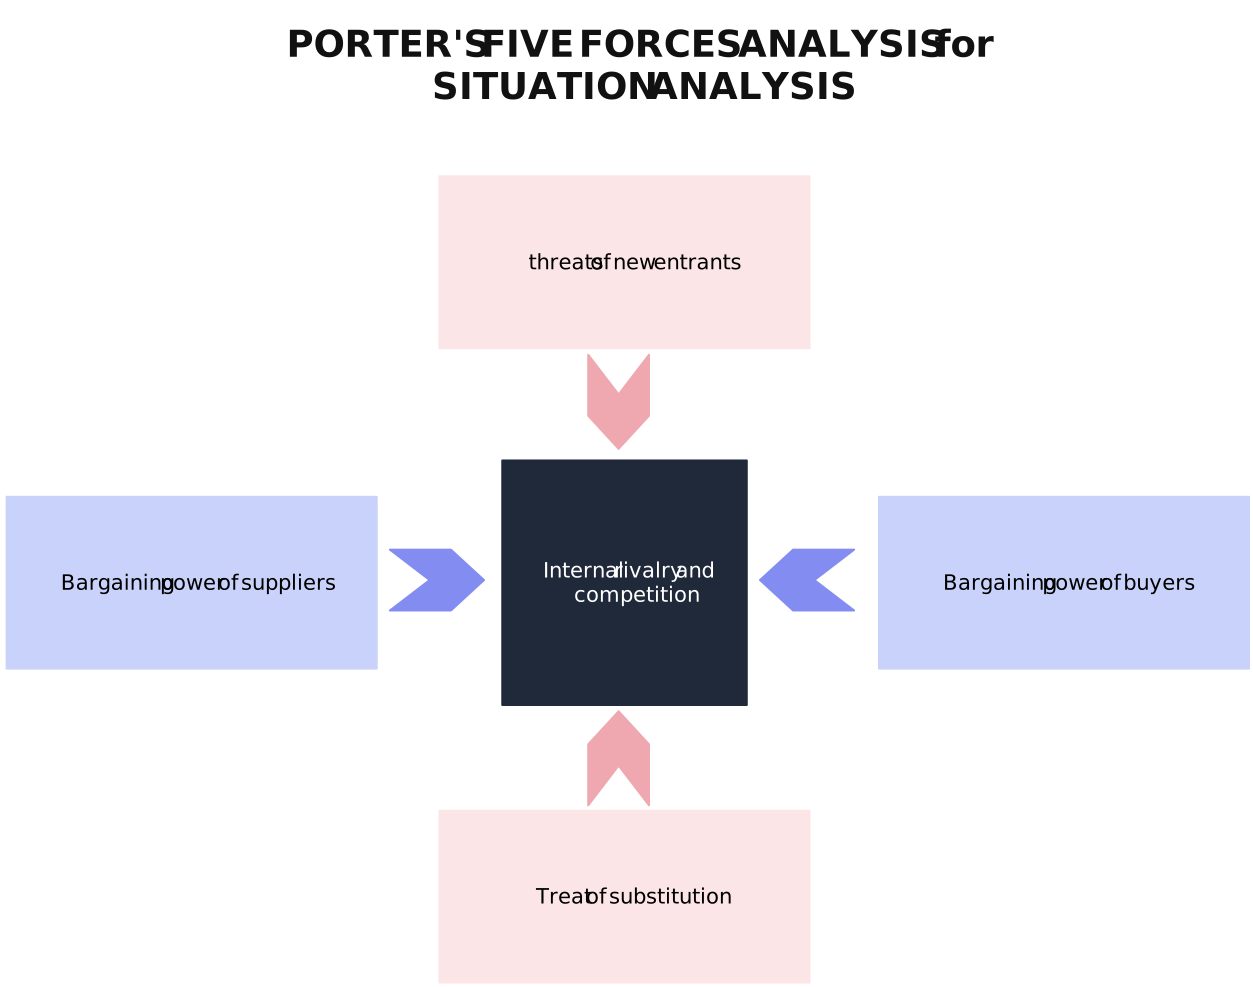
The five forces
- Threat of new entrants: How easily can new competitors enter the market? Low barriers lead to more competition.
- Bargaining power of suppliers: How much control do suppliers have over prices or supply?
- Bargaining power of buyers: How much influence do customers have on prices or product offerings?
- Threat of substitutes: How likely is it for customers to switch to alternative products?
- Industry rivalry: How intense is competition between existing market players?
Use it to
- Analyze competition: It helps teams understand the competitive pressures in the market.
- Shape strategy: If new entrants are a threat, teams can focus on building customer loyalty or exclusive features.
- Optimize pricing: If buyers have strong power, differentiation becomes key to reducing price sensitivity.
- Manage suppliers: Teams can find alternatives or negotiate better terms if suppliers have significant power.
- Plan for substitutes: Recognizing substitutes helps teams ensure their product remains valuable and unique.
- Monitor rivals: Understanding competition levels helps teams anticipate market changes and stay ahead.
Resource:
Porter’s five forces model template
6. Ansoff Matrix
The Ansoff matrix is a strategic tool that helps businesses decide how to grow by focusing on four key growth strategies: market penetration, product development, market development, and diversification. It provides a clear framework for evaluating different ways to expand and manage risk with regard to products.
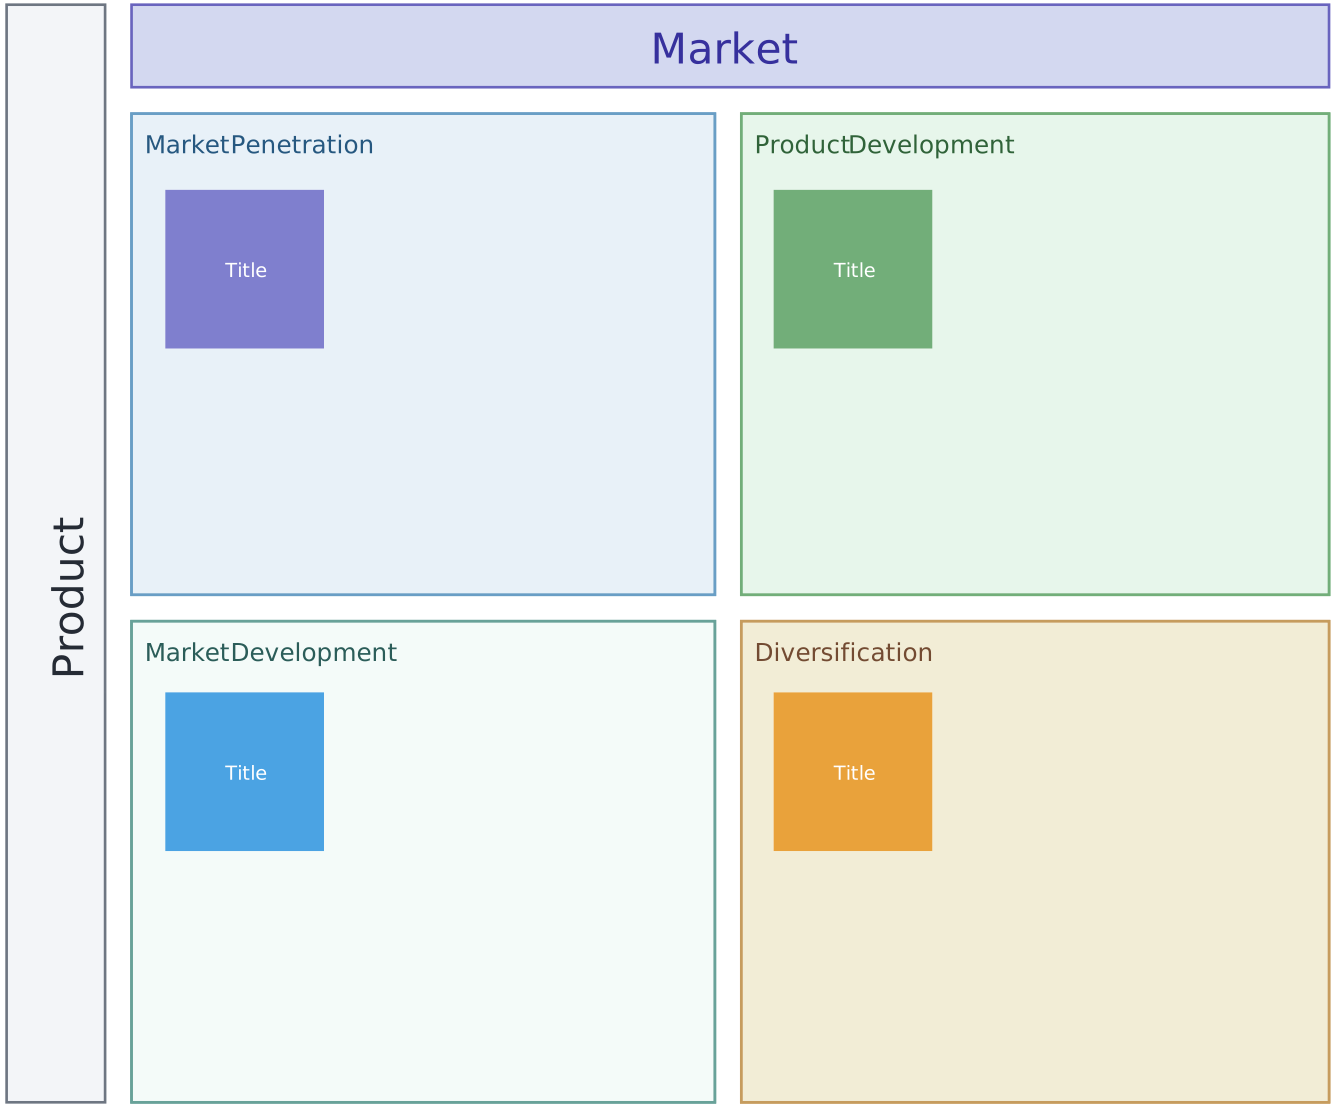
The four strategies in the Ansoff matrix
- Market penetration: This strategy focuses on increasing sales of existing products in existing markets. It’s about gaining more market share or encouraging customers to buy more. Examples include increasing marketing efforts or offering promotions.
- Product development: This involves creating new products or features for existing markets. The goal is to meet the changing needs of your current customers or attract new ones with a more innovative offering.
- Market development: This strategy focuses on entering new markets with existing products. It could involve targeting a different geographic area, a new customer segment, or using a new distribution channel.
- Diversification: This is the most risky strategy, where a business introduces new products in new markets. It requires a lot of research but offers potential for high growth, especially if the business wants to reduce dependence on existing markets.
Use it to
- Clarify growth options: It helps product teams clearly define where to focus their efforts—whether on improving current offerings, exploring new markets, or developing new products.
- Guide product strategy: By mapping out which strategy to pursue, product teams can make informed decisions on how to prioritize new product ideas or market efforts.
- Manage risk: The Ansoff matrix helps teams assess the level of risk associated with each strategy. For example, market penetration carries lower risk, while diversification involves more uncertainty but higher potential rewards.
- Align goals with company vision: By considering all four strategies, teams can choose the path that aligns with the company’s overall objectives, whether that’s steady growth or bold expansion.
Resource:
7. Product Portfolio Management
Product portfolio management is a framework used by businesses to manage and prioritize a collection of products or product lines. It helps teams balance the risks and rewards of different products, ensuring that resources are allocated effectively to meet business objectives. The goal is to make sure the product portfolio is well-aligned with the company’s strategy and that the right mix of products is developed to drive growth.
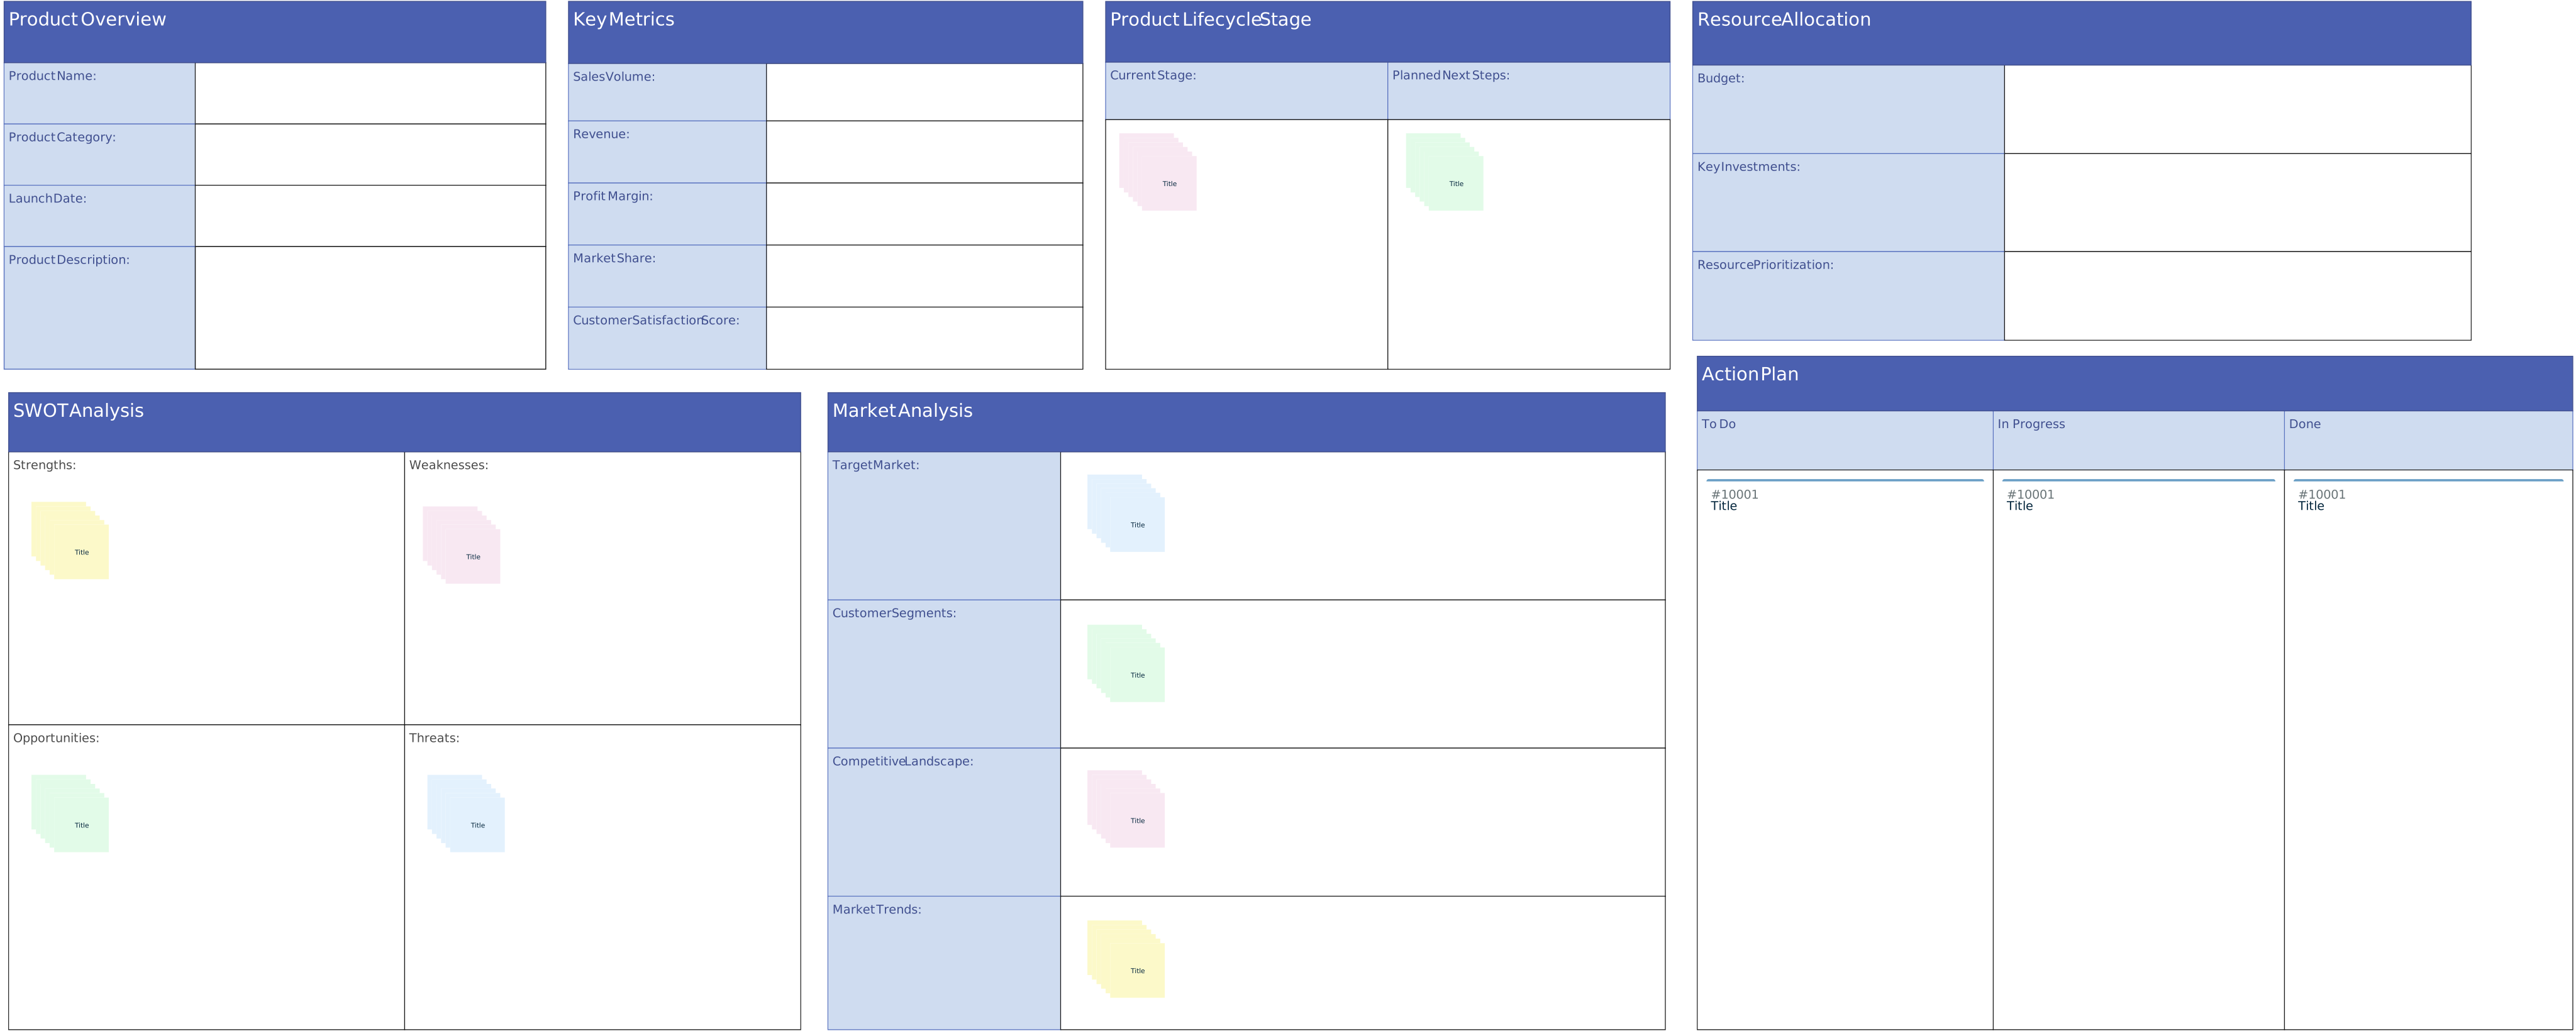
Use it to
- Prioritize investments: Product teams can evaluate their portfolio and decide which products deserve more attention or resources based on factors like market demand, profitability, or alignment with long-term strategy.
- Balance risk: A well-managed product portfolio includes a mix of high-risk, high-reward products (like new innovations) and low-risk, stable products (like existing best-sellers). This balance helps the team manage overall risk and ensure steady growth.
- Optimize resource allocation: By analyzing the portfolio, teams can allocate resources (time, money, and talent) to products that have the most potential for success, while scaling back on underperforming products.
- Track performance: Product teams can use portfolio management to track how well each product is performing, whether that’s in terms of revenue, customer satisfaction, or market share. This helps teams make data-driven decisions about future investments or product adjustments.
- Adapt to market changes: Portfolio management allows teams to react quickly to shifts in market trends or customer preferences by making adjustments to the portfolio, such as introducing new products or discontinuing outdated ones.
8. Product/Market Fit
Product/market fit is the concept of ensuring that a product meets the needs and desires of a specific target market. It’s when your product is not only solving a real problem but also delivering value in a way that customers love. Achieving product/market fit means that customers are eager to buy and use the product because it truly addresses their needs.
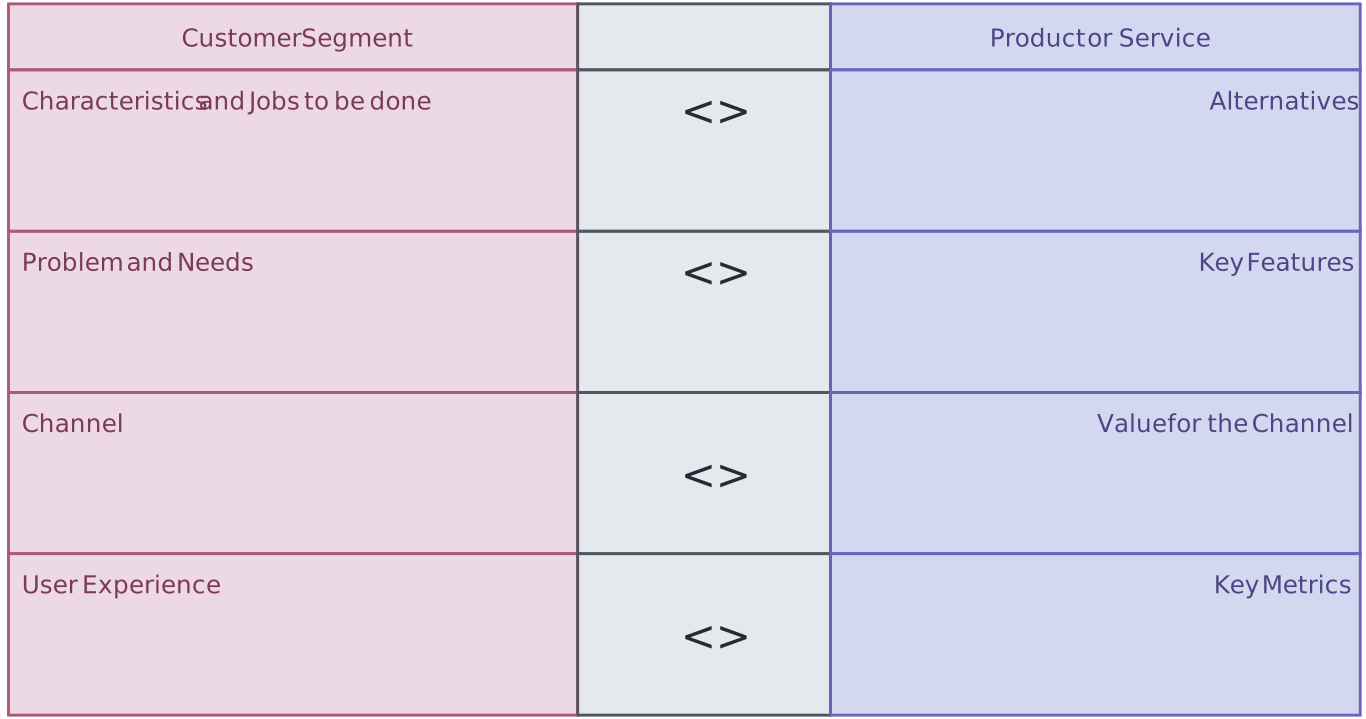
Use it to
- Understand customer needs: Product teams can focus on deeply understanding their target market’s pain points, desires, and behaviors. This ensures the product is designed to solve real problems.
- Measure customer feedback: Teams can gather feedback through surveys, user reviews, and interviews to gauge whether the product is truly meeting customer expectations. Signs of product/market fit include high customer satisfaction, repeat usage, and positive word-of-mouth.
- Iterate based on insights: Once the team has gathered feedback, they can refine the product to make improvements or adjust features. Achieving product/market fit often involves several iterations until the product resonates well with users.
- Focus on retention: Product teams should measure retention rates to see if users continue to use the product over time. High retention is a strong indicator that the product has found a good fit with the market.
- Align with business growth: Once product/market fit is achieved, product teams can scale up production, marketing, and sales efforts to take advantage of growing demand and expand the user base.
Resource:
Discovery and Ideation Product Management Frameworks
Discovery and ideation are crucial stages in product management, focusing on understanding user needs and generating innovative solutions. Implementing structured product management frameworks during these phases can significantly enhance the effectiveness of product development. Below are several key product frameworks designed to facilitate discovery and ideation:
9. Design Thinking
Design thinking is a problem-solving framework that focuses on understanding the needs of users, challenging assumptions, and redefining problems in order to come up with innovative solutions. It’s a human-centered approach that encourages product teams to think creatively and empathize with users to design products that truly solve their problems.
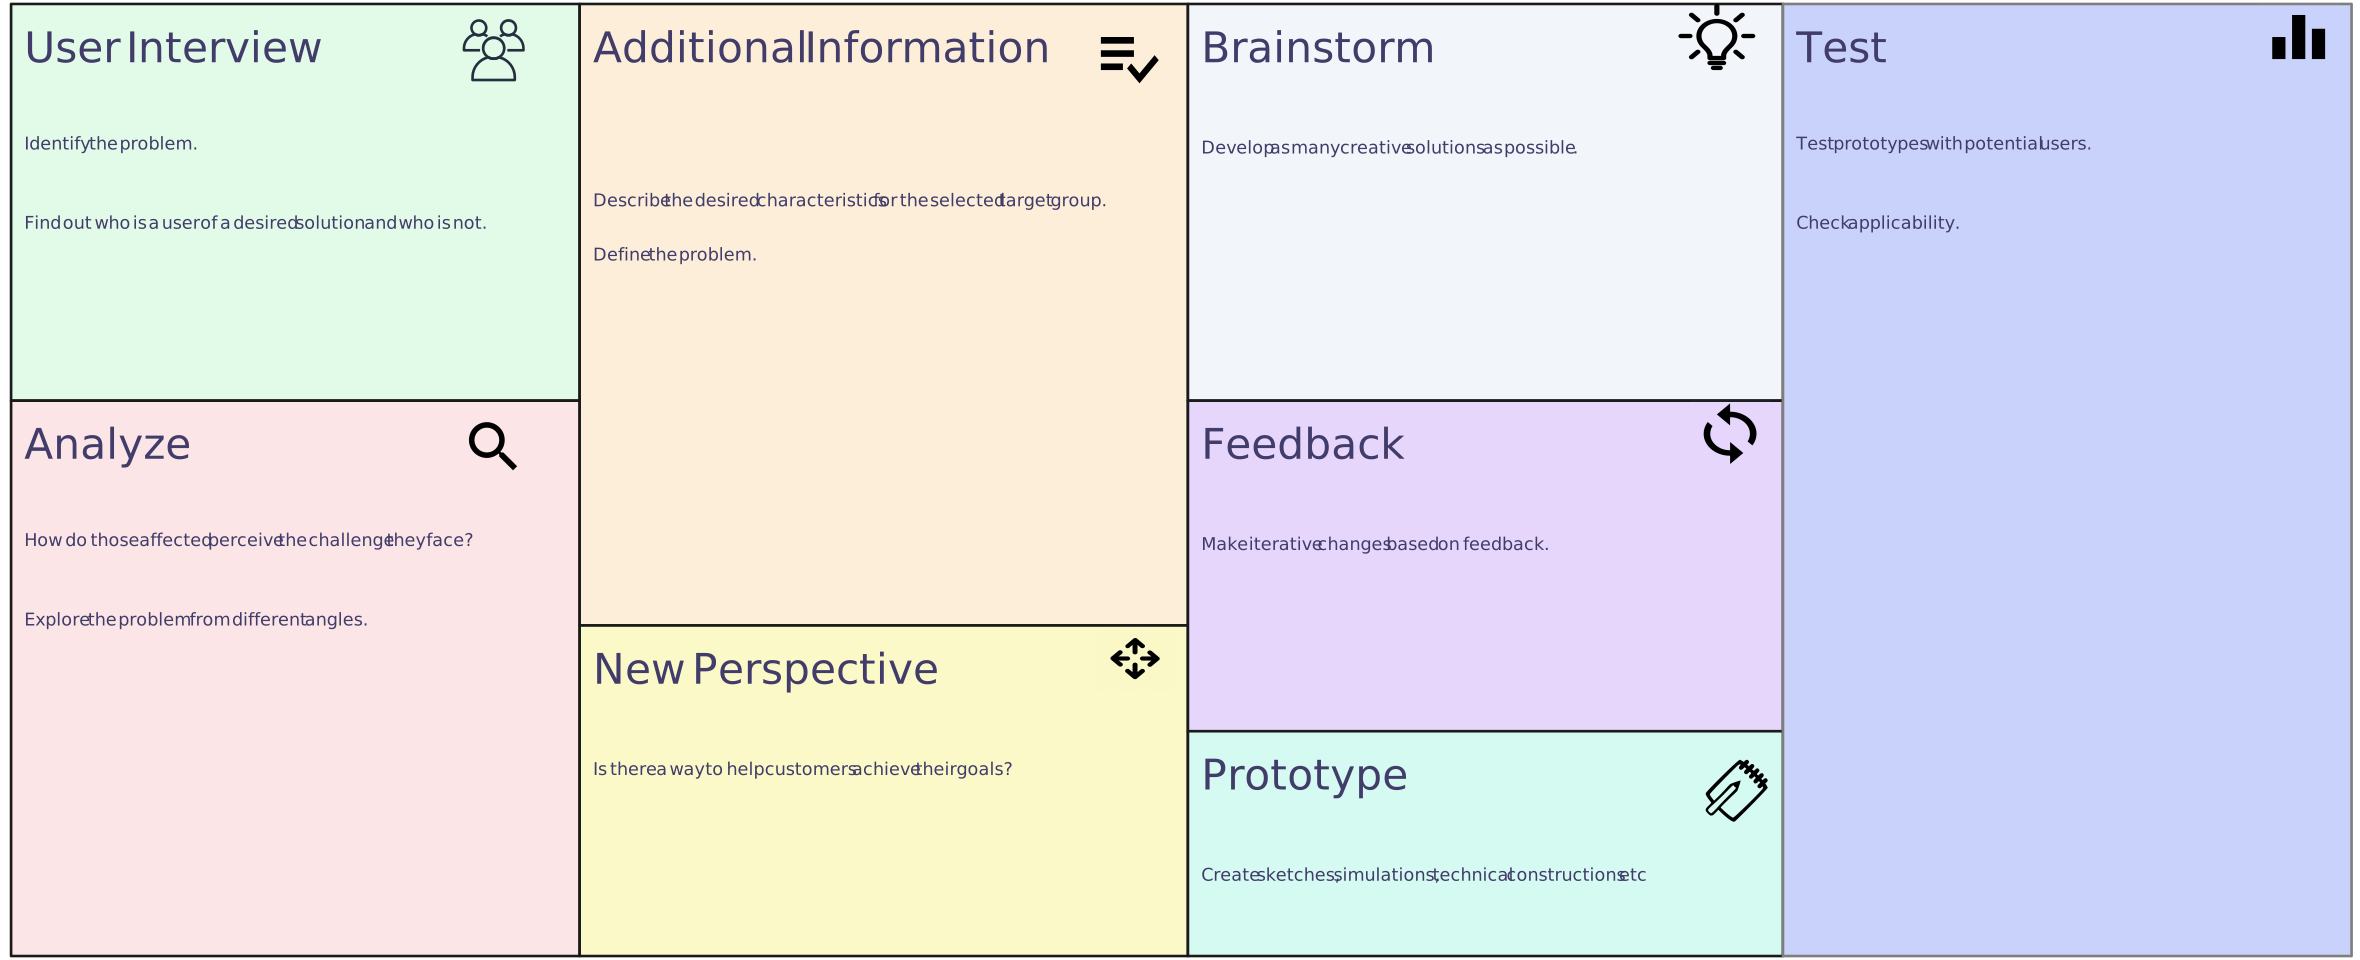
Use it to
- Empathize with users: The first step in design thinking is to deeply understand the needs, challenges, and behaviors of users. Product teams conduct user research through interviews, observations, and surveys to gather insights into what users truly need.
- Define the problem: After understanding the user’s needs, teams clearly define the problem they are trying to solve. This helps focus the team’s efforts on creating solutions that are aligned with what users actually need.
- Ideate solutions: Teams brainstorm creative ideas for solving the problem. Design thinking encourages thinking outside the box, exploring many different ideas, and collaborating with others to come up with innovative solutions.
- Prototype: Once ideas are generated, teams build prototypes—low-cost, simple versions of the product or feature. Prototypes allow teams to test and refine their ideas quickly before committing to full development.
- Test and iterate: The prototypes are tested with real users to gather feedback. Based on this feedback, the product team refines the product, making changes and improvements to better meet user needs.
Resources:
10. Double Diamond
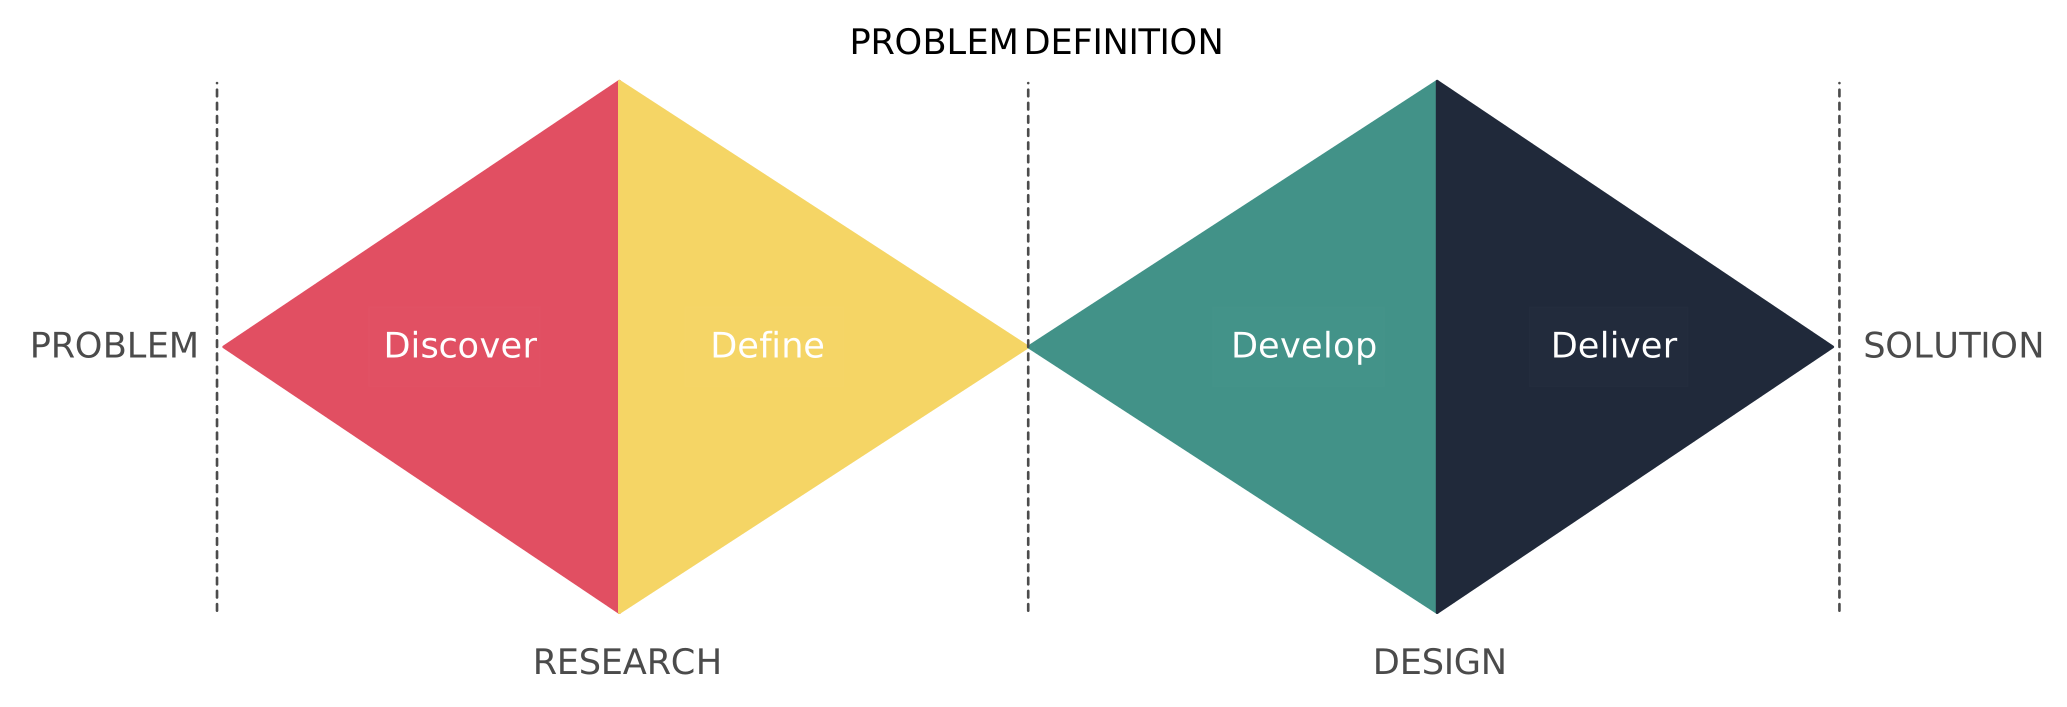
The double diamond model is a design process framework that emphasizes two key stages: discovery and delivery. It’s a visual tool used to guide product teams through the phases of understanding problems, generating ideas, and creating solutions. The model is divided into four phases: discover, define, develop, and deliver. It helps teams think broadly, then narrow down to find the best solutions, making it an ideal framework for developing user-centered products.
Use it to
- Discover: The first phase is about gathering insights and understanding the problem at hand. Product teams can conduct user research, interviews, and competitor analysis to deeply understand the users’ needs and customer pain points. This stage encourages wide exploration and gathering diverse information.
- Define: In the define phase, product teams analyze the data collected during discovery to narrow down the problem. This helps clarify what the actual challenge is and ensures the team is focused on solving the right problem. It’s about framing the problem clearly so the team can align on the goals.
- Develop: Once the problem is well-defined, teams move to the develop phase, where they brainstorm solutions. Here, multiple ideas are generated, and concepts are prototyped and tested. The goal is to explore a variety of solutions, allowing for flexibility and creativity.
- Deliver: In the final phase, product teams select the most promising solution, refine it, and bring it to life. This involves developing the final product, testing it with users, and preparing it for launch. Continuous feedback is important here to ensure the solution meets user needs and delivers value.
Resource:
11. CIRCLES
The CIRCLES framework is a product management tool designed to help teams systematically analyze product problems and make better product decisions. The acronym stands for Comprehend the situation, Identify the customer, Report the customer needs, Cut through prioritization, List solutions, Evaluate trade-offs, and Summarize the recommendations. This framework helps teams break down complex problems, prioritize user needs, and identify the most valuable solutions to pursue.
Use it to
- Comprehend the situation: Understand the problem by looking at business goals, market conditions, and challenges. This helps teams grasp the full picture before jumping to solutions.
- Identify the customer: Determine who the target users are and understand their needs, behaviors, and pain points. This ensures the product addresses the right problems.
- Report the customer needs: Clearly define what customers need by gathering insights from user research like surveys and interviews.
- Cut through prioritization: Decide which needs to focus on based on impact, urgency, and feasibility. This ensures the team tackles the most important issues first.
- List solutions: Brainstorm potential solutions for the prioritized needs. This step encourages creativity and explores all options.
- Evaluate trade-offs: Assess the pros and cons of each solution, considering factors like cost, time, and resources. This helps determine the best option.
- Summarize the recommendations: Present a clear summary of the best solution, explaining why it’s the best choice based on customer needs, business goals, and trade-offs.
12. Lean Startup
The Lean startup framework is a method for developing businesses and products that focuses on building a minimum viable product (MVP), testing it in the market, and using feedback to improve it quickly. The goal is to reduce the time and resources spent on untested ideas by creating a product in small steps, learning from real user feedback, and iterating to find what works. This approach helps teams avoid building something that no one wants and ensures the product is continuously refined based on actual data.
Use it to
- Build an MVP: Instead of waiting to launch a fully developed product, start by creating a basic version with only the core features needed to solve the problem. This allows the team to quickly test assumptions and gather user feedback.
- Test with real users: Once the MVP is built, release it to a small group of target users. Collect feedback through surveys, interviews, and usage data to understand how well the product addresses their needs and where improvements are needed.
- Measure success: Establish clear metrics to measure the product’s success, such as user engagement, retention, and satisfaction. This data helps product teams decide whether to pivot, persevere, or discontinue the product.
- Learn and iterate: Use the feedback and data collected from testing to make improvements. This may mean refining the product’s features, adjusting its target audience, or even changing the entire direction based on what users really want.
13. Opportunity Solution Tree
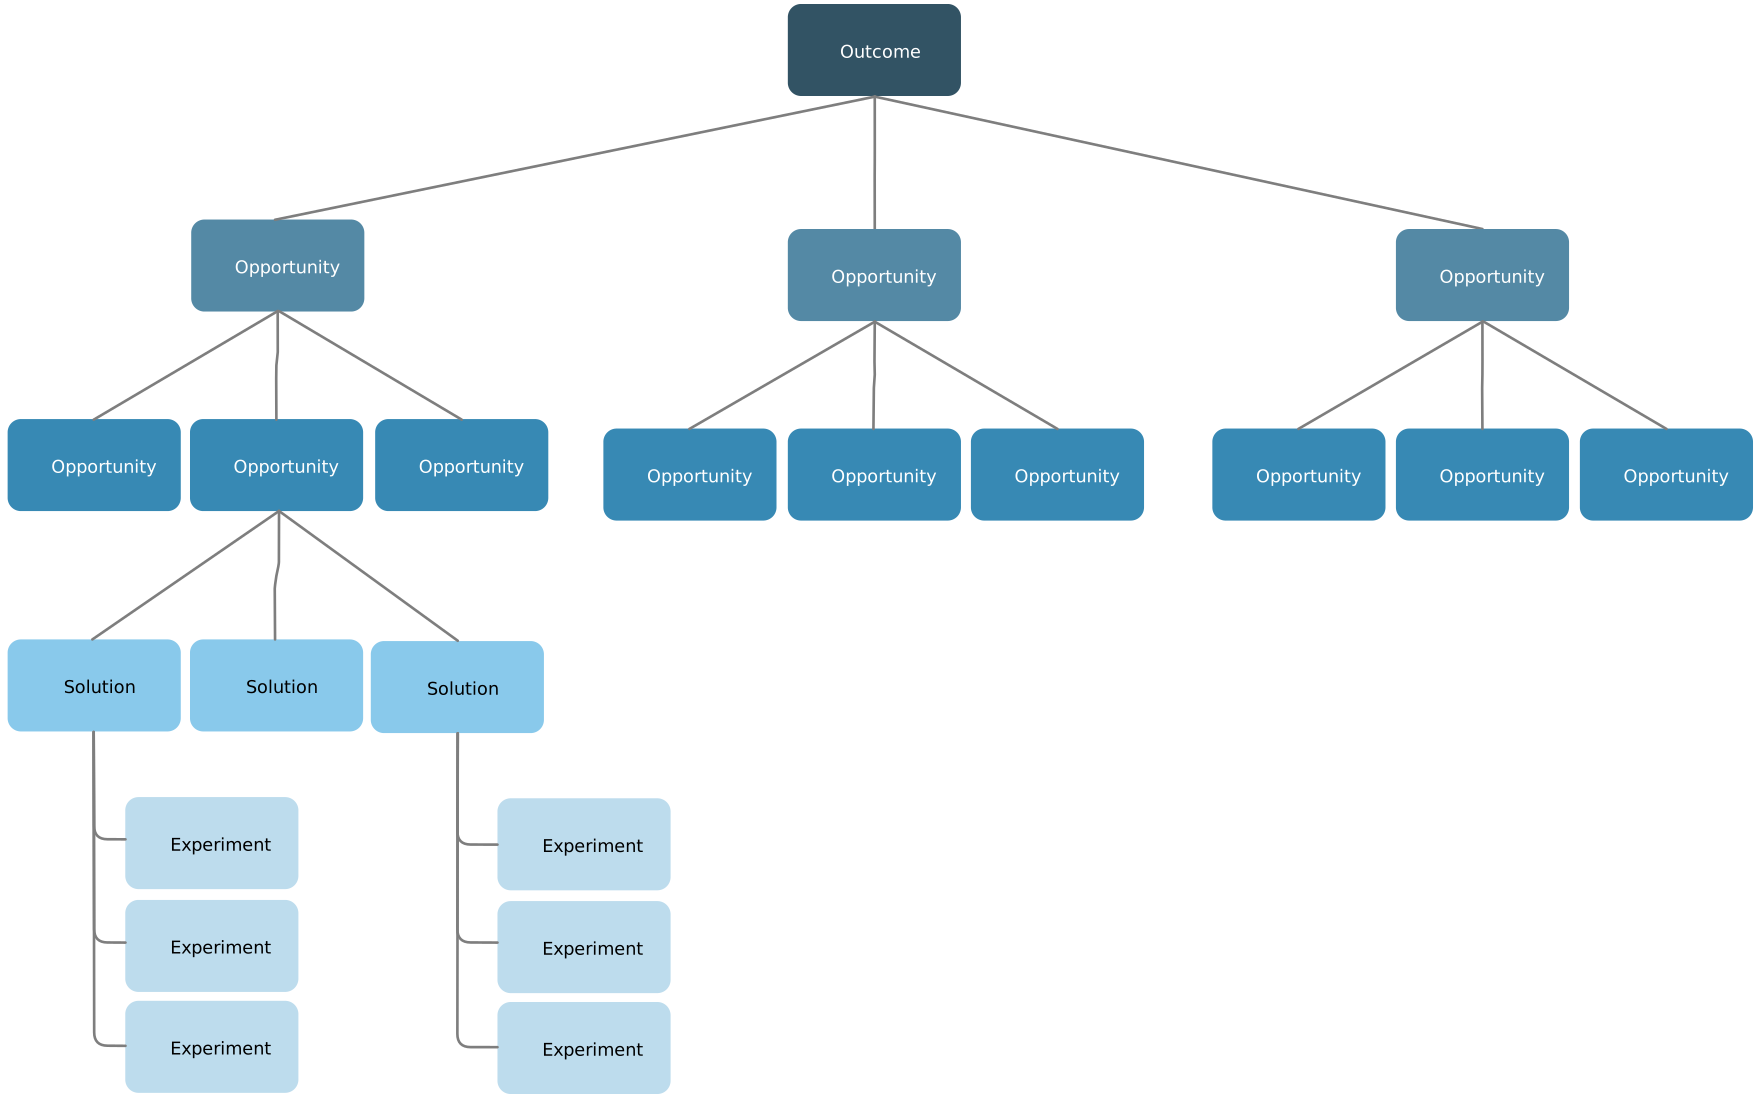
The opportunity solution tree is a product management framework that helps teams explore and visualize different opportunities and solutions to address a user problem. The framework allows teams to break down a high-level goal into smaller, actionable opportunities and then evaluate different solutions for each opportunity. It ensures that product teams stay focused on solving the right problem while providing a clear pathway to create the best possible solutions.
Use it to
- Define the desired outcome: The first step is to clearly define the overall goal or outcome the product team wants to achieve. This could be increasing user retention, improving customer satisfaction, or solving a specific pain point for users.
- Identify opportunities: Once the goal is set, product teams explore different opportunities that could lead to achieving that goal. These opportunities are potential areas where improvements can be made or new features can be developed. Teams should use user feedback, market research, and data to uncover opportunities.
- Generate possible solutions: For each identified opportunity, teams brainstorm different solutions. These solutions should be diverse, creative, and focused on addressing the specific user problem or opportunity. At this stage, no idea is too small or too big to consider.
- Evaluate solutions: The next step is to assess the feasibility and potential impact of each solution. Product teams evaluate solutions based on factors like cost, resources, and alignment with the overall goal. They also consider whether the solution will truly address the opportunity and bring value to the user.
- Test and iterate: After selecting the best solutions, product teams create prototypes or minimum viable products (MVPs) to test with real users. Feedback from testing helps teams refine their solutions and ensure they are on the right track.
Resources:
Prioritization Product Management Frameworks
Prioritization frameworks are essential tools in product management, helping teams decide which features or tasks to focus on to maximize value and efficiency. By systematically evaluating and ranking initiatives, these frameworks ensure that resources are allocated to the most impactful areas. Below are several widely used prioritization product management frameworks:
14. RICE Framework
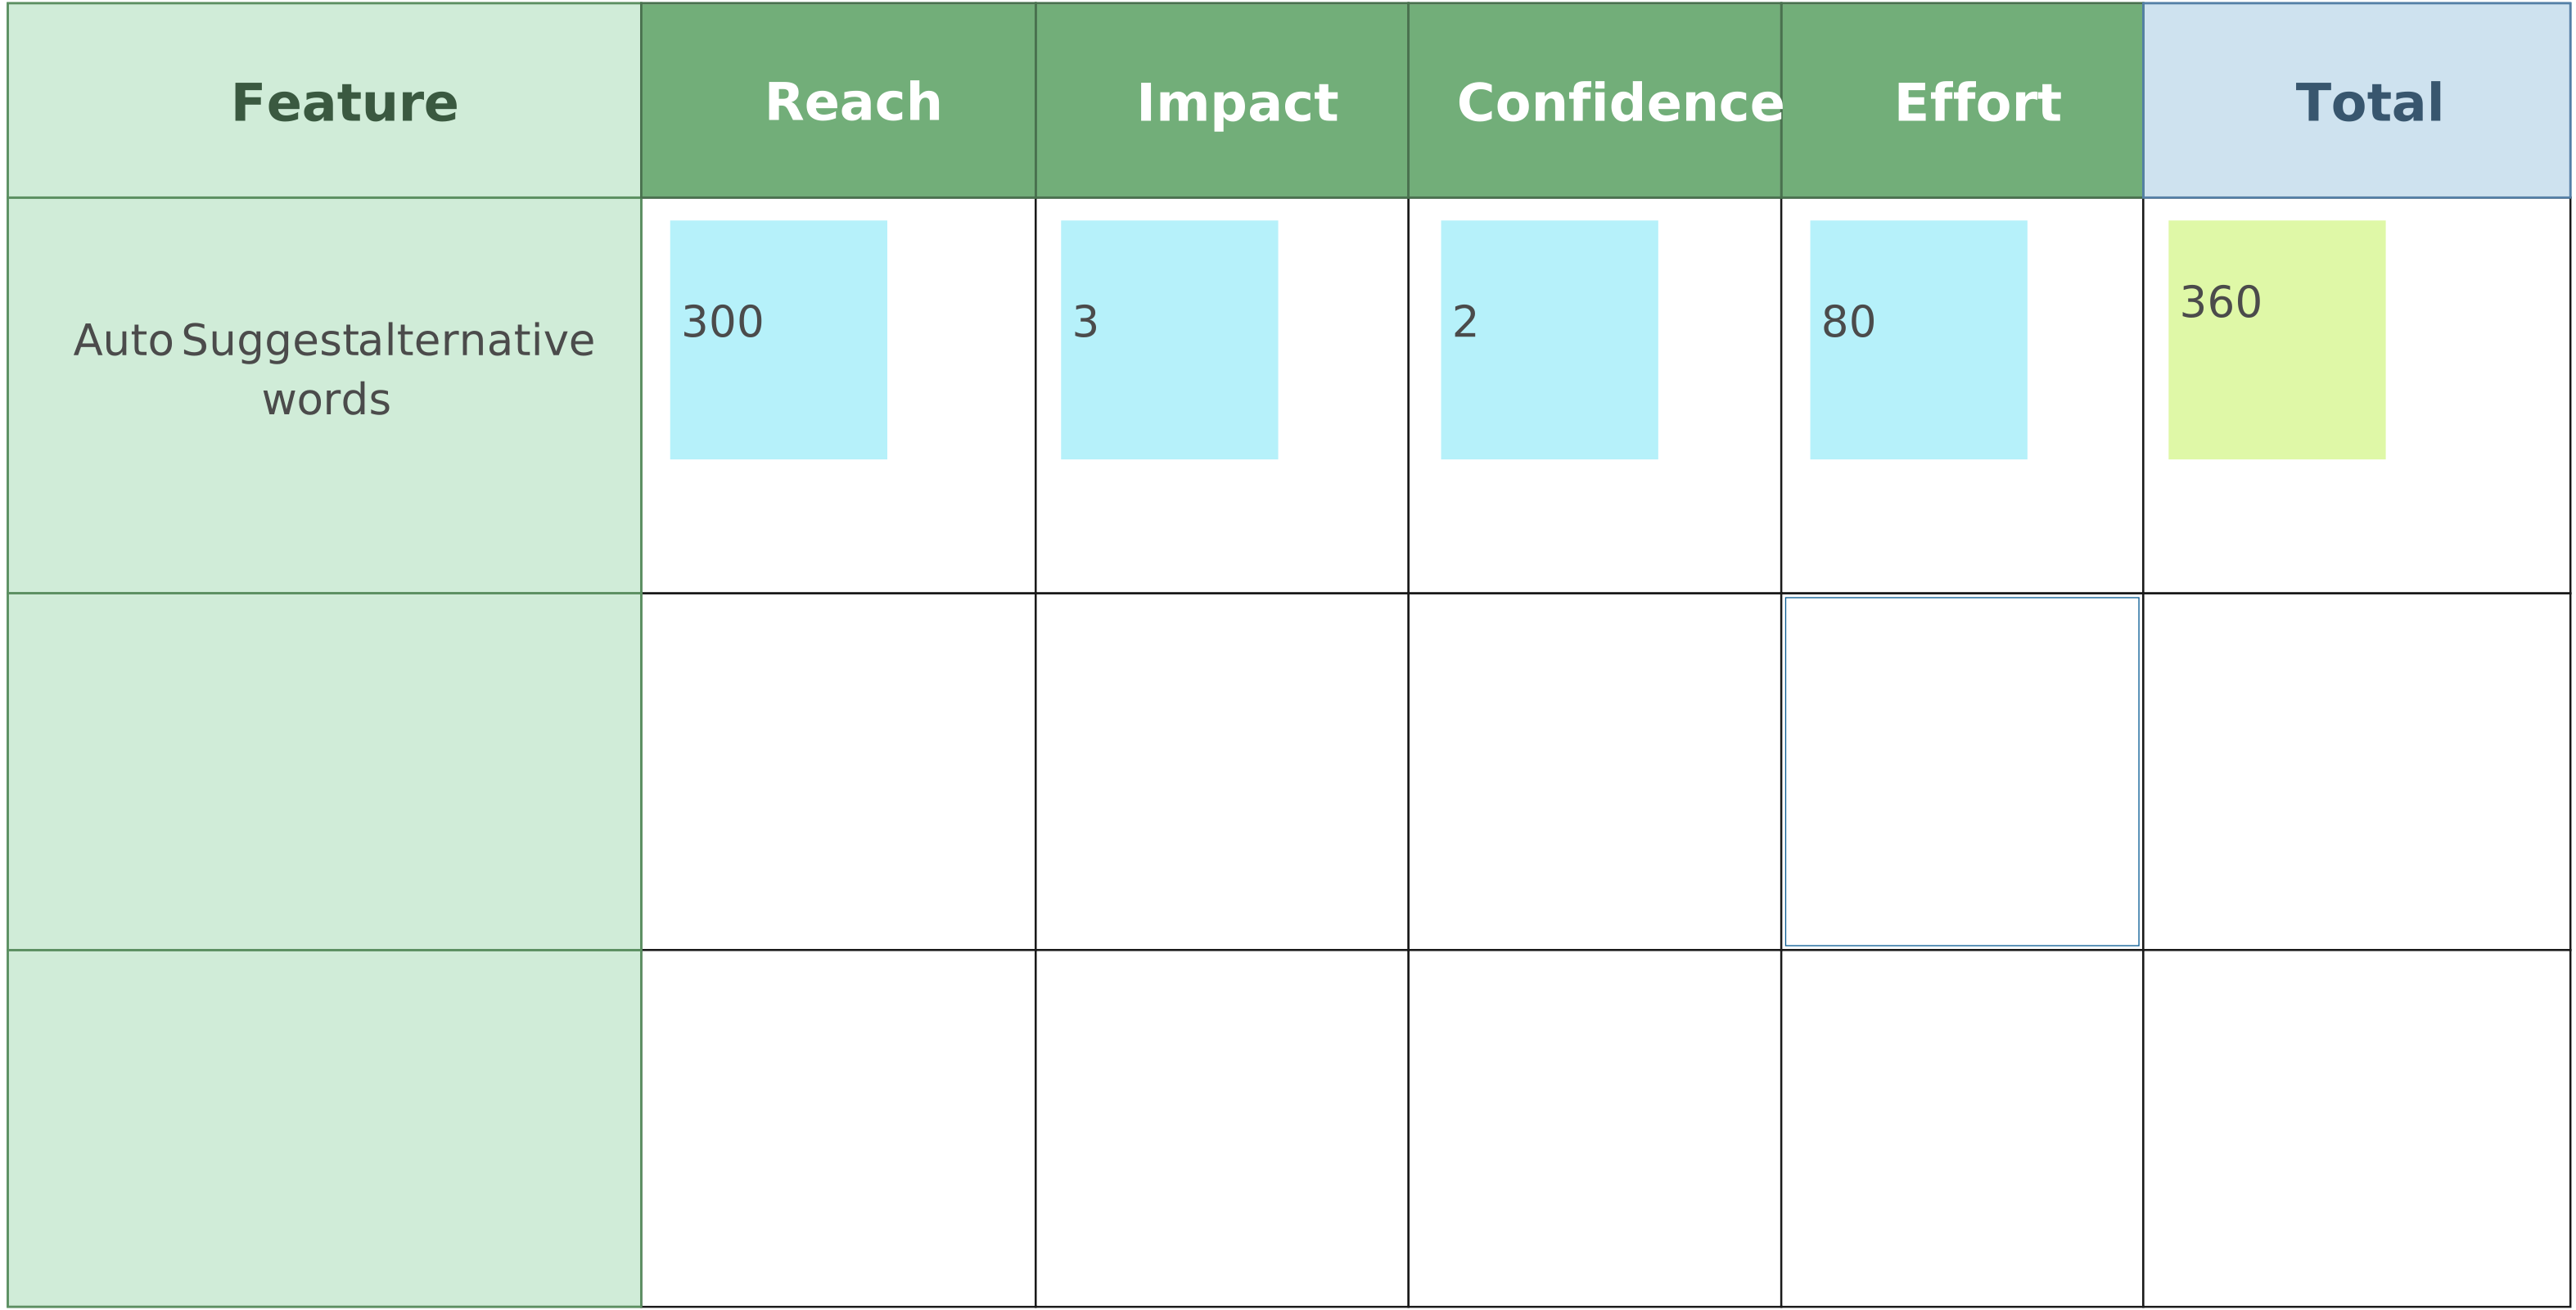
The RICE framework is a prioritization method used in product management to help teams evaluate and compare different features or initiatives. It stands for Reach, Impact, Confidence, and Effort. The framework helps product teams make decisions about where to focus their resources by scoring initiatives based on these four factors. This allows teams to prioritize features that will have the most significant positive impact on users and the business.
How to use it
- Reach: This factor measures how many people will be affected by the feature or initiative. It could be the number of users, customers, or segments that will benefit from it in a given time frame. For example, if you’re launching a feature for a large customer base, it would have a high reach.
- Impact: Impact estimates how much the feature will improve the user experience or business goal. It is typically rated on a scale, such as 1 to 3, where 3 means a significant impact and 1 means a minor impact. Teams assess whether the feature solves a major problem or adds significant value.
- Confidence: This factor represents how sure the team is about the estimates for reach, impact, and effort. It considers how much data, user feedback, or research backs up the team’s assumptions. A high-confidence feature has strong evidence supporting its success, while a low-confidence feature is based on less reliable data.
- Effort: Effort measures the amount of time, resources, and work required to implement the feature. It’s typically rated in “person-months” or other units of effort to determine how much work is involved. Features that require less effort but still have a high impact are prioritized over more resource-intensive ones.
Resource:
15. MoSCoW Method
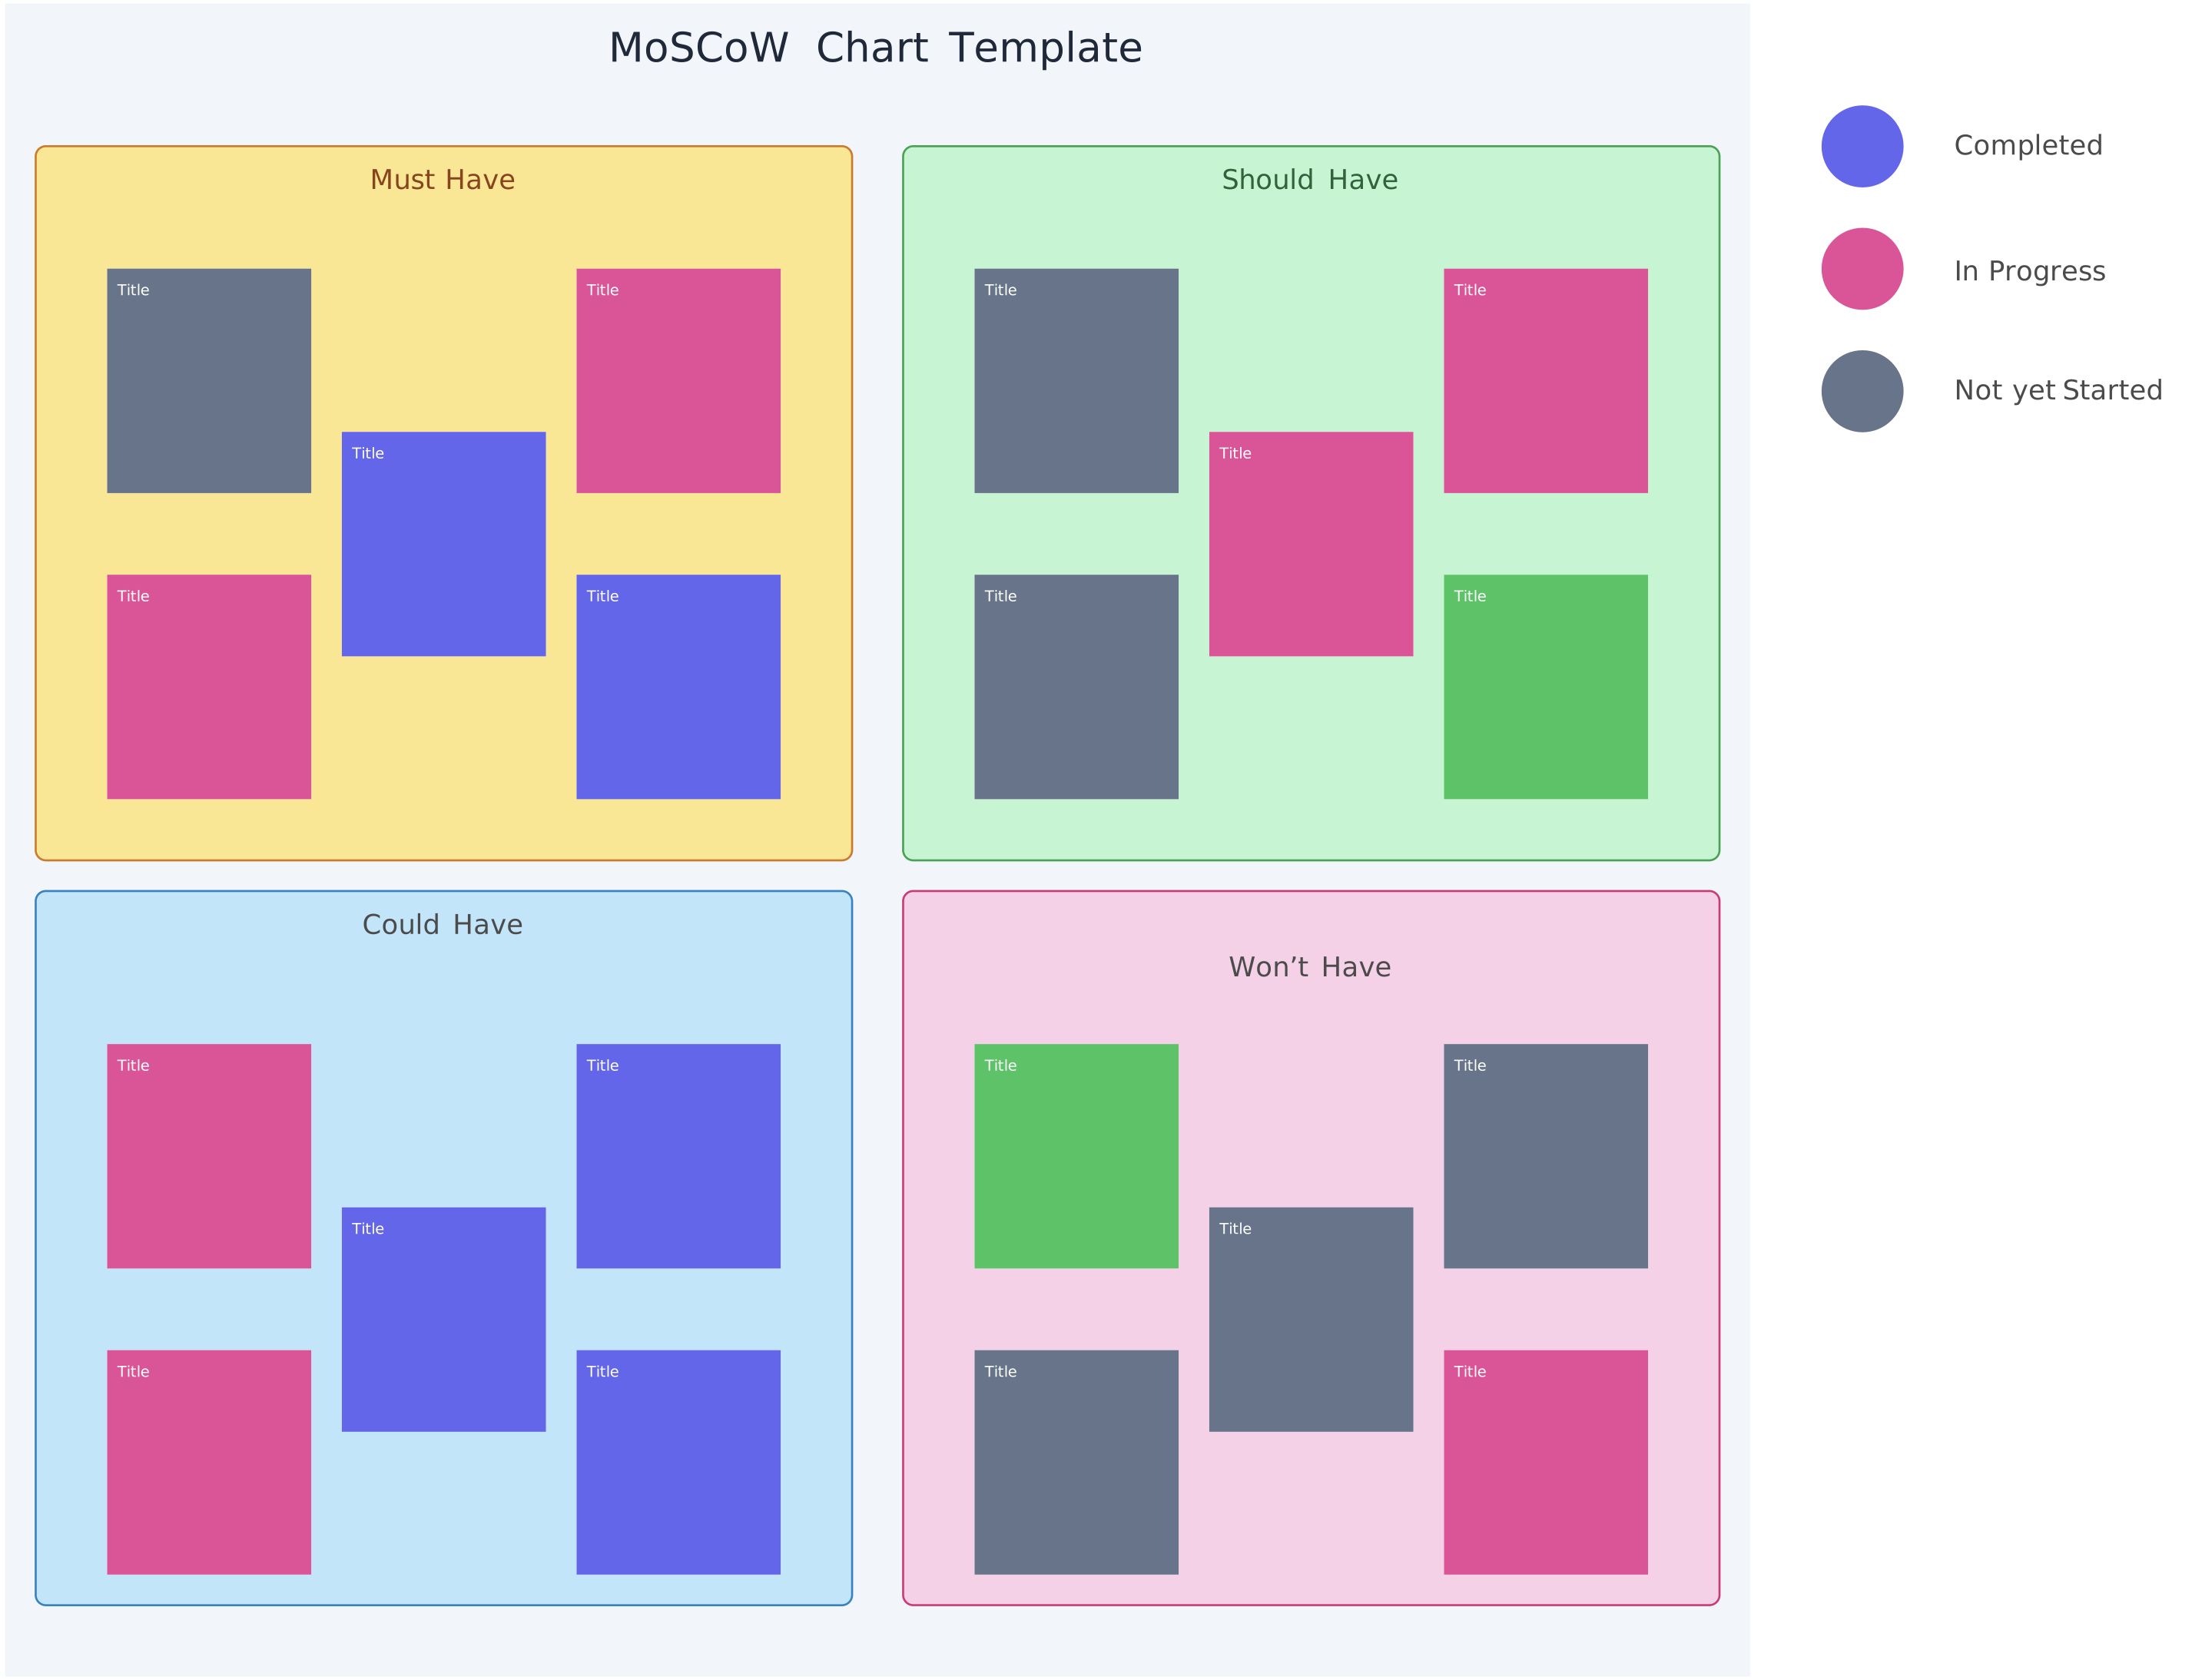
The MoSCoW method is a prioritization technique used to help product teams decide which features or tasks should be focused on first. The method categorizes items into four groups: Must have, Should have, Could have, and Won’t have. By clearly defining priorities, product teams can ensure they are working on the most important tasks and aligning with business goals, while also managing stakeholder expectations.
How to use it
- Must have: These are the features or tasks that are critical to the product’s success and must be included. Without them, the product won’t be viable or meet user needs. These should be prioritized above everything else.
- Should have: Features in this category are important but not essential for the product to function. They provide significant value but can be delivered after the must-have items are completed.
- Could have: These are nice-to-have features that would add extra value but are not crucial for the product’s core functionality. They can be postponed if time or resources are limited.
- Won’t have: These are features or tasks that are not needed in the current product iteration. They may be considered in the future but are not a priority right now.
16. Kano Model
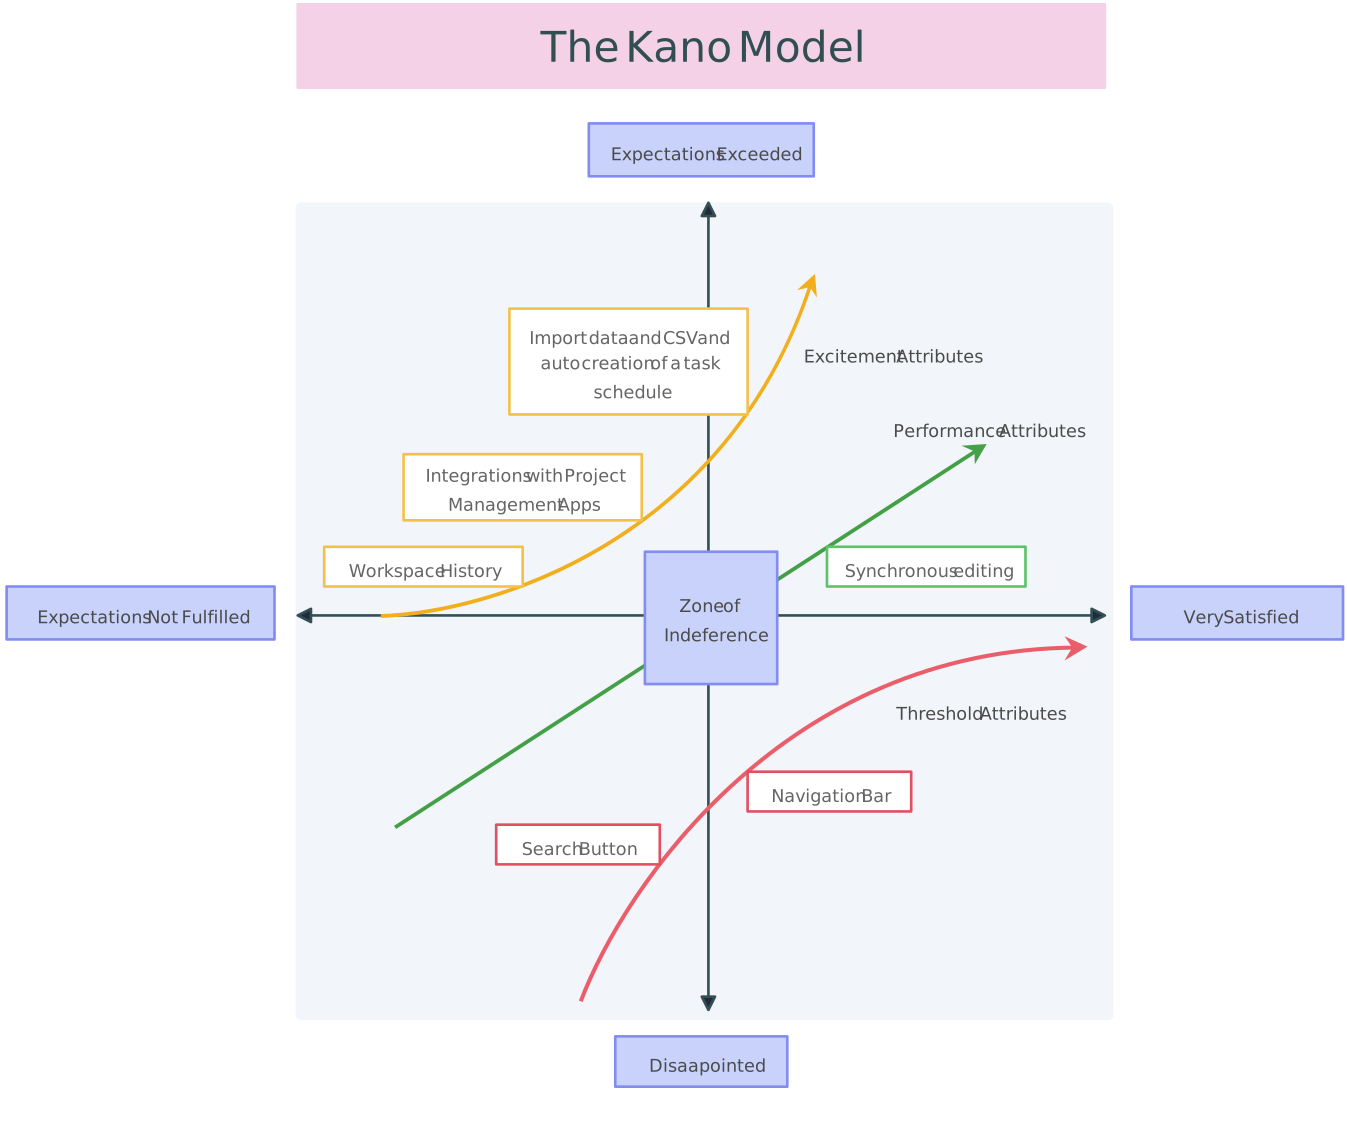
The Kano model is a framework that helps product teams prioritize features based on customer satisfaction and how they impact user experience. It categorizes features into five different types based on how they influence customer happiness, helping teams decide which features will have the greatest impact.
How to use it
- Basic needs: These are the features that customers expect as a minimum. If these features are missing or poorly implemented, users will be dissatisfied. However, simply meeting these expectations does not increase satisfaction—it’s just the baseline.
- Performance needs: Features in this category directly affect customer satisfaction. The better the feature works or the more of it there is, the more satisfied users will be. For example, faster performance or more functionality can lead to higher satisfaction.
- Excitement needs: These are features that delight users and provide a positive surprise. They are not expected, but when users experience them, it enhances their satisfaction significantly. These features can differentiate the product in the market and create strong loyalty.
- Indifferent needs: These features don’t have much impact on customer satisfaction, whether they are present or not. While they may be useful to some users, they do not significantly affect the overall user experience.
- Reverse needs: These are features that, when present, can actually lead to dissatisfaction. Some users may prefer a simpler version of the product, and adding complex features might make them unhappy.
Resource:
17. Impact Effort Matrix
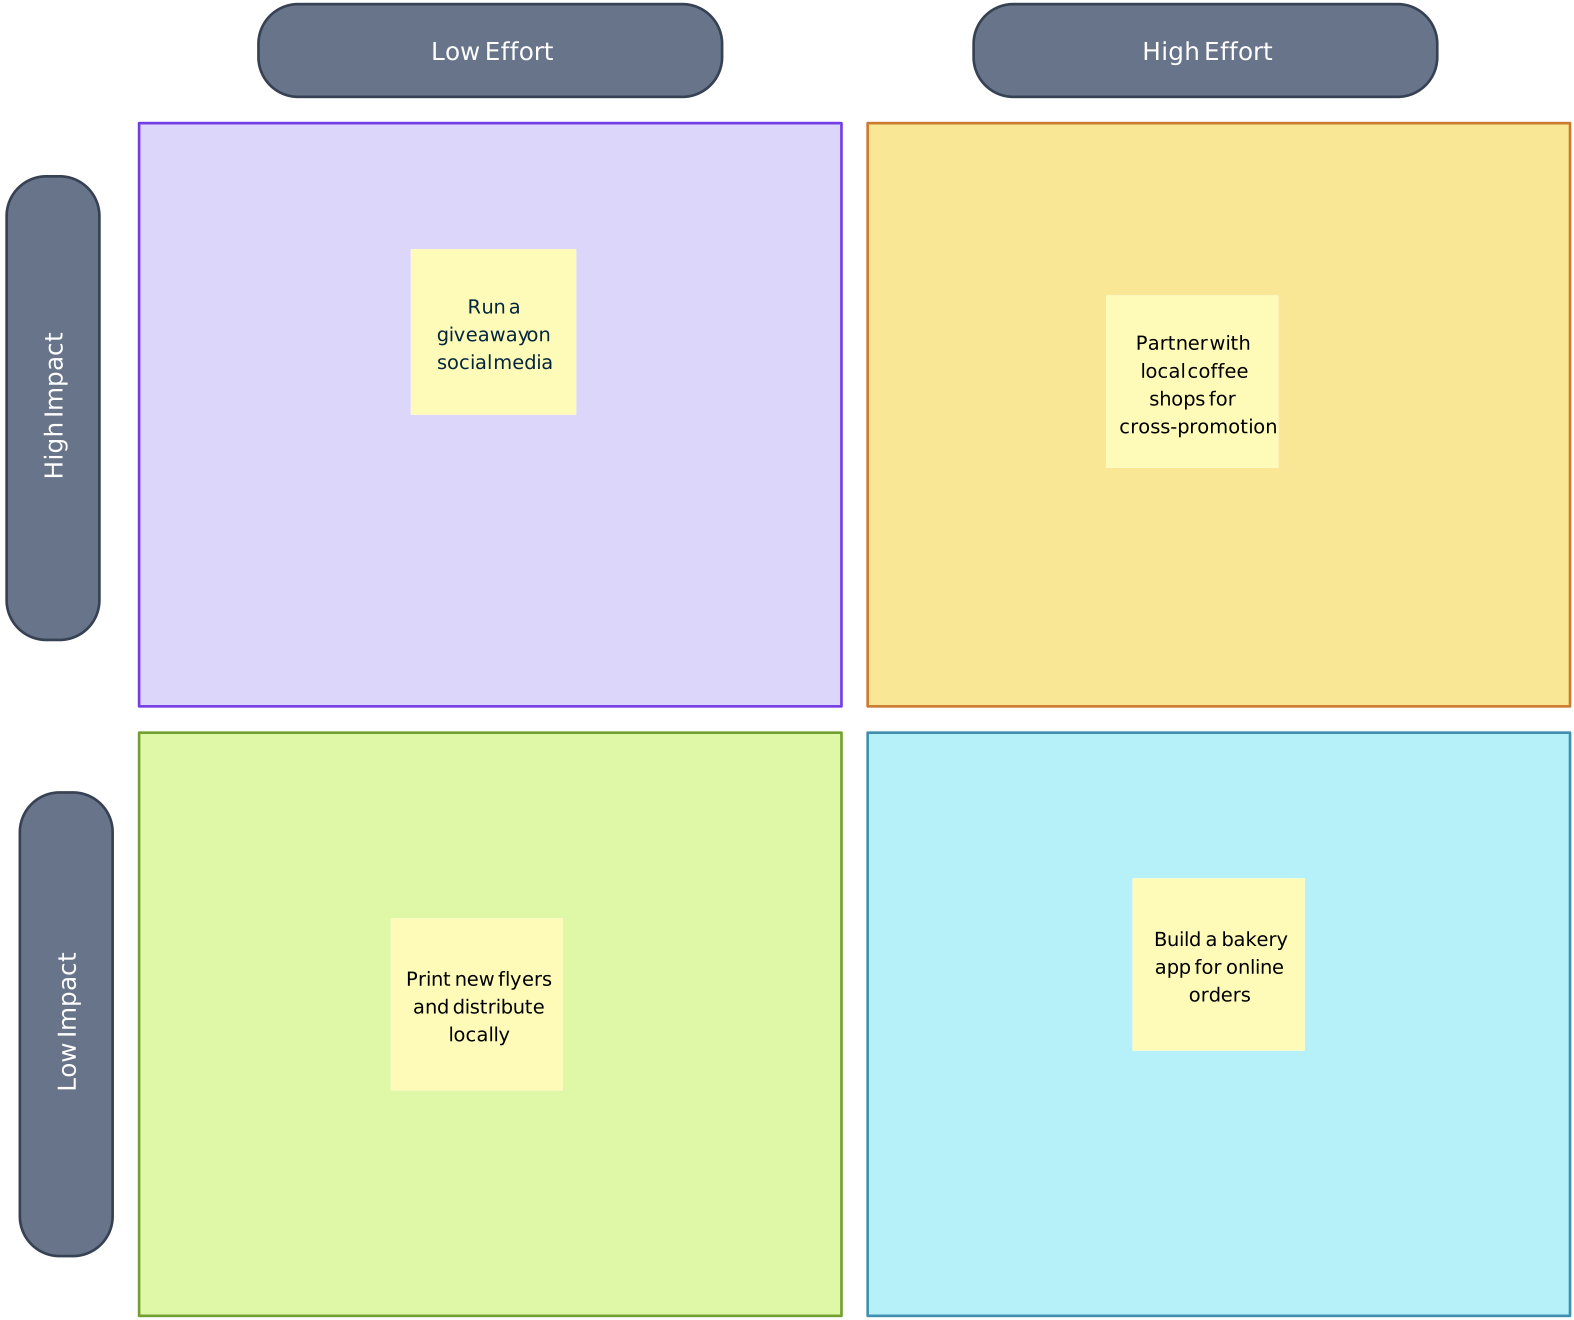
The impact effort matrix is a simple yet effective framework that helps product teams prioritize tasks, features, or initiatives based on their potential value (impact) and the effort required to implement them. It allows teams to make smarter decisions by focusing on work that delivers the most value with the least effort.
How to use it
The matrix is a 2x2 grid divided into four quadrants:
- Quick wins (high impact, low effort): These are the best opportunities to pursue. They bring significant value with minimal effort and should be prioritized first.
- Major projects (high impact, high effort): These initiatives require a lot of time and resources but offer big rewards. Teams should carefully plan and allocate resources before committing.
- Fill-ins (low impact, low effort): These are low-priority tasks that don’t take much effort but also don’t add much value. They can be done when there’s extra capacity but shouldn’t take focus away from higher-value work.
- Time wasters (low impact, high effort): These tasks consume significant resources but offer little benefit. They should be reconsidered, postponed, or avoided.
Resource:
Impact effort matrix templates
18. Weighted Scoring Model
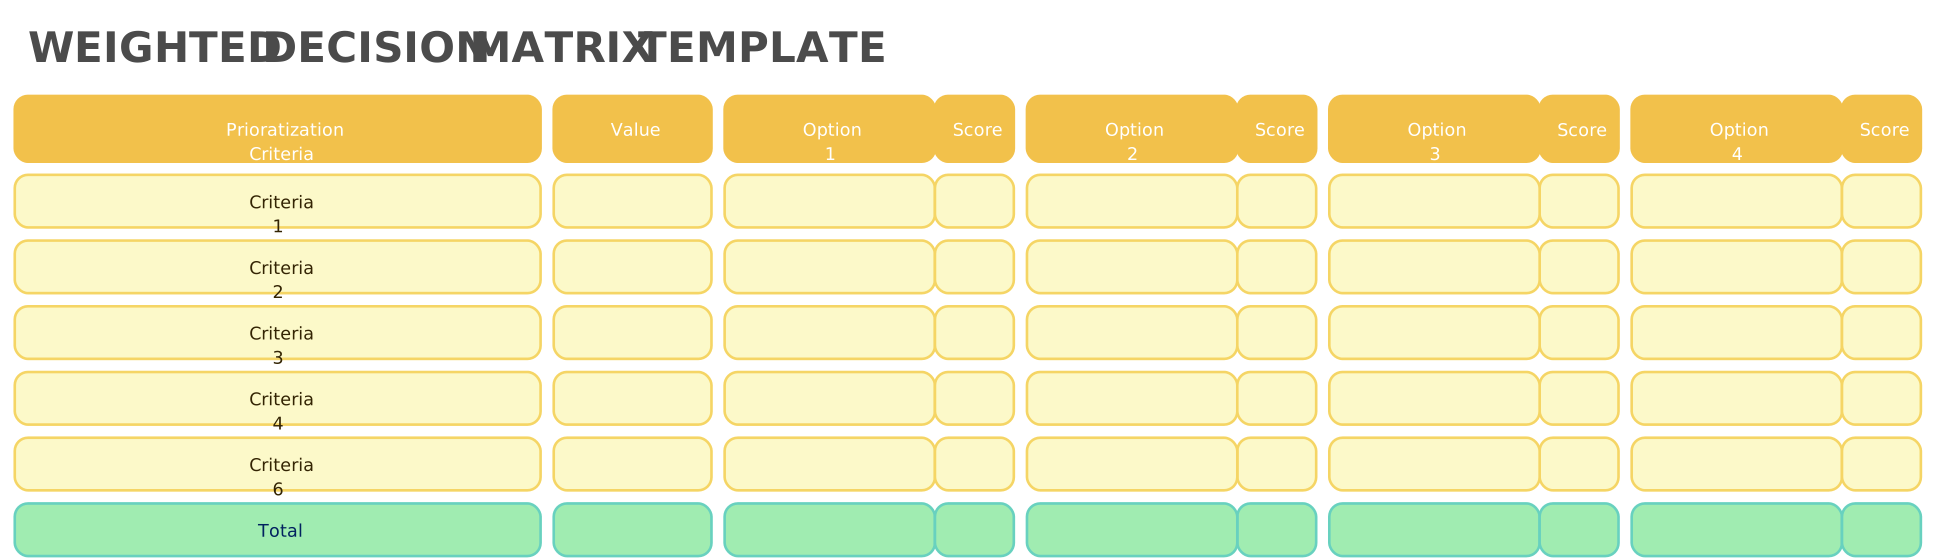
The weighted scoring model is a prioritization framework that helps product teams make data-driven decisions by assigning scores to different initiatives based on predefined criteria. It allows teams to evaluate and compare features, projects, or ideas objectively, ensuring that the most valuable ones get prioritized.
How to use it
- Define criteria: Teams first decide on the key factors that matter most for decision-making. These could include customer impact, revenue potential, strategic alignment, effort required, or technical feasibility.
- Assign weights: Each criterion is given a weight based on its importance. For example, customer impact might have a higher weight than technical feasibility if user satisfaction is a top priority.
- Score initiatives: Each initiative is rated against the chosen criteria. Scores are typically assigned on a numerical scale (e.g., 1 to 5), reflecting how well an initiative meets each criterion.
- Calculate weighted scores: The score for each criterion is multiplied by its weight, and the total score for each initiative is summed up. This results in a final ranking that highlights which initiatives should be prioritized.
19. Opportunity Scoring
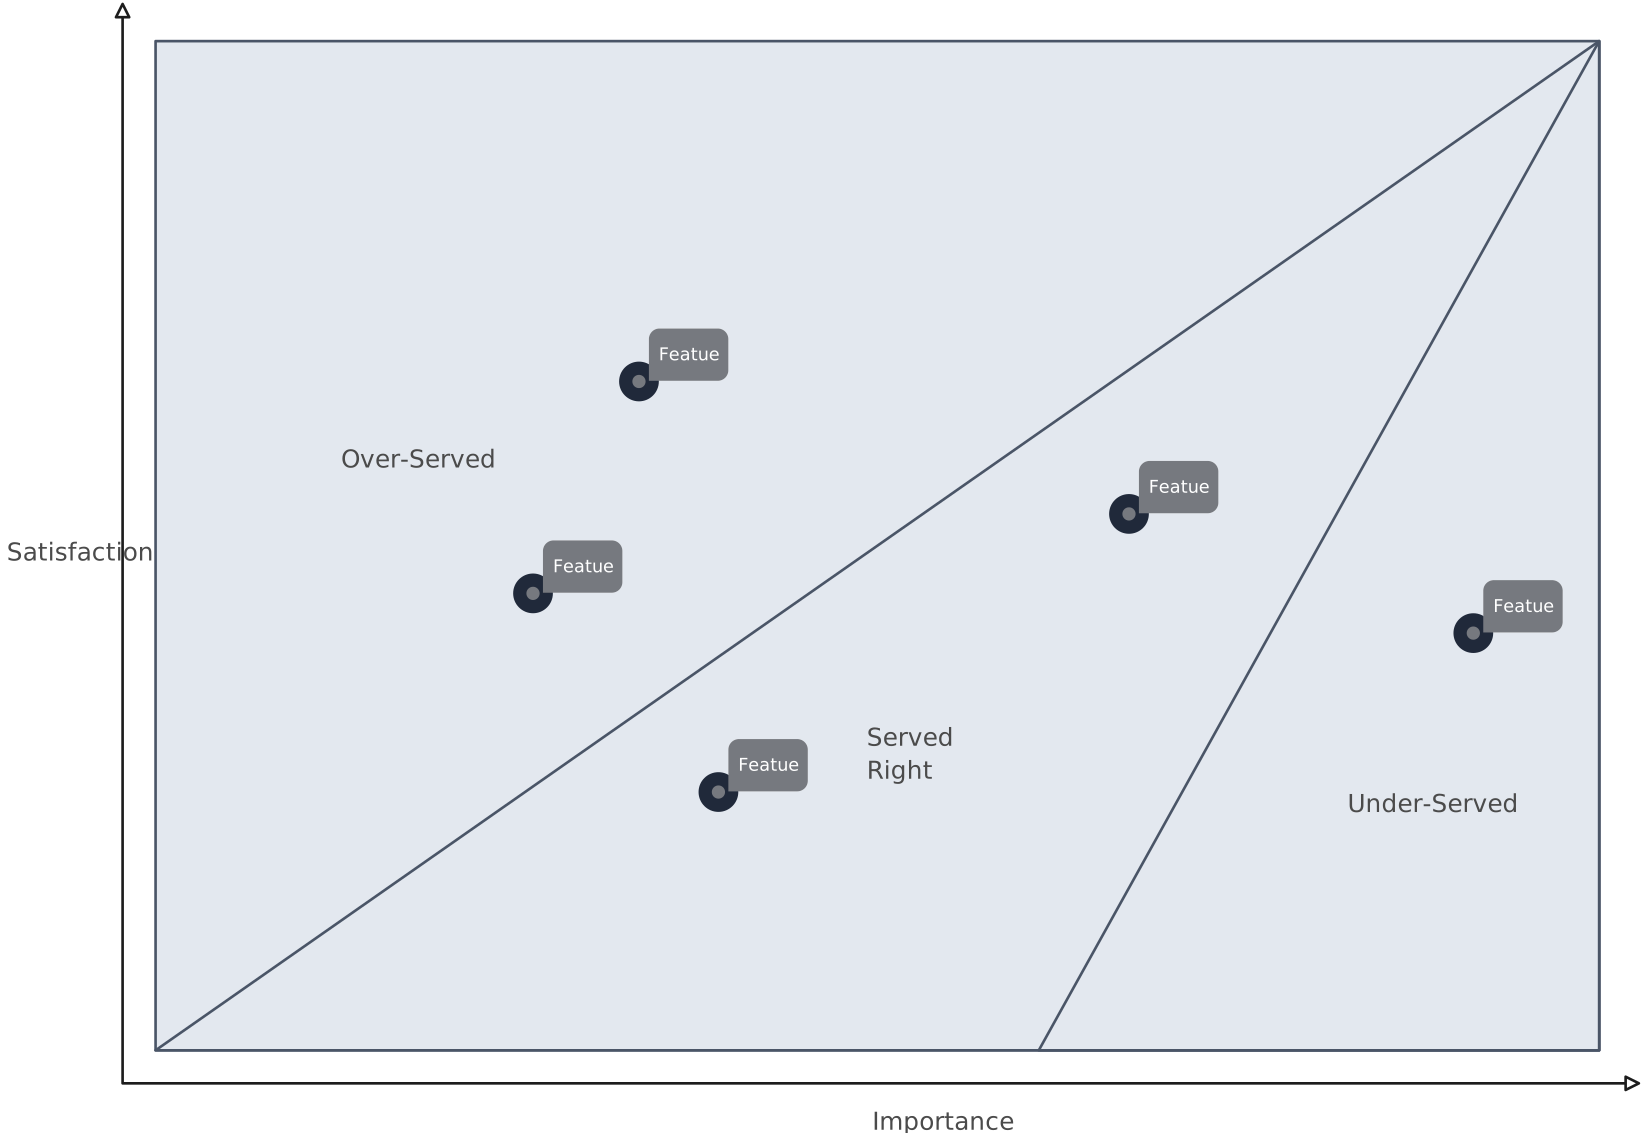
Opportunity scoring is a prioritization framework that helps product teams identify the most valuable improvements by evaluating customer needs. It is based on the idea that the biggest opportunities lie in areas where customers rate something as highly important but feel it is poorly satisfied. This approach helps teams focus on solving the most critical pain points.
How to use it
- Gather customer feedback: Teams survey users to understand which features or needs are most important and how well current solutions satisfy them.
- Score importance vs. satisfaction: Customers rate each feature or need on two scales—how important it is and how satisfied they are with existing solutions.
- Identify gaps: The biggest opportunities emerge where importance is high, but satisfaction is low. These areas indicate pain points that, if addressed, could significantly improve user experience.
- Prioritize solutions: Product teams focus on solving the highest-scoring gaps first, ensuring that their efforts lead to meaningful improvements for customers.
20. Eisenhower Matrix
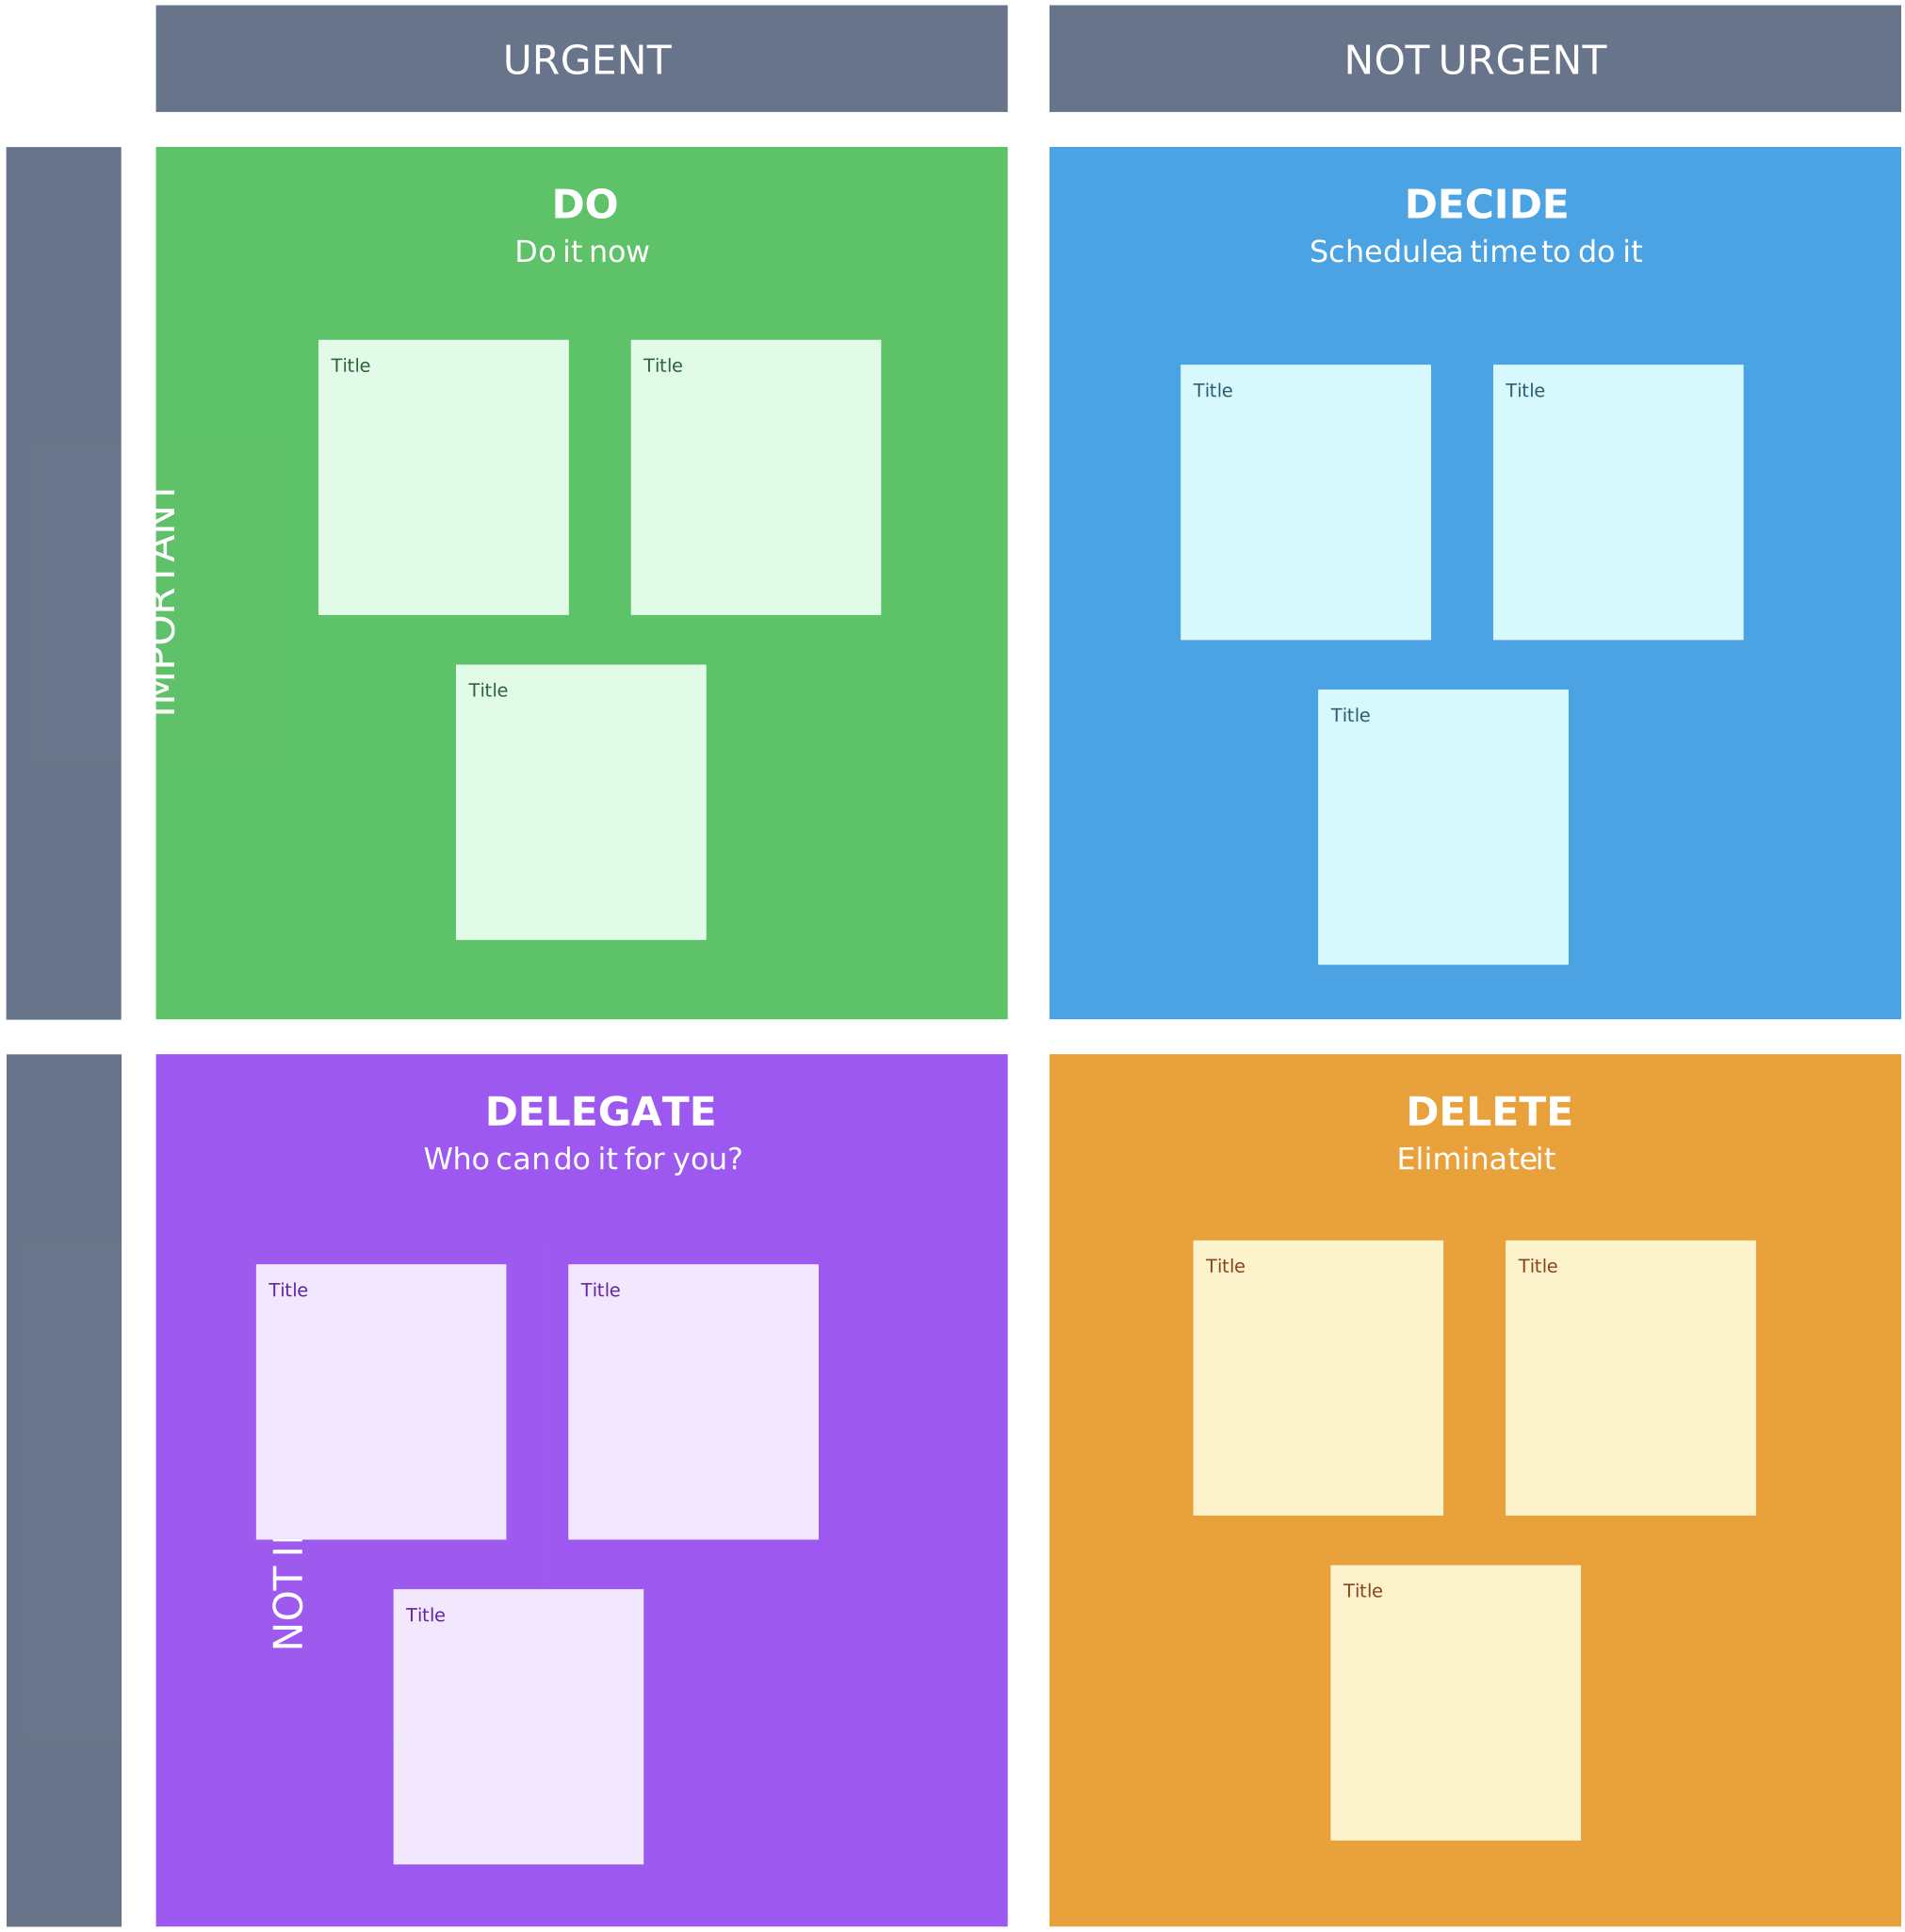
The Eisenhower matrix is a decision-making framework that helps product teams prioritize tasks based on urgency and importance. It ensures that teams focus on high-value work while minimizing distractions from less critical tasks.
How to use it
The matrix is divided into four quadrants:
- Urgent and important (do now) – Tasks in this quadrant require immediate attention, such as fixing a critical bug or addressing a major customer complaint. These should be tackled first.
- Important but not urgent (schedule) – These tasks contribute to long-term success but don’t require immediate action. Examples include product roadmap planning and user research. Teams should schedule these proactively.
- Urgent but not important (delegate) – These are tasks that need to be done quickly but don’t require the product team’s direct involvement, like administrative work. Whenever possible, they should be assigned to others.
- Not urgent and not important (eliminate) – These tasks add little to no value and should be deprioritized or removed altogether to keep teams focused on meaningful work.
Resources:
21. ICE Scoring
ICE scoring is a simple prioritization framework that helps product teams quickly evaluate and rank ideas based on three factors: impact, confidence, and effort. It provides a structured way to decide which initiatives to focus on first, ensuring that teams work on the most valuable and achievable tasks.

How to use it
- Impact – Estimate how much the initiative will move the needle for business goals, customer satisfaction, or product success. A higher impact means a more valuable initiative.
- Confidence – Assess how sure the team is about the expected impact. If there’s strong data or past experience to support the idea, confidence is high. If the outcome is uncertain, confidence is lower.
- Effort – Estimate the time, resources, and complexity involved in implementing the initiative. Lower effort means the task is easier to execute.
Each factor is rated on a scale (e.g., 1–10), and the scores are multiplied together to get an overall ICE score. Higher scores indicate high-priority tasks.
22. Impact Mapping
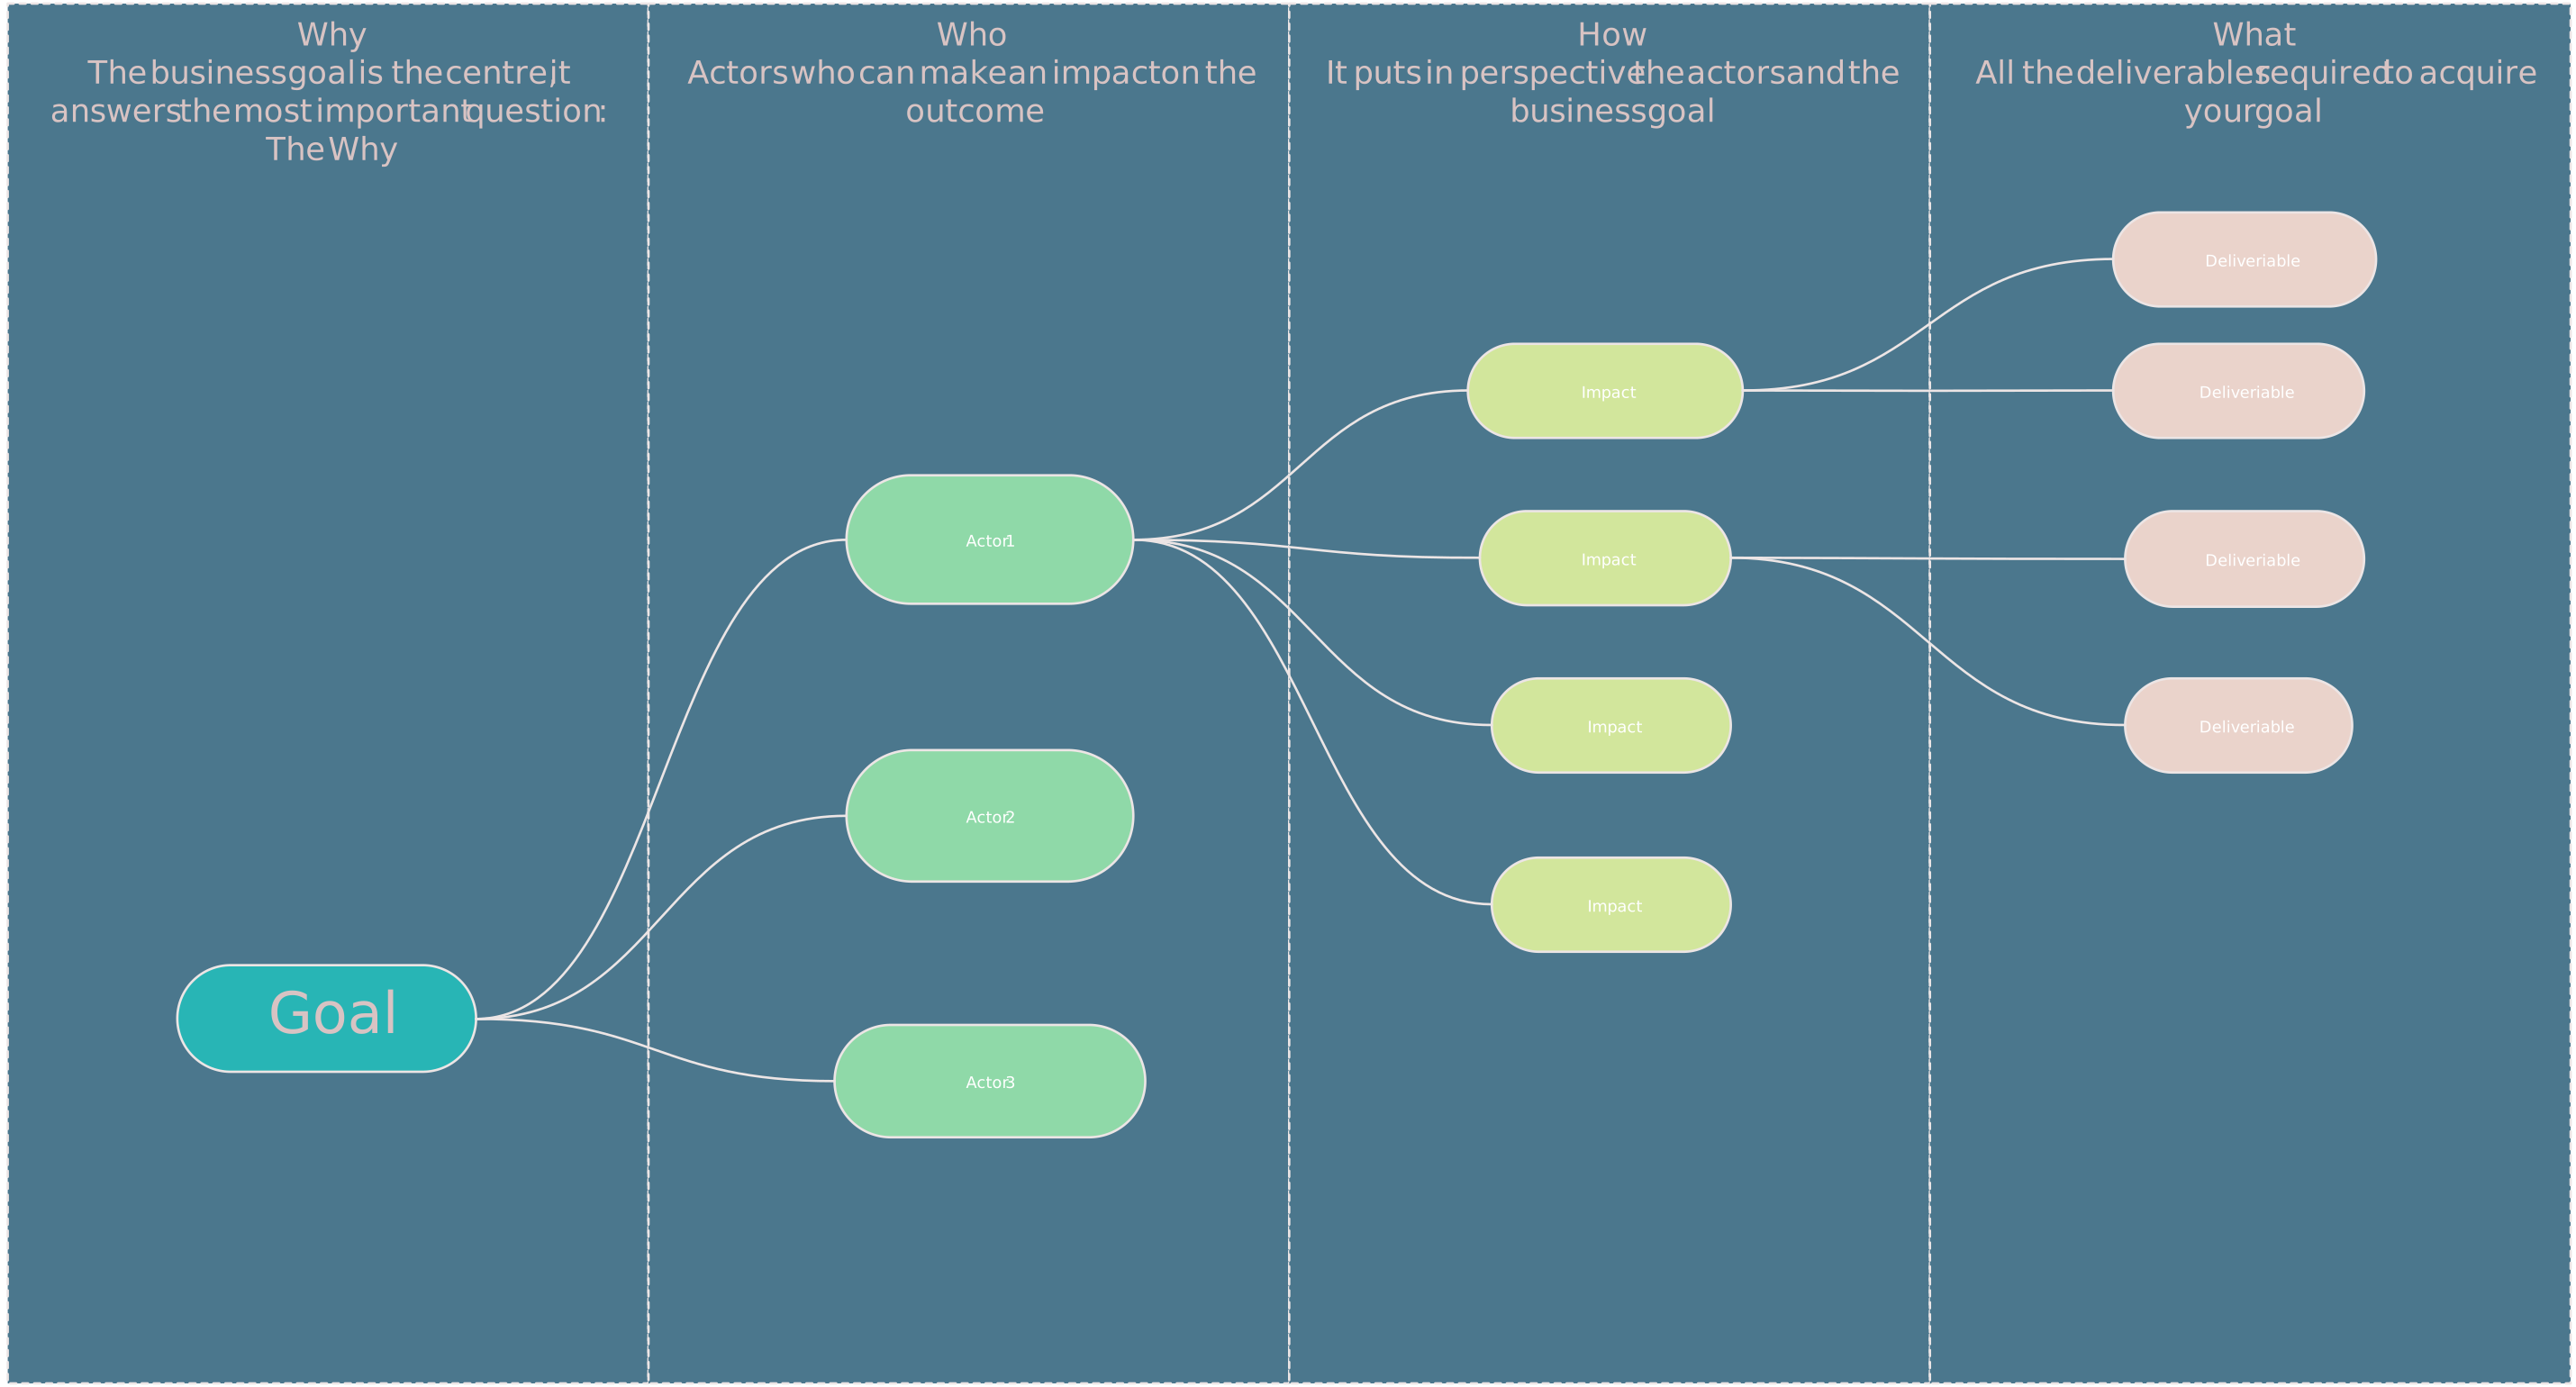
Impact mapping is a strategic planning framework that helps product teams align their work with business goals by visualizing how different initiatives contribute to desired outcomes. It ensures teams stay focused on activities that drive real impact rather than getting lost in tasks that don’t add value.
How to use it
- Define the goal – Start by identifying the high-level objective the team wants to achieve, such as increasing user engagement or improving conversion rates.
- Identify key actors – Determine who can influence the goal, such as customers, internal teams, or stakeholders. Understanding these actors helps teams design solutions that address the right people.
- Map out impacts – Define how each actor’s behavior needs to change to achieve the goal. For example, if the goal is to boost engagement, an impact could be encouraging users to explore more features.
- List possible solutions – Brainstorm specific product initiatives or features that could drive the desired impacts. These become actionable steps in the product roadmap.
Resource:
Development and Execution Product Management Frameworks
Effective development and execution are vital in product management, ensuring that ideas transition smoothly from concept to reality. Using structured frameworks during this phase can improve efficiency, maintain quality, and align the team with the product vision. Below are several key product management frameworks that guide the development and execution stages:
23. Agile Methodology
Agile methodology is a flexible, iterative approach to product management that helps teams build, test, and improve products quickly. Instead of following a rigid plan, agile encourages continuous feedback and adjustments, ensuring the product evolves based on real user needs.
How to implement it
- Work in iterations – Agile teams break down large projects into smaller cycles, called sprints, usually lasting two to four weeks. This allows for regular progress and quick adjustments.
- Prioritize customer feedback – Teams release small updates frequently and gather user feedback to make improvements, ensuring the product meets real needs.
- Collaborate closely – Agile encourages cross-functional teams to work together, ensuring smooth communication between developers, designers, and product managers.
- Adapt to change – Instead of sticking to a fixed plan, agile teams stay flexible, adjusting priorities based on new insights or market shifts.
- Measure and improve – At the end of each sprint, teams review what worked and what didn’t, refining their process for the next cycle.
Resources:
- Agile Templates
- What Is an Agile workflow
- Agile software development life cycle
- Agile project management
- How to build an Agile team
- Agile project charter
24. Scrum Framework
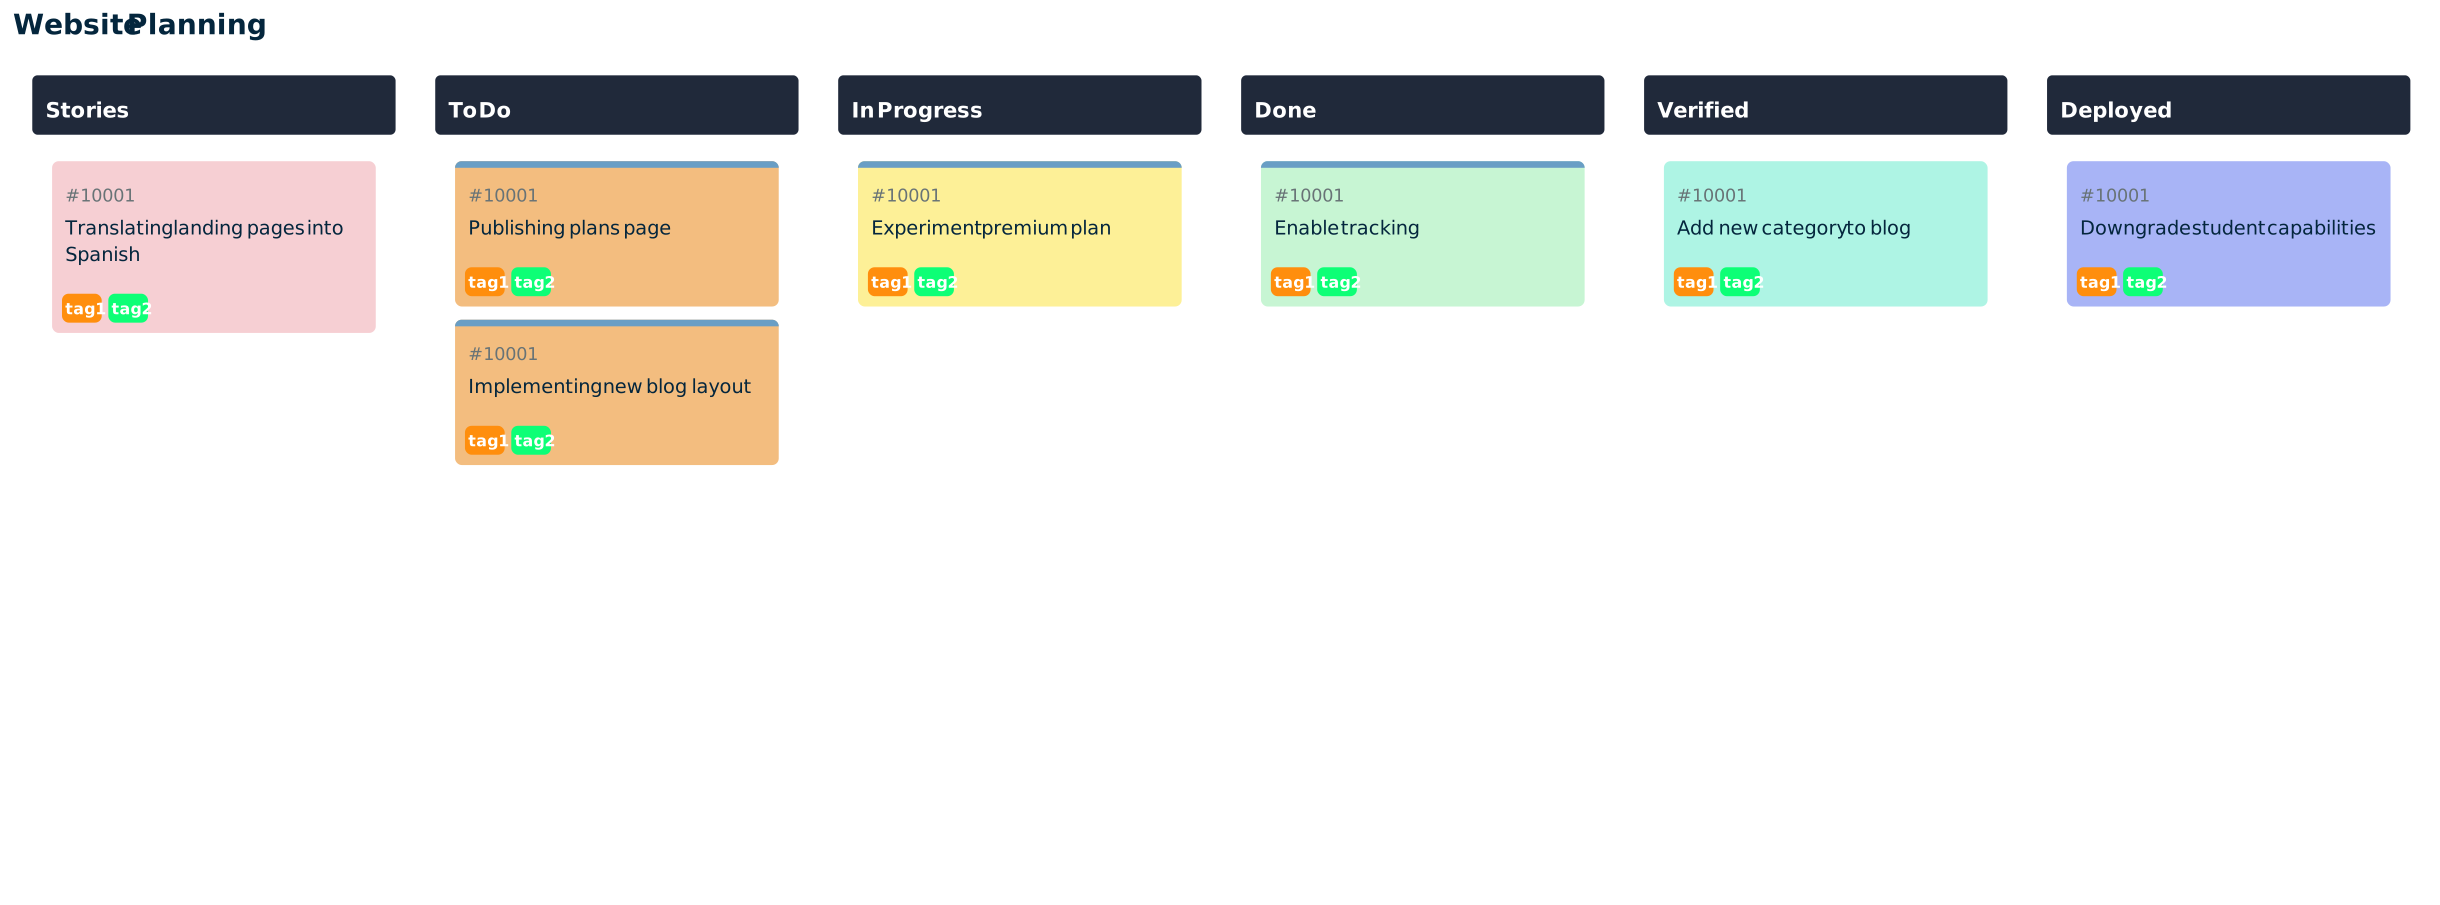
Scrum is an agile framework that helps product teams develop and deliver products in short, structured cycles called sprints. It focuses on collaboration, flexibility, and continuous improvement, making it easier for teams to adapt to changing requirements.
How to implement it
- Work in sprints – Teams plan and execute work in short cycles (usually two to four weeks), delivering small, functional product increments.
- Define clear roles – Scrum has three key roles:
- Product owner – Defines the product vision, prioritizes tasks, and represents customer needs.
- Scrum master – Facilitates the process, removes roadblocks, and ensures the team follows scrum principles.
- Development team – Builds and delivers the product in each sprint.
- Hold regular meetings – Scrum includes daily stand-ups for quick progress updates, sprint planning meetings to define tasks, and sprint retrospectives to review what went well and what needs improvement.
- Use a backlog – Teams maintain a prioritized list of tasks (product backlog) that they pull from during sprint planning, ensuring the most important work gets done first.
- Adapt and improve – After each sprint, the team reviews results and refines their approach to work more effectively in the next cycle.
Resources:
25. Kanban System
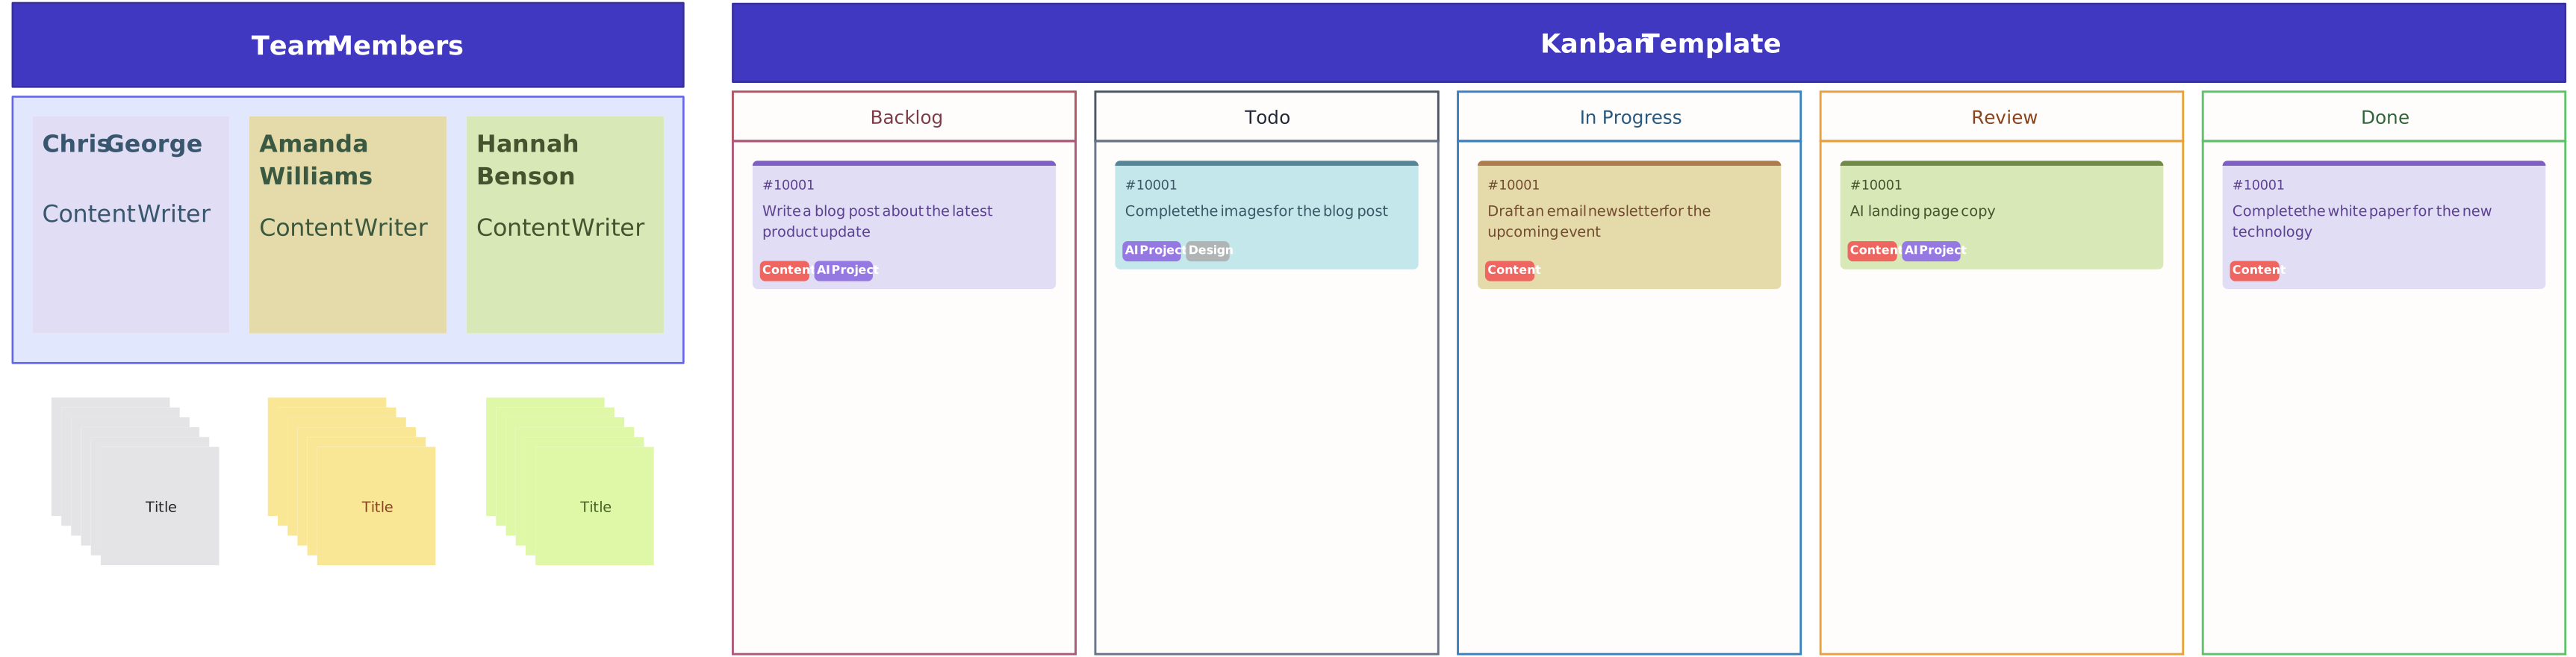
Kanban is a visual workflow management system that helps product teams track and optimize their work. It focuses on continuous delivery, reducing bottlenecks, and improving efficiency by making tasks and progress visible.
How to use it
- Visualize work – Teams use a Kanban board (physical or digital) with columns representing different workflow stages, such as “to do,” “in progress,” and “done.” Tasks move across the board as they progress.
- Limit work in progress – To prevent overload, teams set limits on how many tasks can be in progress at the same time, ensuring smoother workflow and faster completion.
- Focus on continuous delivery – Unlike time-boxed sprints in scrum, Kanban allows teams to release updates whenever a task is completed, promoting steady progress.
- Identify bottlenecks – Since all tasks are visible, teams can quickly spot slowdowns in the workflow and make improvements.
- Continuously improve – Teams analyze cycle times and process efficiency, making adjustments to enhance speed and quality.
Resources:
26. Lean Product Development
Lean product development is a framework that helps teams create products efficiently by minimizing waste, focusing on customer value, and continuously improving the process. It emphasizes learning quickly, making data-driven decisions, and delivering high-quality products with fewer resources.
How to implement it
- Prioritize customer value – Focus on features and solutions that directly solve user problems rather than building unnecessary extras.
- Reduce waste – Identify and eliminate anything that doesn’t add value, such as excessive documentation, long approval processes, or unnecessary features.
- Build-measure-learn – Develop small product increments, test them with users, and learn from feedback to make continuous improvements.
- Encourage cross-functional collaboration – Engineers, designers, and product managers work closely together to streamline development and decision-making.
- Make data-driven decisions – Use real-world feedback, analytics, and experiments to guide product choices rather than assumptions.
Resources:
27. Scaled Agile Framework (SAFe)
The Scaled Agile Framework (SAFe) is a methodology designed to help large organizations implement agile practices at scale. It provides a structured approach to aligning teams, improving collaboration, and ensuring that the entire organization works toward common goals. SAFe helps organizations deliver high-quality products faster while maintaining flexibility and responsiveness.
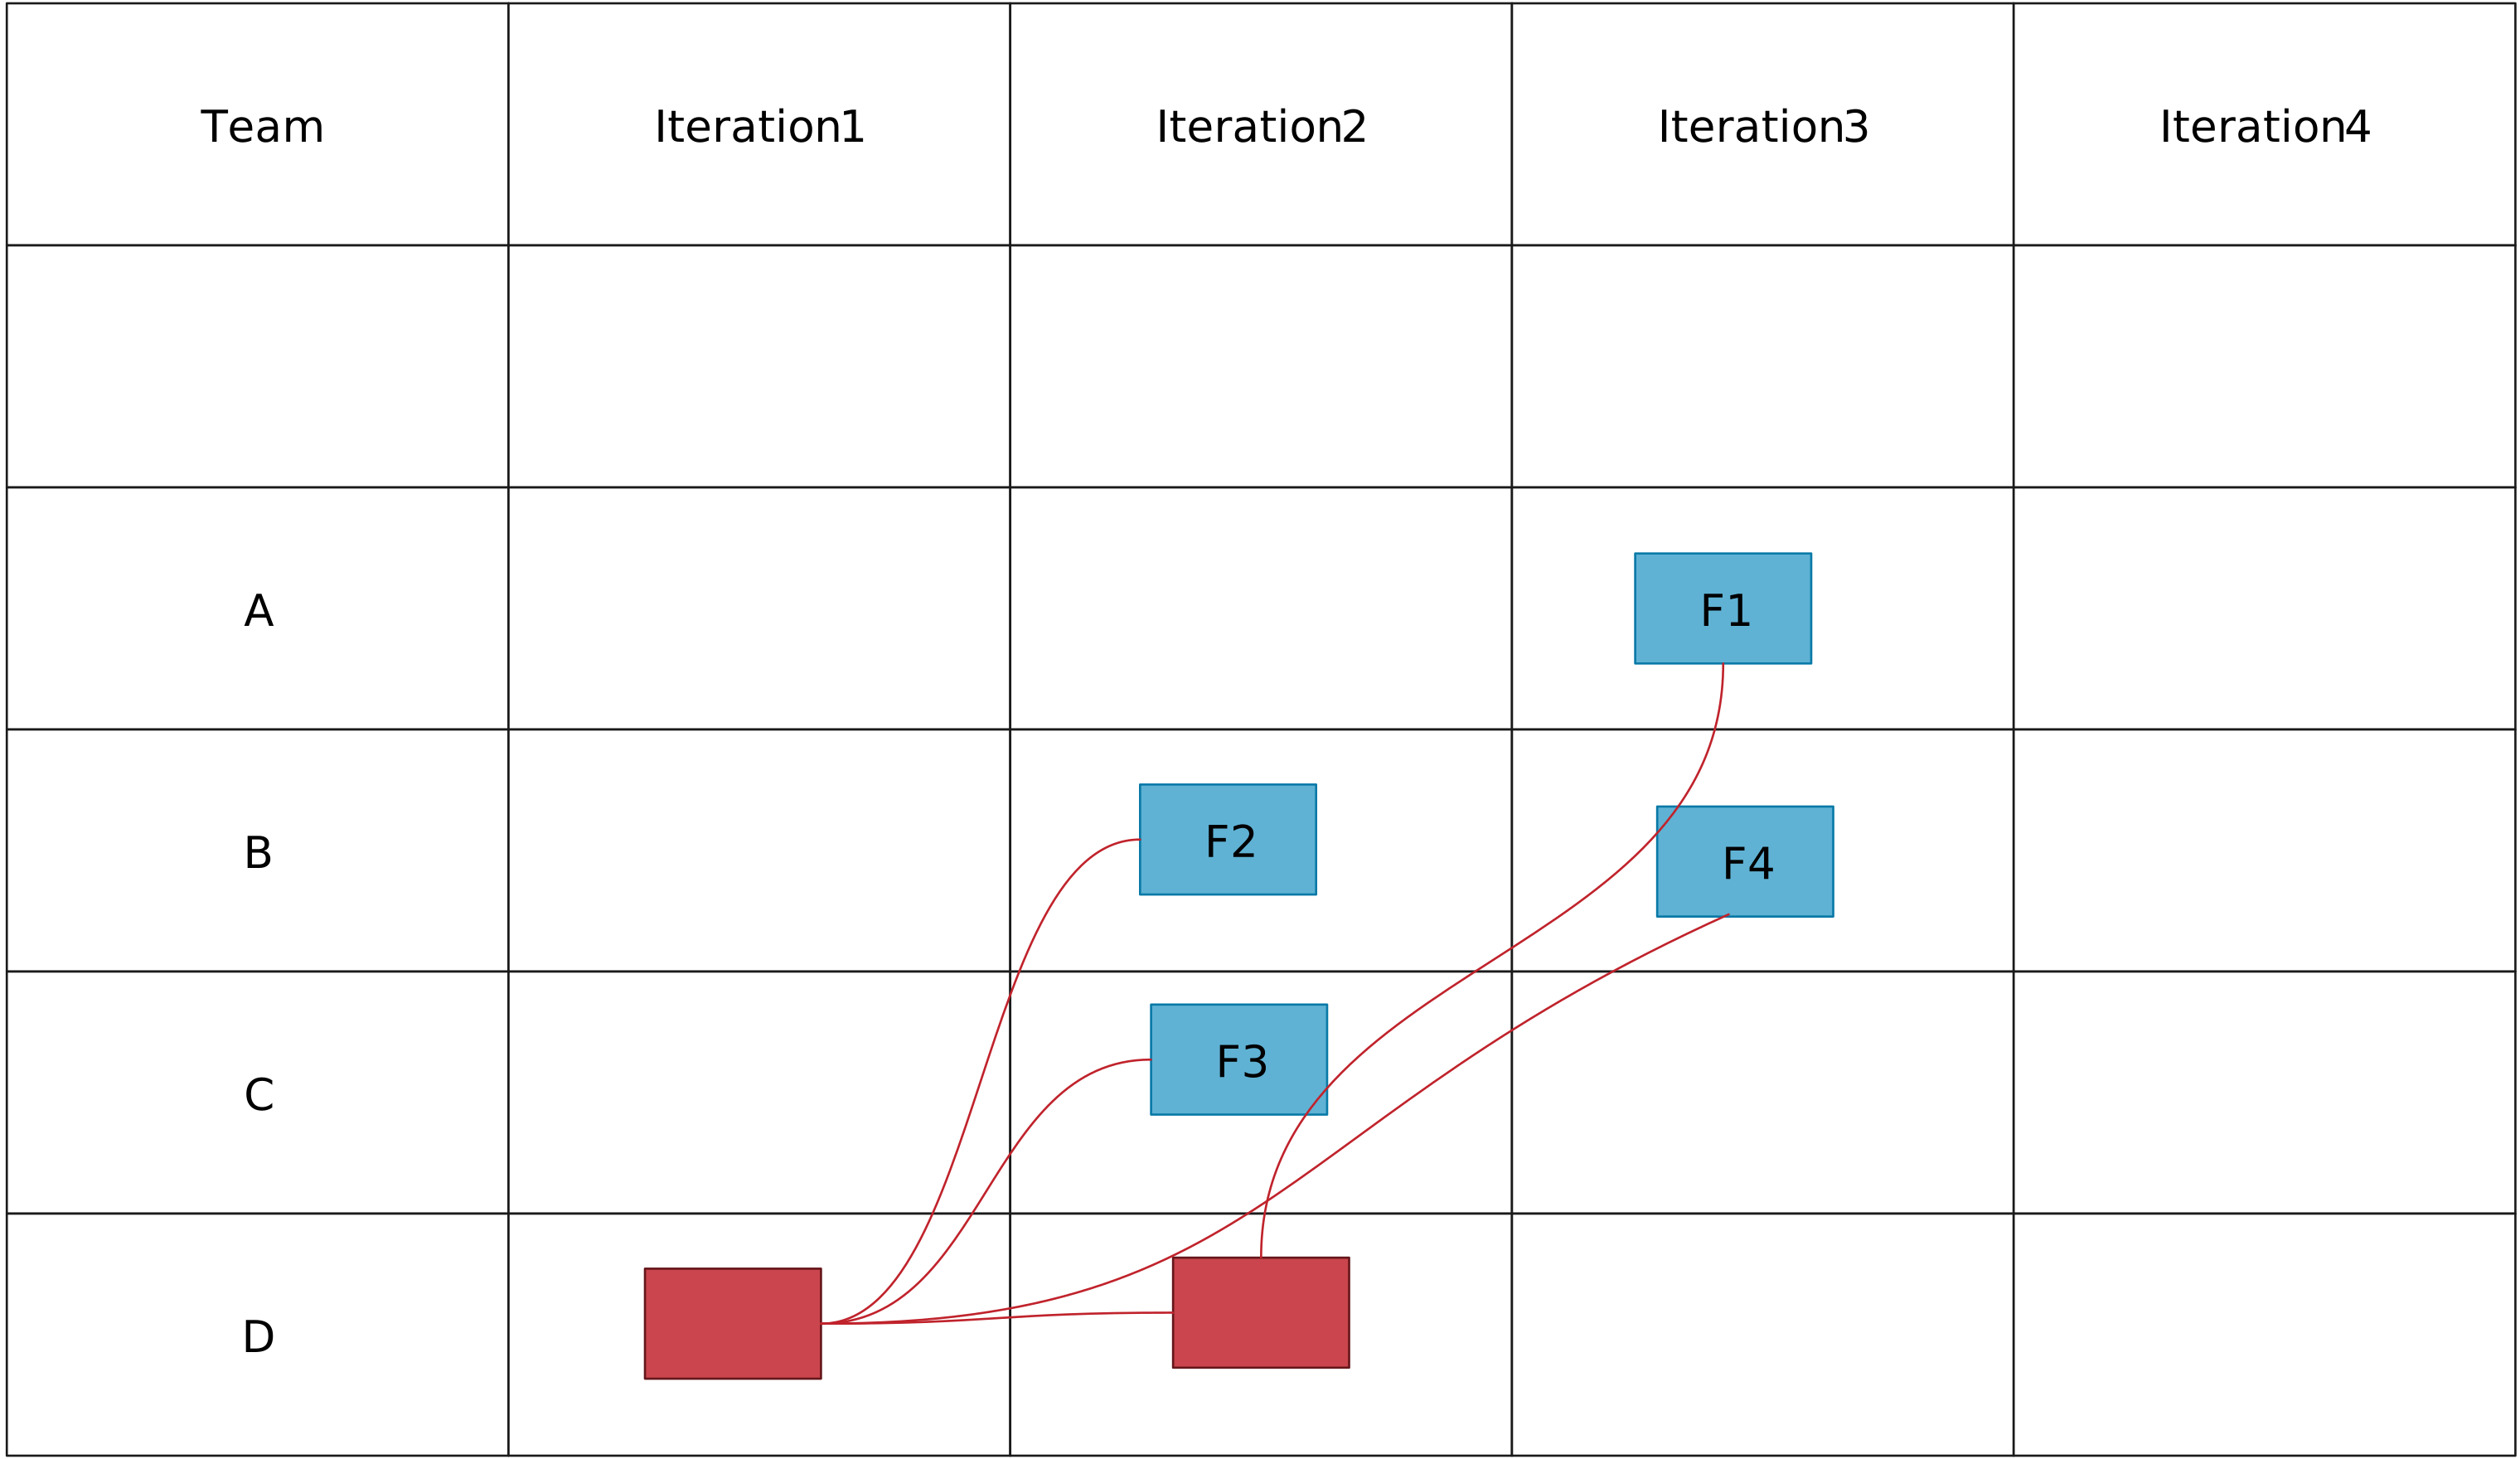
Use it to
- Align teams around a common vision – SAFe ensures that all teams in the organization are working toward the same strategic goals, helping to reduce silos and improve collaboration.
- Work in program increments (pis) – Instead of just focusing on individual sprints, teams work in longer cycles called program increments, typically lasting 8-12 weeks. This allows for more time to develop and refine features across teams.
- Cross-functional collaboration – SAFe emphasizes collaboration between various departments such as engineering, marketing, and product management to ensure everyone is aligned and working toward the same objectives.
- Continuous feedback and improvement – Teams regularly inspect and adapt their work, using feedback to improve processes, workflows, and product features.
- Empower teams and leaders – SAFe encourages decentralized decision-making, allowing teams to make decisions on their own within the boundaries of the organization’s goals. Leaders provide guidance and remove obstacles rather than micromanage.
28. Stage-Gate Process
The stage-gate process is a product development framework that divides the process into distinct stages, or phases, with “gates” where decisions are made about whether to continue or stop. It helps teams manage risks, ensure quality, and keep products on track by requiring approval before moving to the next stage.

How to use it
- Break the process into stages – The stage-gate process divides product development into clear stages, such as ideation, development, and testing. Each stage focuses on a specific set of tasks and milestones.
- Use gates for decision-making – At the end of each stage, the team meets at a gate to review progress, assess risks, and decide whether to proceed, pause, or cancel the project. These gates help ensure that resources are invested wisely and that the project aligns with business goals.
- Manage risks early – By evaluating the product at each gate, teams can identify potential risks early in the process, such as technical issues, market fit, or resource constraints, and make necessary adjustments.
- Ensure quality control – Each stage includes defined deliverables and review processes to ensure that the product meets quality standards and is ready for the next phase.
- Collaborate across teams – Teams from different departments (product, engineering, marketing) work together to review progress at each gate, ensuring that all perspectives are considered before making decisions.
Measurement and Evaluation Product Management Frameworks
Measuring and evaluating product performance are essential steps in product management process, enabling teams to assess success, identify areas for improvement, and make data-driven decisions. Implementing structured product frameworks during this phase makes sure that evaluations are systematic, comprehensive, and aligned with business objectives. Below are several key product management frameworks designed for measurement and evaluation in product management:
29. Balanced Scorecard (BSC)
The balanced scorecard (BSC) is a strategic management framework that helps organizations track and measure their performance across multiple perspectives. It ensures that teams are not only focused on financial outcomes but also on key areas like customer satisfaction, internal processes, and employee growth. The BSC provides a balanced view of a product’s performance and alignment with business goals.
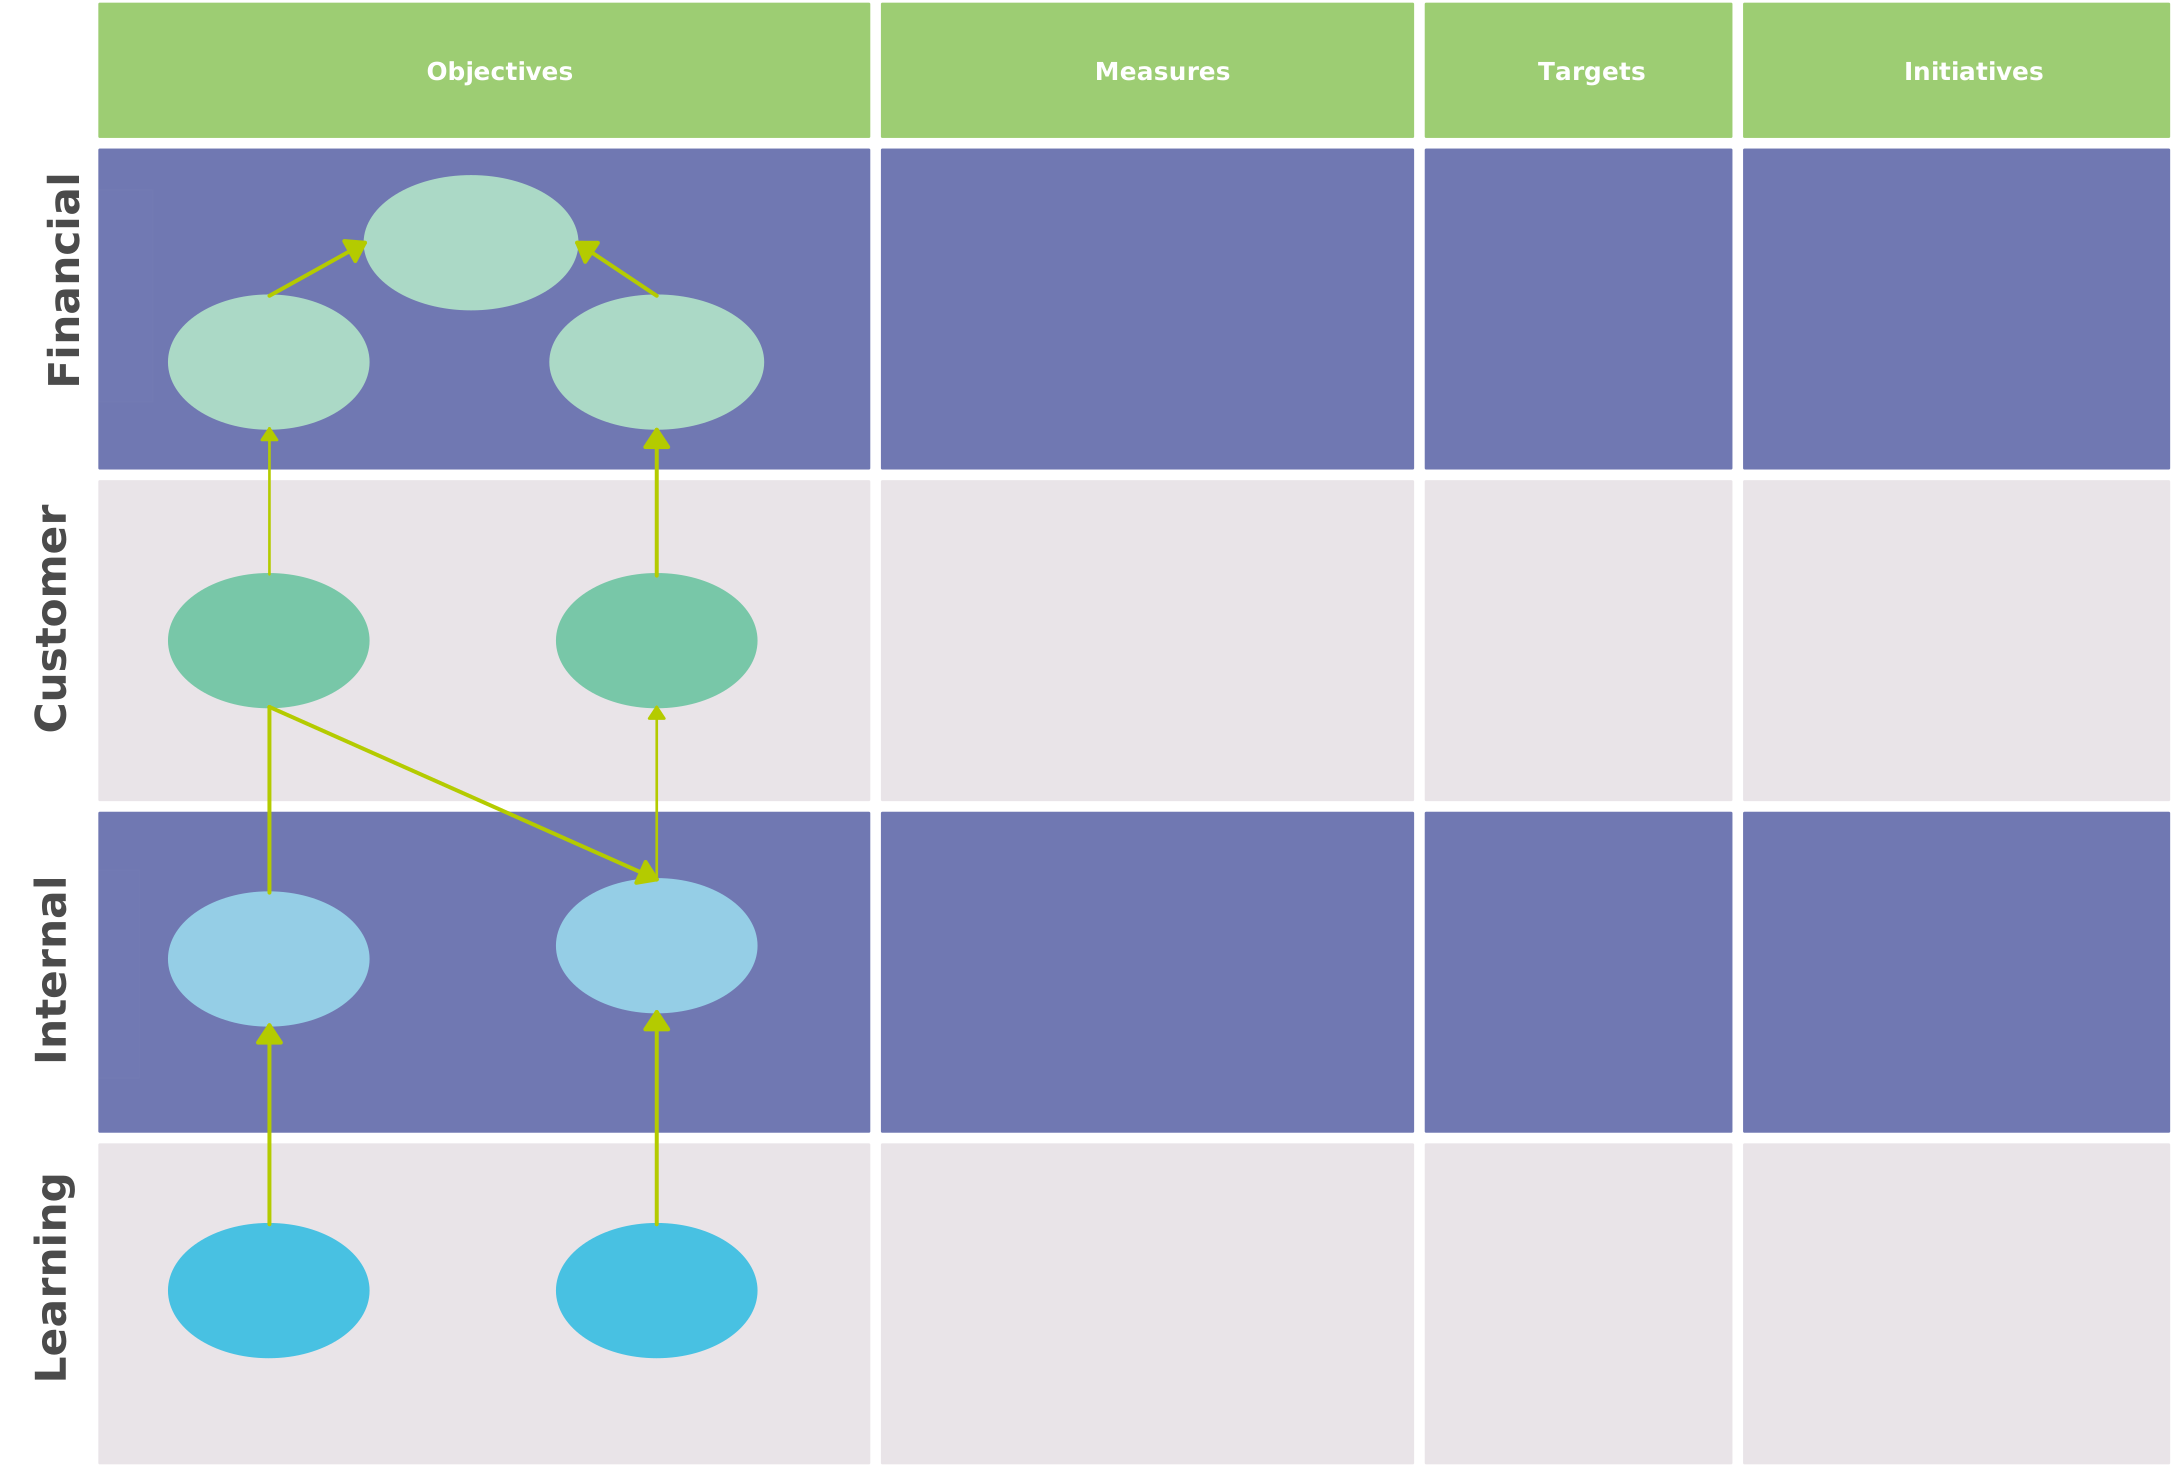
How to use it
- Focus on key perspectives – The balanced scorecard uses four main perspectives:
- Financial – Measure how the product is contributing to the company’s financial goals, such as revenue and profitability.
- Customer – Assess how well the product meets customer needs, including customer satisfaction and retention.
- Internal processes – Evaluate the efficiency and effectiveness of internal processes involved in product development and delivery.
- Learning and growth – Track employee skills, innovation, and overall organizational learning to ensure continuous improvement.
- Align with strategic goals – By monitoring these four perspectives, product teams can ensure that their efforts are aligned with broader organizational objectives, focusing on both long-term value and short-term success.
- Measure performance holistically – The balanced scorecard helps teams avoid a narrow focus on just financial metrics, encouraging a broader view that includes customer experience, operational efficiency, and employee satisfaction.
- Track progress over time – The BSC provides a structured way to track key performance indicators (KPIs) over time, enabling teams to make data-driven decisions and adapt as necessary.
- Drive continuous improvement – By regularly reviewing all four perspectives, product teams can identify areas for improvement and make adjustments to their strategies, processes, and outcomes.
Resource:
30. Key Performance Indicators (KPIs)
Key performance indicators (KPIs) are measurable values that help product teams track how well they are achieving their goals. They are used to evaluate the success of a product, project, or business initiative. KPIs can focus on various aspects like user engagement, revenue growth, customer satisfaction, or product performance, and they provide actionable insights for decision-making.

How to use it
- Define clear goals – To effectively use KPIs, product teams must first establish specific, measurable goals aligned with the overall product strategy. This might include increasing user acquisition, improving retention, or boosting sales.
- Select relevant KPIs – Product teams should choose KPIs that best reflect the success of the product or the desired outcome. For example, if the goal is to improve user engagement, KPIs might include metrics like daily active users (DAU) or average session duration.
- Track progress regularly – By consistently tracking KPIs, teams can monitor how well the product is performing against the set goals. Regularly reviewing these metrics helps teams stay on course and adjust strategies if needed.
- Make data-driven decisions – KPIs provide data-driven insights that can guide decisions. If a KPI shows a drop in customer satisfaction, for example, the team can investigate the issue and take action to improve the product.
- Measure success and improvement – KPIs are not just for evaluating success, but also for identifying areas of improvement. By measuring progress over time, teams can spot trends, track performance, and make informed adjustments to optimize the product.
Resources:
31. Customer Satisfaction Score (CSAT)
Customer satisfaction score (CSAT) is a metric used to measure how satisfied customers are with a product or service. It is usually collected through surveys that ask customers to rate their experience on a scale (typically 1 to 5 or 1 to 10). CSAT helps product teams gauge customer sentiment and identify areas for improvement.
How to use it
- Ask for feedback – Collect CSAT through surveys after interactions, purchases, or product use to gauge customer satisfaction.
- Analyze results – The score shows how satisfied customers are, highlighting areas that may need attention.
- Track over time – Regularly collect CSAT to spot trends, helping teams identify when satisfaction changes.
- Identify issues – Use customer comments to pinpoint specific problems with the product.
- Prioritize improvements – Focus on the areas with the lowest satisfaction to enhance the product experience.
32. Net Promoter Score (NPS)
Net promoter score (NPS) is a metric used to measure customer loyalty and their likelihood of recommending a product or service to others. It is based on a single question: “On a scale of 0 to 10, how likely are you to recommend this product to a friend or colleague?” Based on their response, customers are categorized as promoters, passives, or detractors.
How to use it
- Measure customer loyalty – NPS helps teams understand how loyal their customers are. A higher score indicates a strong customer base that is likely to recommend the product, while a lower score suggests there may be issues with satisfaction.
- Categorize respondents – Respondents are grouped into three categories:
- Promoters (9-10): These are satisfied customers who are likely to recommend the product.
- Passives (7-8): These are satisfied but unenthusiastic customers who are unlikely to actively promote the product.
- Detractors (0-6): These customers are unhappy and unlikely to recommend the product.
- Calculate the score – NPS is calculated by subtracting the percentage of detractors from the percentage of promoters. The result can range from -100 to +100.
- Track trends – By tracking NPS over time, product teams can spot trends in customer loyalty. A drop in NPS could indicate dissatisfaction, allowing teams to investigate and address the issues.
- Identify areas for improvement – The open-ended feedback gathered alongside the NPS question helps teams identify specific issues customers are facing. By addressing these issues, teams can improve the product and increase customer loyalty.
33. Customer Lifetime Value (CLV)
Customer lifetime value (CLV) is a metric that estimates the total revenue a business can expect from a customer over the entire duration of their relationship. It helps product teams understand the long-term value of customers and prioritize efforts to retain and nurture profitable relationships.
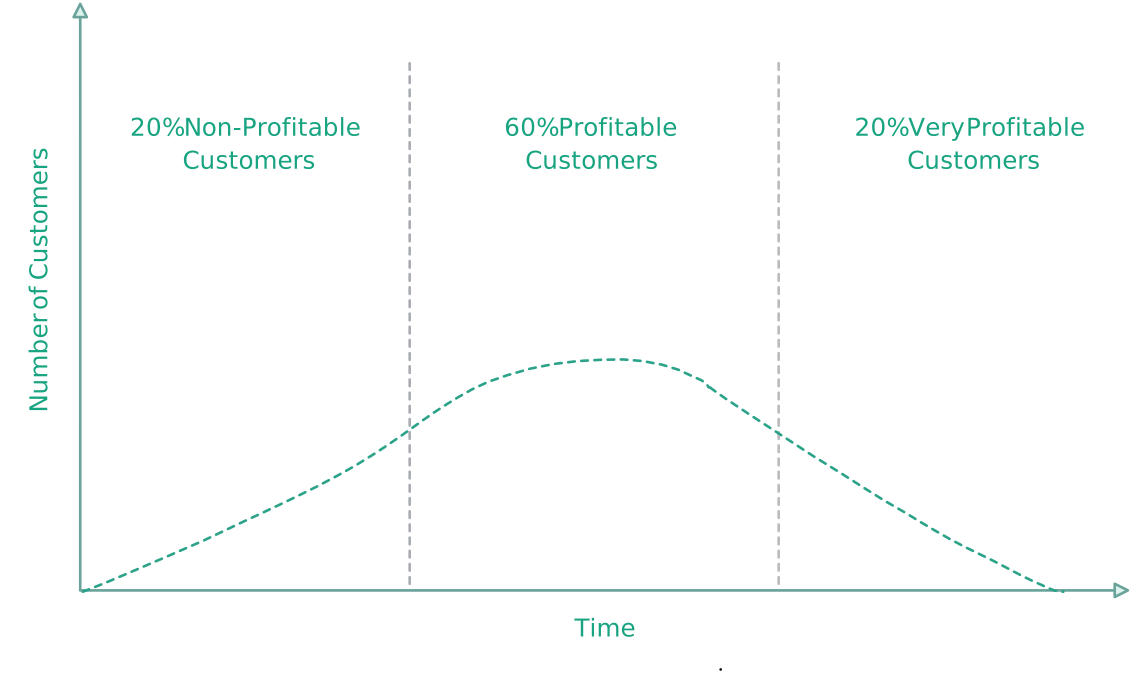
How to use it
- Identify high-value customers – By calculating CLV, product teams can identify customers who generate the most value over time. This helps teams focus on retaining these high-value customers.
- Guide resource allocation – Understanding CLV allows teams to allocate resources efficiently. For example, more resources can be invested in retaining high-CLV customers, while lower-value segments may require different strategies.
- Improve customer retention – By identifying patterns in high-CLV customers, product teams can develop strategies to improve customer satisfaction and retention, thus increasing the lifetime value of other customers.
- Support pricing decisions – CLV can also help teams evaluate if their pricing strategy is aligned with the value they’re delivering to customers. If the CLV is low, it might be time to adjust pricing or improve the product.
- Measure product success – CLV serves as an indicator of a product’s overall success in terms of customer loyalty and long-term profitability. A higher CLV suggests the product is meeting customer needs and encouraging repeat business.
34. HEART Framework
The HEART framework is a product management and UX framework designed to help teams measure and improve user experience (UX) across various aspects of a product. It focuses on five key metrics: Happiness, Engagement, Adoption, Retention, and Task Success. This framework provides a structured approach to evaluating how well a product meets user needs and expectations.
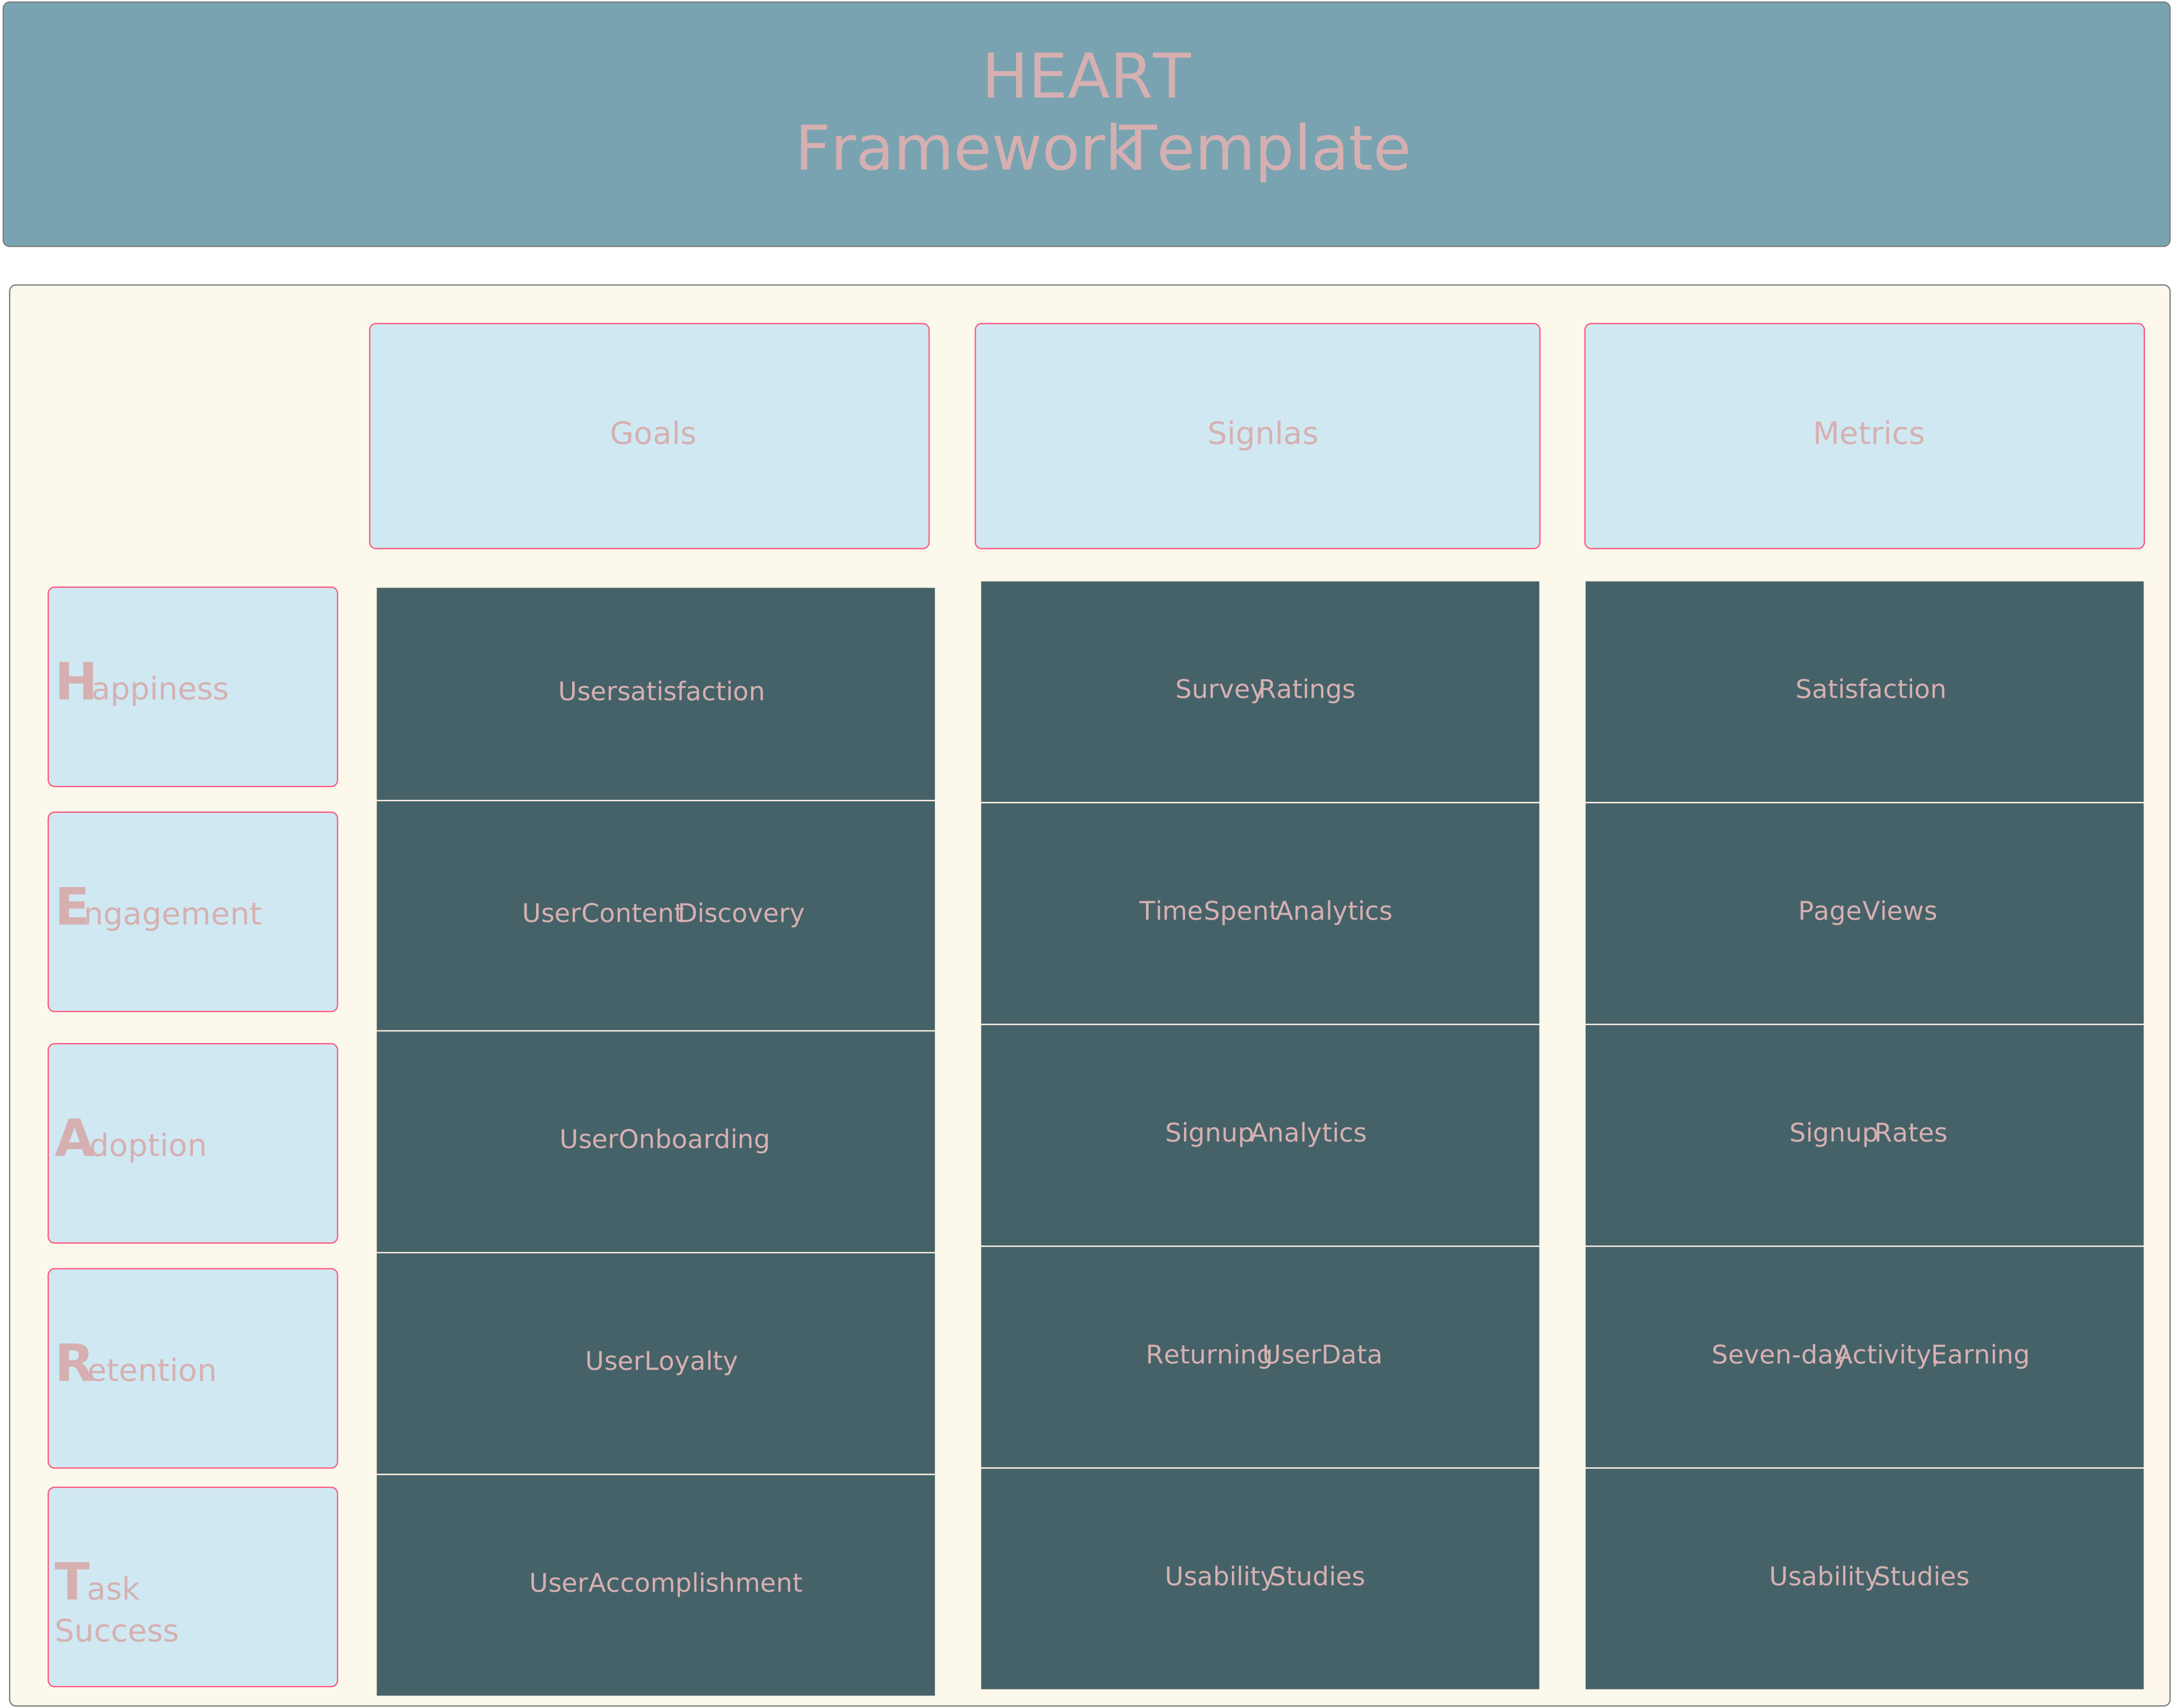
How to implement it
- Happiness – Measures user satisfaction through surveys and feedback, helping teams refine product features to improve the experience.
- Engagement – Tracks how actively users interact with the product, such as session time and frequency of use, to assess value and interest.
- Adoption – Measures new users and feature adoption, helping teams identify growth opportunities and product appeal.
- Retention – Tracks how many users continue to use the product over time, indicating long-term value and product success.
- Task success – Evaluates how well users can complete goals within the product, highlighting usability and ease of navigation.
Resource:
35. AARRR (Pirate Metrics)
The AARRR framework, also known as the “pirate metrics,” is a product management framework that focuses on five key stages of a customer’s journey: Acquisition, Activation, Retention, Referral, and Revenue. It helps product teams track and improve customer engagement and business growth by analyzing each step of the user lifecycle.

How to use it
- Acquisition – Measure how users discover and sign up for the product through various channels like marketing or social media.
- Activation – Track whether users experience the product’s core value by completing key actions, such as setting up the product or using important features.
- Retention – Monitor how often users return and engage with the product, indicating ongoing value and satisfaction.
- Referral – Measure how likely users are to recommend the product to others, which shows satisfaction and can drive organic growth.
- Revenue – Track how the product generates income, whether through subscriptions, sales, or ads, and identify opportunities to increase revenue.
Importance of Product Management Frameworks
Product management frameworks play a crucial role in helping teams navigate the complex process of developing and launching products. These frameworks provide structure, clarity, and guidance, making it easier to manage projects, align with business goals, and meet customer needs.
Here’s why product management frameworks are so important:
- Clear direction – Frameworks offer a step-by-step approach to product development, helping teams stay focused and organized. With a clear path, it’s easier to prioritize tasks and avoid getting lost in the details.
- Improved decision-making – Frameworks help product teams make better decisions by providing tools and metrics to assess different options. They ensure decisions are based on data, user feedback, and strategic goals, not just assumptions.
- Aligning teams – Frameworks promote collaboration and alignment among cross-functional teams, like design, engineering, and marketing. Everyone knows the goals, processes, and priorities, making teamwork smoother and more effective.
- Reducing risk – By following a framework, teams can identify potential risks early, whether it’s user dissatisfaction, technical challenges, or market changes. This proactive approach helps minimize costly mistakes and failures.
- Increased efficiency – Frameworks help teams avoid reinventing the wheel. They provide tested methods and best practices, allowing teams to work more efficiently and focus on what matters most.
- Continuous improvement – Frameworks encourage regular evaluation and iteration. Teams can gather insights, track progress, and refine their strategies, ensuring the product evolves to meet changing customer needs and market conditions.
Conclusion: Product Management Frameworks
Product management frameworks offer structure and clarity for teams navigating the product development process. They help teams stay focused, prioritize effectively, and ensure they’re solving the right problems for customers.
By using the product management frameworks in this guide, teams can make better decisions, stay aligned, and create products that meet user needs and business goals. There’s no one-size-fits-all solution, so be open to adjusting product management frameworks as your team and product grow.
In the end, product management frameworks are helpful tools to guide your work—use them wisely and keep adapting as you learn.
FAQs about Product Management Frameworks
Why are product management frameworks important?
How do I choose the right product management framework for my team?
What are the key components of a good product management framework?
Can a product management framework be adapted to different industries?
How do product management frameworks help with decision-making?
Can product management frameworks be used for both small startups and large enterprises?