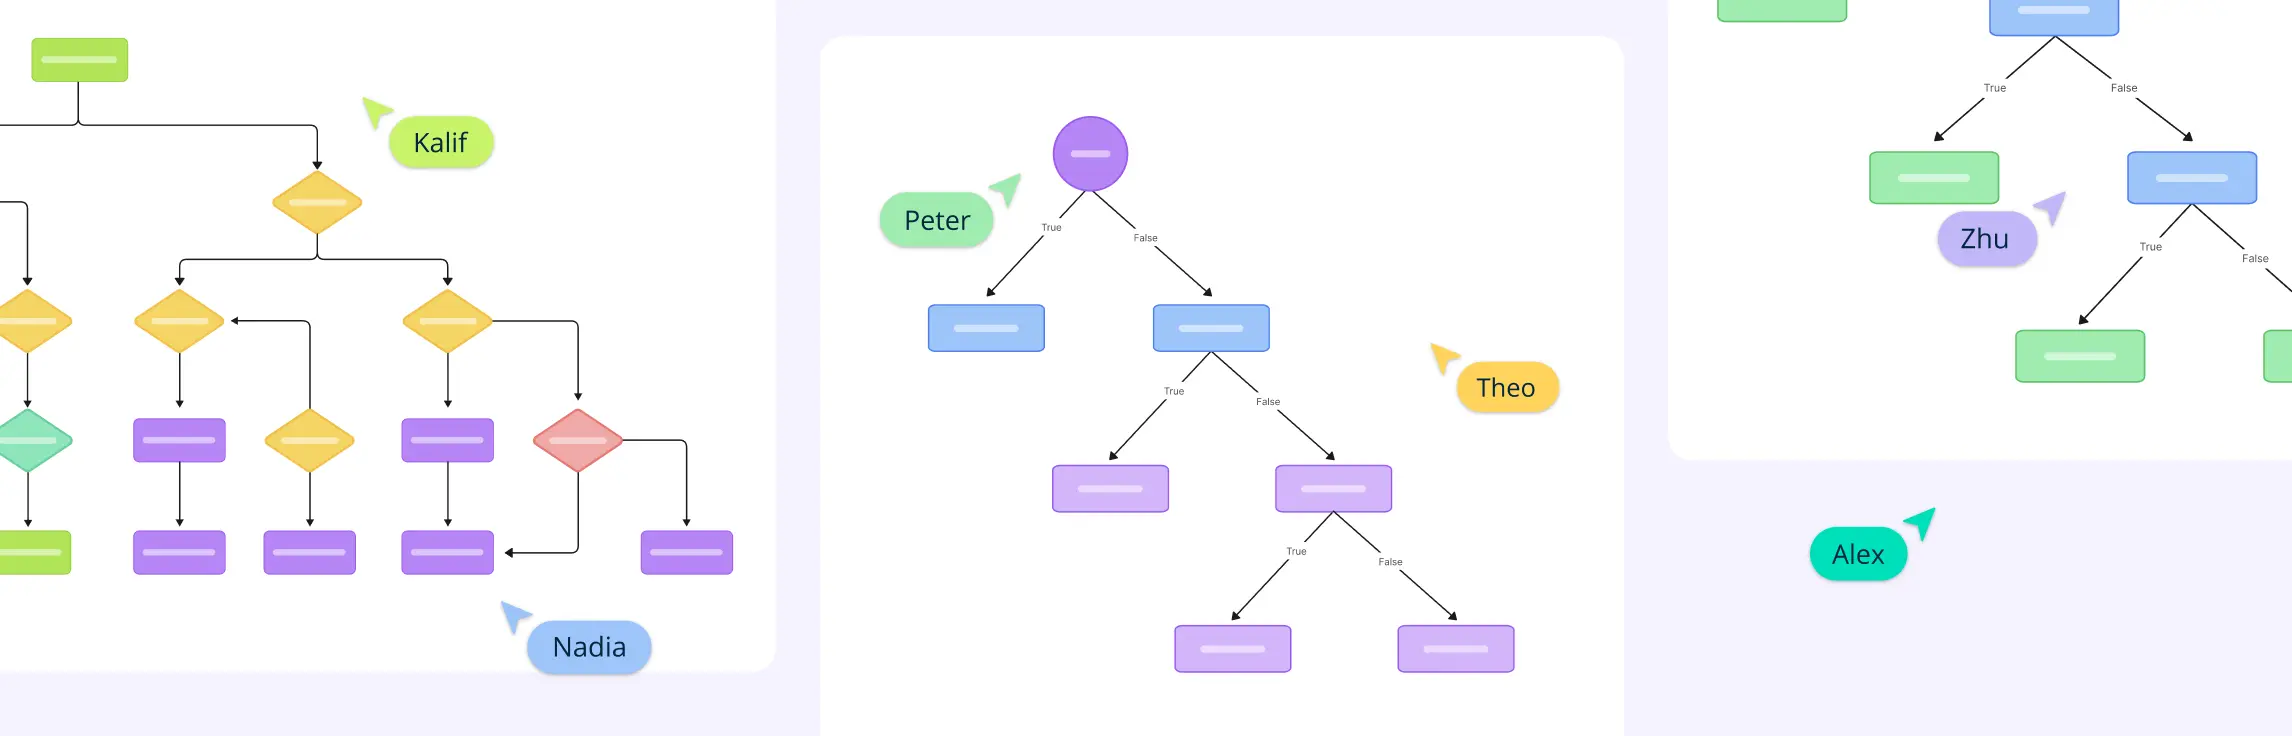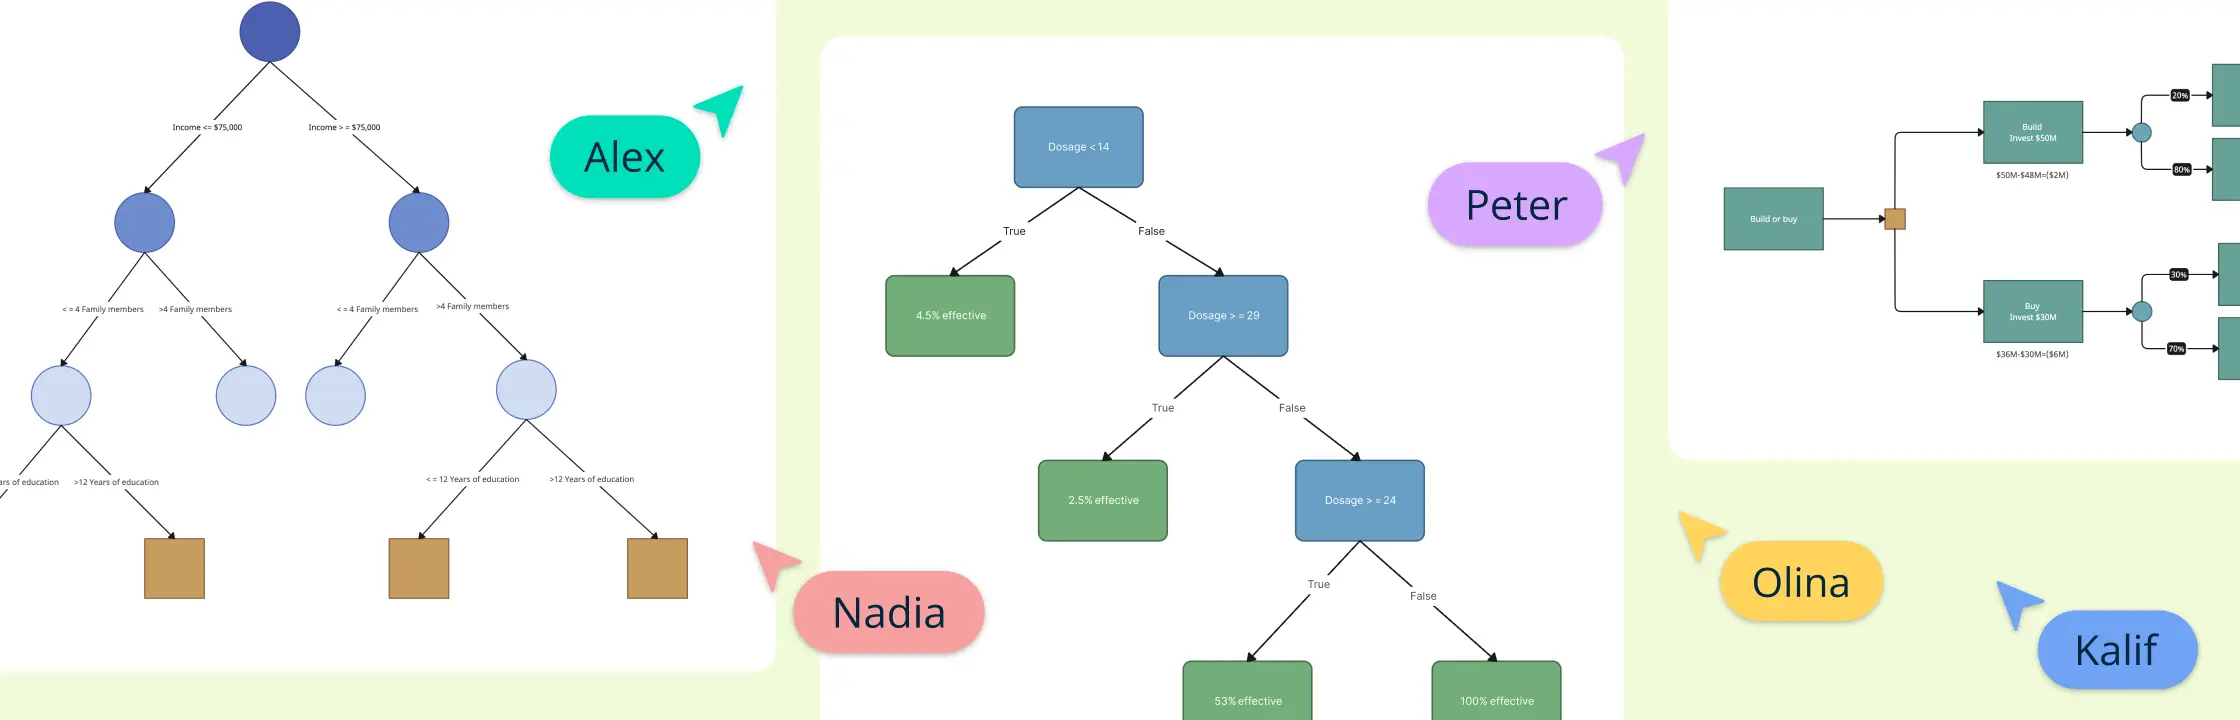
A decision tree maps a question into choices, uncertain events, and possible outcomes. For example, a team deciding whether to launch a service now or test it first can draw both paths, then show what happens if the test succeeds or fails. This guide explains how to read and create that kind of tree, with examples and a brief look at decision trees used in machine learning.
What is a Decision Tree?
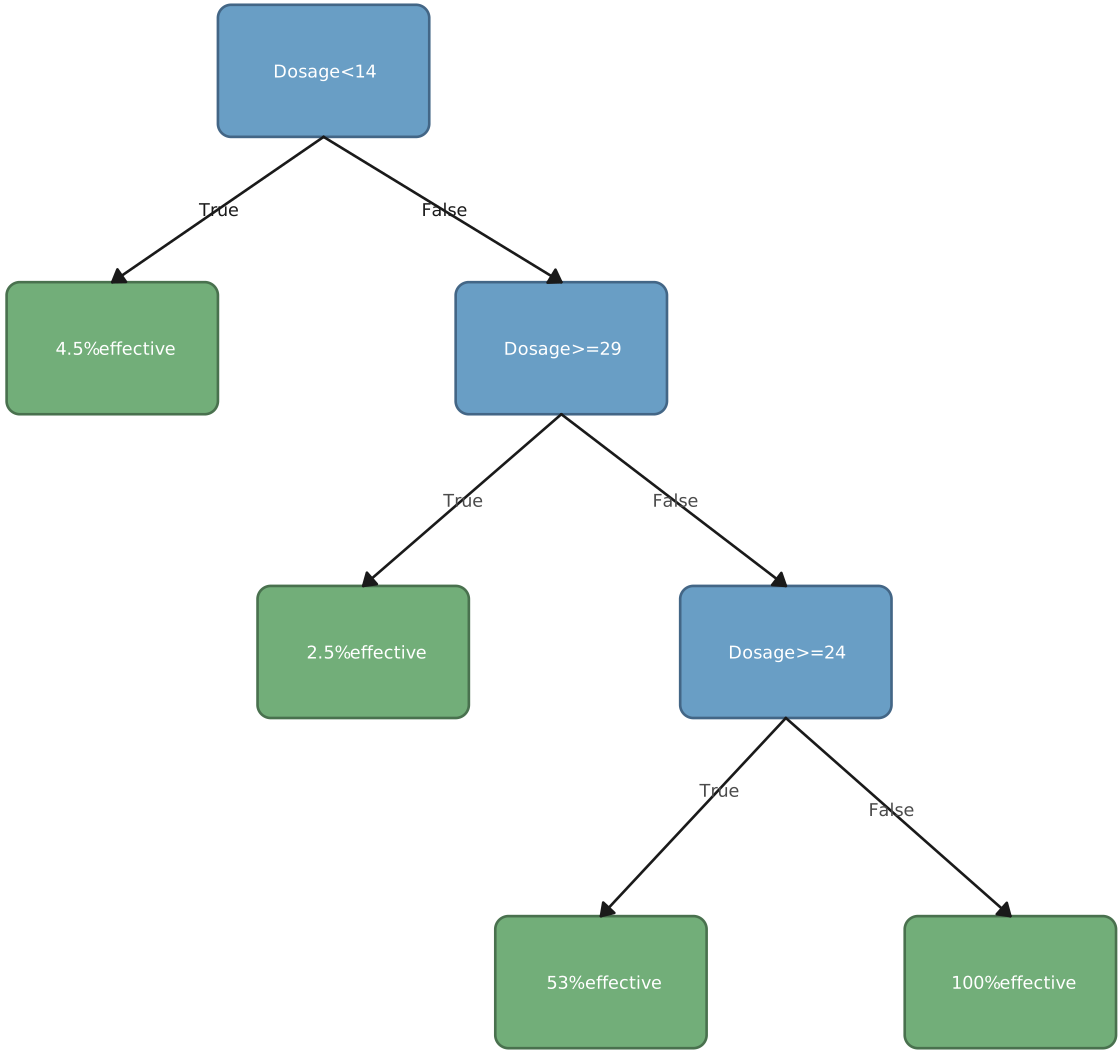
A decision tree is a graphical representation that outlines the various choices available and the potential outcomes of those choices. It begins with a root node, which represents the initial decision or problem. From this root node, branches extend to represent different options or actions that can be taken. Each branch leads to further decision nodes, where additional choices can be made, and these in turn branch out to show the possible consequences of each decision. This continues until the branches reach leaf nodes, which represent the final outcomes or decisions.
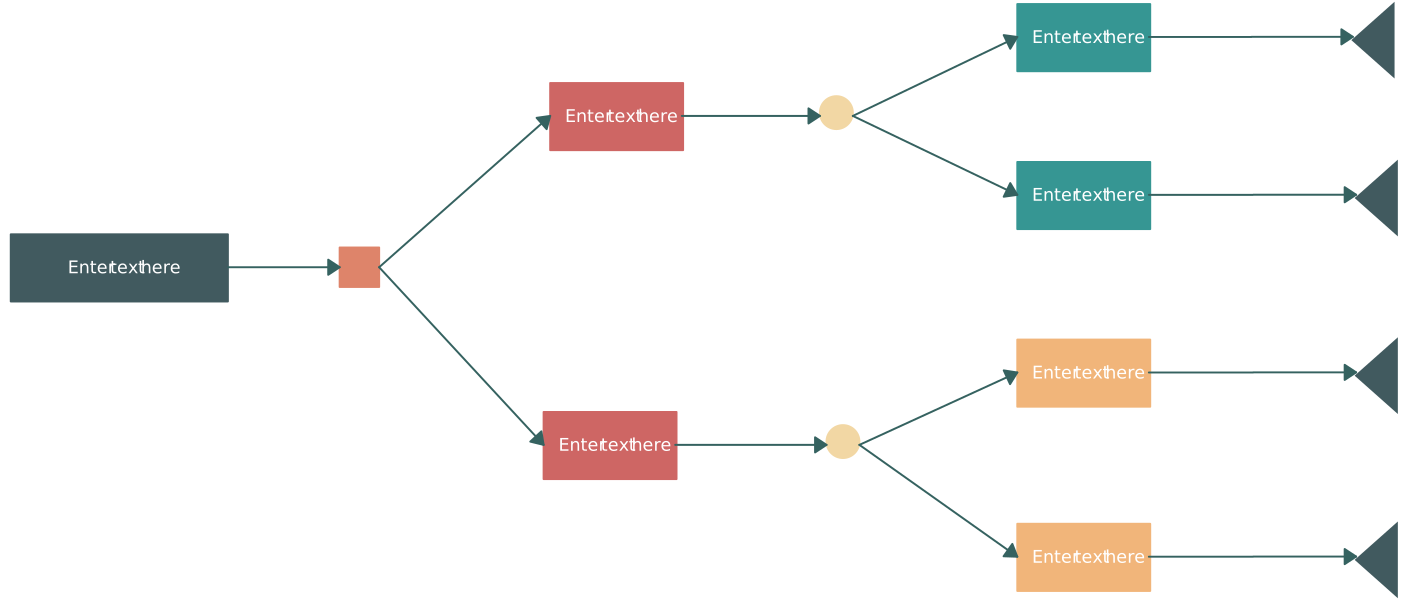

The decision tree structure allows for a clear and organized way to visualize the decision-making process, making it easier to understand how different choices lead to different results. This is particularly useful in complex scenarios where multiple factors and potential outcomes need to be considered. By breaking down the decision process into manageable steps and visually mapping them out, decision trees help decision-makers evaluate the potential risks and benefits of each option, leading to more informed and rational decisions.
Decision trees are useful tools in many fields like business, healthcare, and finance. They help analyze things systematically by providing a simple way to compare different strategies and their likely impacts. This helps organizations and individuals make decisions that are not only based on data but also transparent and justifiable. This ensures that the chosen path aligns with their objectives and constraints.
Decision Tree Symbols
Understanding the symbols used in a decision tree is essential for interpreting and creating decision trees effectively. Here are the main symbols and their meanings:
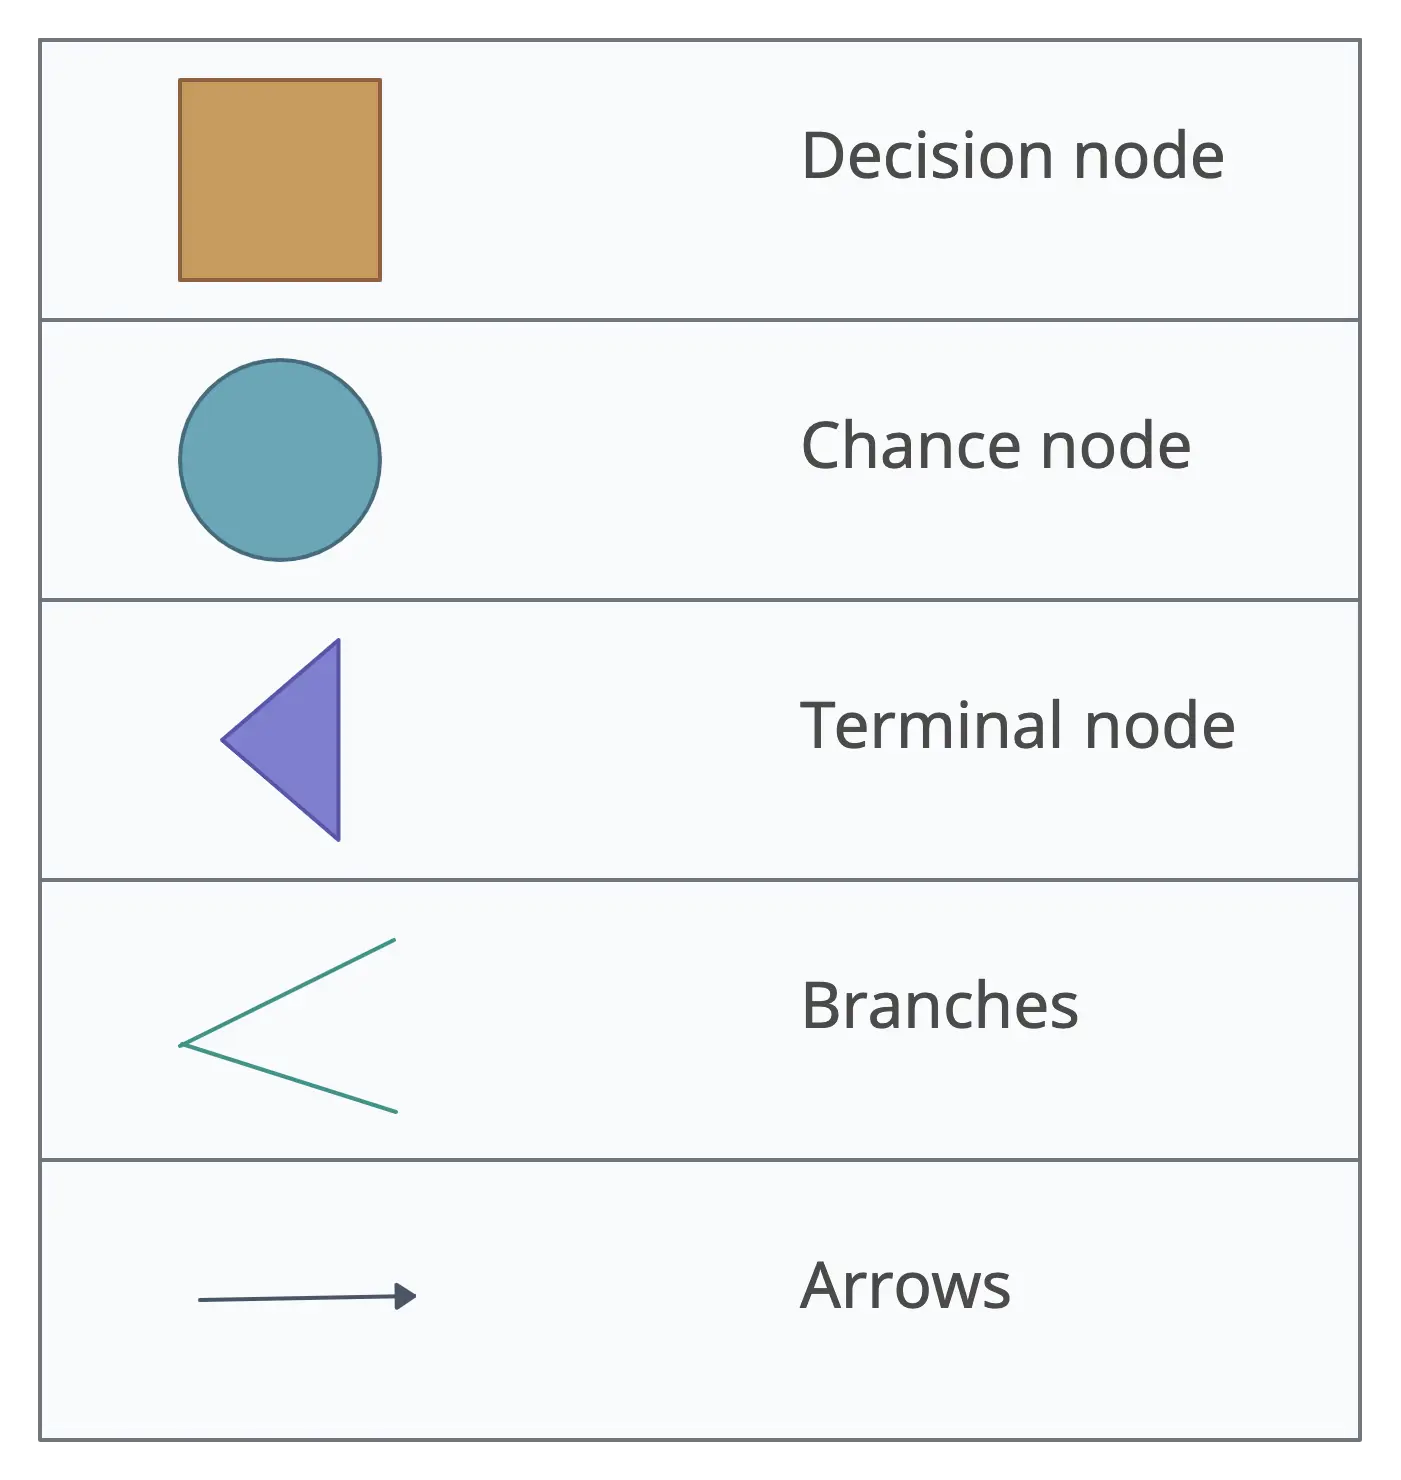
- Decision node: A point in the decision tree where a choice needs to be made. Represents decisions that split the tree into branches, each representing a possible choice.
- Chance node: A point where an outcome is uncertain. Represents different possible outcomes of an event, often associated with probabilities.
- Terminal (or end) node: The end point of a decision path. Represents the final outcome of a series of decisions and chance events, such as success or failure.
- Branches: Lines that connect nodes to show the flow from one decision or chance node to the next. Represent the different paths that can be taken based on decisions and chance events.
- Arrows: Indicate the direction of flow from one node to another. Show the progression from decisions and chance events to outcomes.
Types of Decision Trees
Decision trees serve two related purposes. A team can draw a tree to compare actions and possible outcomes. In machine learning, an algorithm builds a tree from data to make predictions. The classification and regression trees below are types of the latter; you do not need either algorithm to map a business decision.
Classification Trees
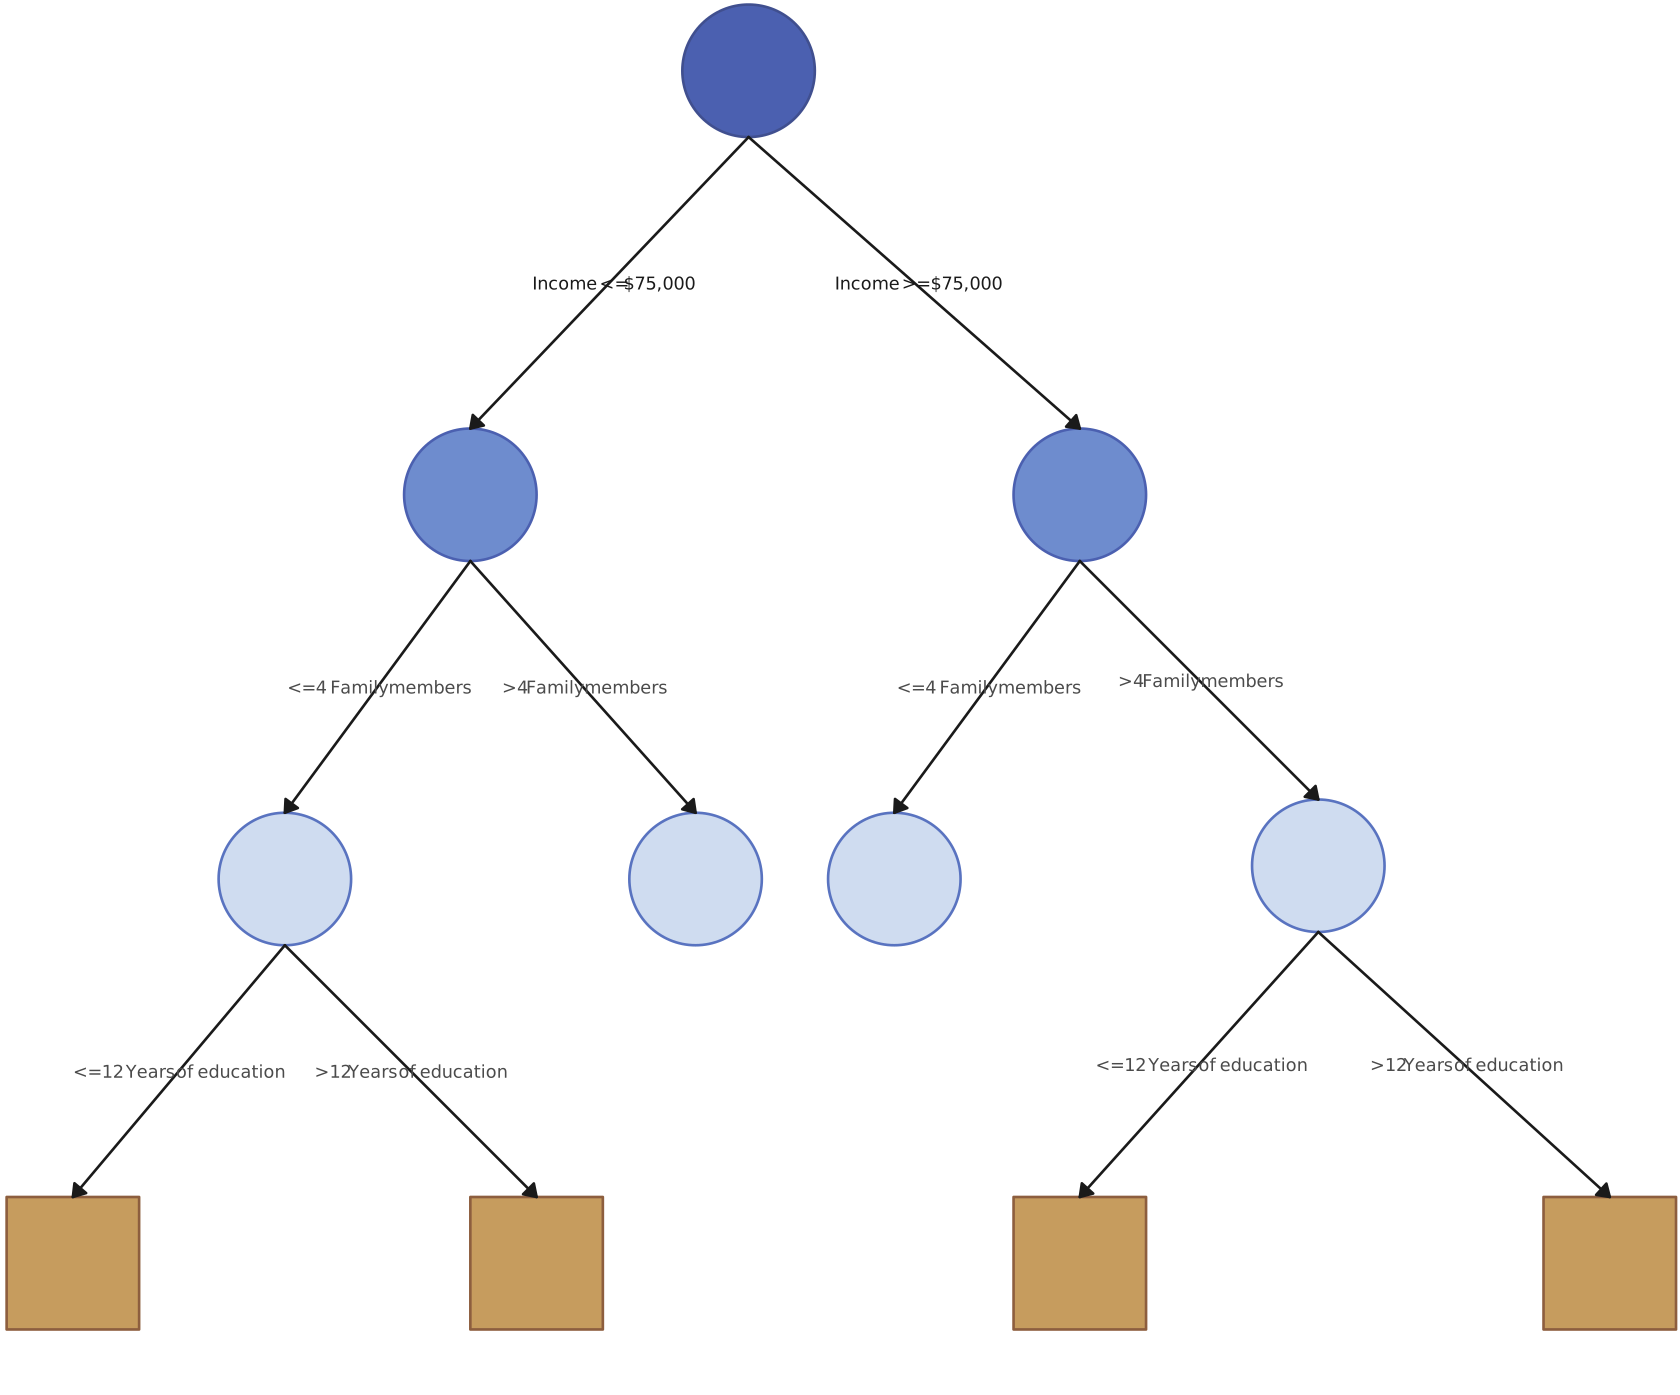
Classification trees are used when the target variable is categorical. The tree splits the dataset into subsets based on the values of attributes, aiming to classify instances into classes or categories. For example, determining whether an email is spam or not spam.
Regression Trees
Regression trees are employed when the target variable is continuous. They predict outcomes that are real numbers or continuous values by recursively partitioning the data into smaller subsets. For example, predicting the price of a house based on its features.
How to Make a Decision Tree in 7 Steps
Use these steps to map a decision and its possible outcomes. For a simple qualitative tree, you can skip the calculations in steps 5 and 6. Add them when you have credible probability and value estimates and need to compare options numerically.
If your immediate task is to place a small decision tree in a document, follow the Google Docs decision tree tutorial for the drawing and insertion steps.
1. Define the decision objective
- Identify the goal: Clearly articulate what decision you need to make. This could be a choice between different strategic options, such as launching a product, entering a new market, or investing in new technology.
- Scope: Determine the boundaries of your decision. What factors and constraints are relevant? This helps in focusing the decision-making process and avoiding unnecessary complexity.
2. Gather relevant data
- Collect information: Gather all the necessary information related to your decision. This might include historical data, market research, financial reports, and expert opinions.
- Identify key factors: Determine the critical variables that will influence your decision. These could be costs, potential revenues, risks, resource availability, or market conditions.
3. Identify decision points and outcomes
- Decision points: Identify all the points where a decision needs to be made. Each decision point should represent a clear choice between different actions.
- Possible outcomes: List the plausible results of each action, including unfavorable ones. Note their likelihood and impact if you have reliable estimates.
4. Structure the decision tree
- Root node: Start with the main decision or question at the root of your tree. This represents the initial decision point.
- Branches: Draw branches from the root to represent each possible decision or action. Each branch leads to a node, which represents subsequent decisions or outcomes.
- Nodes: At the end of each branch, add nodes that represent the next decision point or the final outcome. Continue branching out until all possible decisions and outcomes are covered.
5. Assign probabilities and values when useful
- Probability of outcomes: If you are comparing uncertain outcomes numerically, estimate their probabilities from relevant data or informed judgment. Label assumptions clearly; a qualitative tree does not require percentages.
- Impact assessment: Evaluate the impact or value of each outcome. This might involve estimating potential costs, revenues, or other metrics relevant to your decision.
6. Calculate expected values if you have estimates
- Expected value calculation: For an option with several possible outcomes, multiply each outcome’s estimated probability by its value, then add the results. Do this separately for each option you want to compare.
- Example: For a decision to launch a product, you might have a 60% chance of success with an impact of $500,000, and a 40% chance of failure with an impact of -$200,000.
- Expected value: (0.6 * $500,000) + (0.4 * -$200,000) = $300,000 - $80,000 = $220,000
- Compare paths: Compare the options’ expected values alongside risks and constraints. A higher expected value does not automatically make an option the right choice.
7. Optimize and prune the tree
- Prune irrelevant branches: Remove branches that do not significantly impact the decision. This helps in simplifying the decision tree and focusing on the most critical factors.
- Simplify the tree: Aim to make the decision tree as straightforward as possible while retaining all necessary information. A simpler tree is easier to understand and use.
How to Read a Decision Tree
Read a decision tree from its root to a terminal outcome, following one branch at each point. In a hand-built decision tree, a node may represent a choice or an uncertain event; the branch label tells you which action or result leads to the next node. In a machine-learning tree, nodes usually test data attributes and branches show the results of those tests.
For example, in a project management decision tree, you might start at the root node, which could represent the choice between two project approaches (A and B). From there, you follow the branch for Approach A or Approach B. Each subsequent node represents another decision, such as cost or time, and each branch represents the conditions of that decision (e.g., high cost vs. low/medium cost).
As you continue following the branches, you eventually reach a leaf node, which gives you the final outcome based on the path you took. For instance, if you followed the path for Approach A with high cost, you might reach a leaf node indicating project failure. Conversely, Approach B with a short time might lead you to a leaf node indicating project success.
Decision Tree Best Practices
Follow these best practices to develop and deploy decision trees that are reliable and effective tools for making informed decisions across various domains.
- Define clear objectives: Clearly articulate the decision you need to make and its scope. This helps in focusing the analysis and ensuring the decision tree addresses the right questions.
- Gather quality data: Gather relevant and accurate data that will be used to build and validate the decision tree. Ensure the data is representative and covers all necessary factors influencing the decision.
- Keep it simple: Aim for simplicity in the decision tree structure. Avoid unnecessary complexity that can confuse users or obscure key decision points.
- Understand and involve stakeholders: Involve stakeholders who will be impacted by or involved in the decision-making process. Ensure they understand the decision tree’s construction and can provide input on relevant factors and outcomes.
- Validate and verify: Validate the data used to build the decision tree to ensure its accuracy and reliability. Use techniques such as cross-validation or sensitivity analysis to verify the robustness of the tree.
- Interpretability: Use clear and intuitive visual representations of the decision tree. This aids in understanding how decisions are made and allows stakeholders to follow the logic easily.
- Consider uncertainty and risks: Incorporate probabilities of outcomes and consider uncertainties in data or assumptions. This helps in making informed decisions that account for potential risks and variability.
How Can a Decision Tree Help with Decision Making?
A decision tree simplifies the decision-making process in several key ways:
- Visual clarity: It presents decisions and their possible outcomes in a clear, visual format, making complex choices easier to understand at a glance.
- Structured approach: By breaking down decisions into a step-by-step sequence, it guides you through the decision-making process, ensuring that all factors are considered.
- Risk assessment: When you have reliable estimates, add probabilities and potential impacts to compare risks and benefits.
- Comparative analysis: Decision trees allow you to compare different choices side by side, making it easier to see which option offers the best expected value or outcome.
- Informed decisions: By organizing information logically, decision trees help you make decisions based on data and clear reasoning rather than intuition or guesswork.
- Flexibility: They can be easily updated with new information or adjusted to reflect changing circumstances, keeping the decision-making process dynamic and relevant.
Decision Tree Examples
The examples below show different ways to map choices and outcomes. Start with an editable decision tree template or build your own with the decision tree maker.
Decision Tree Analysis Example
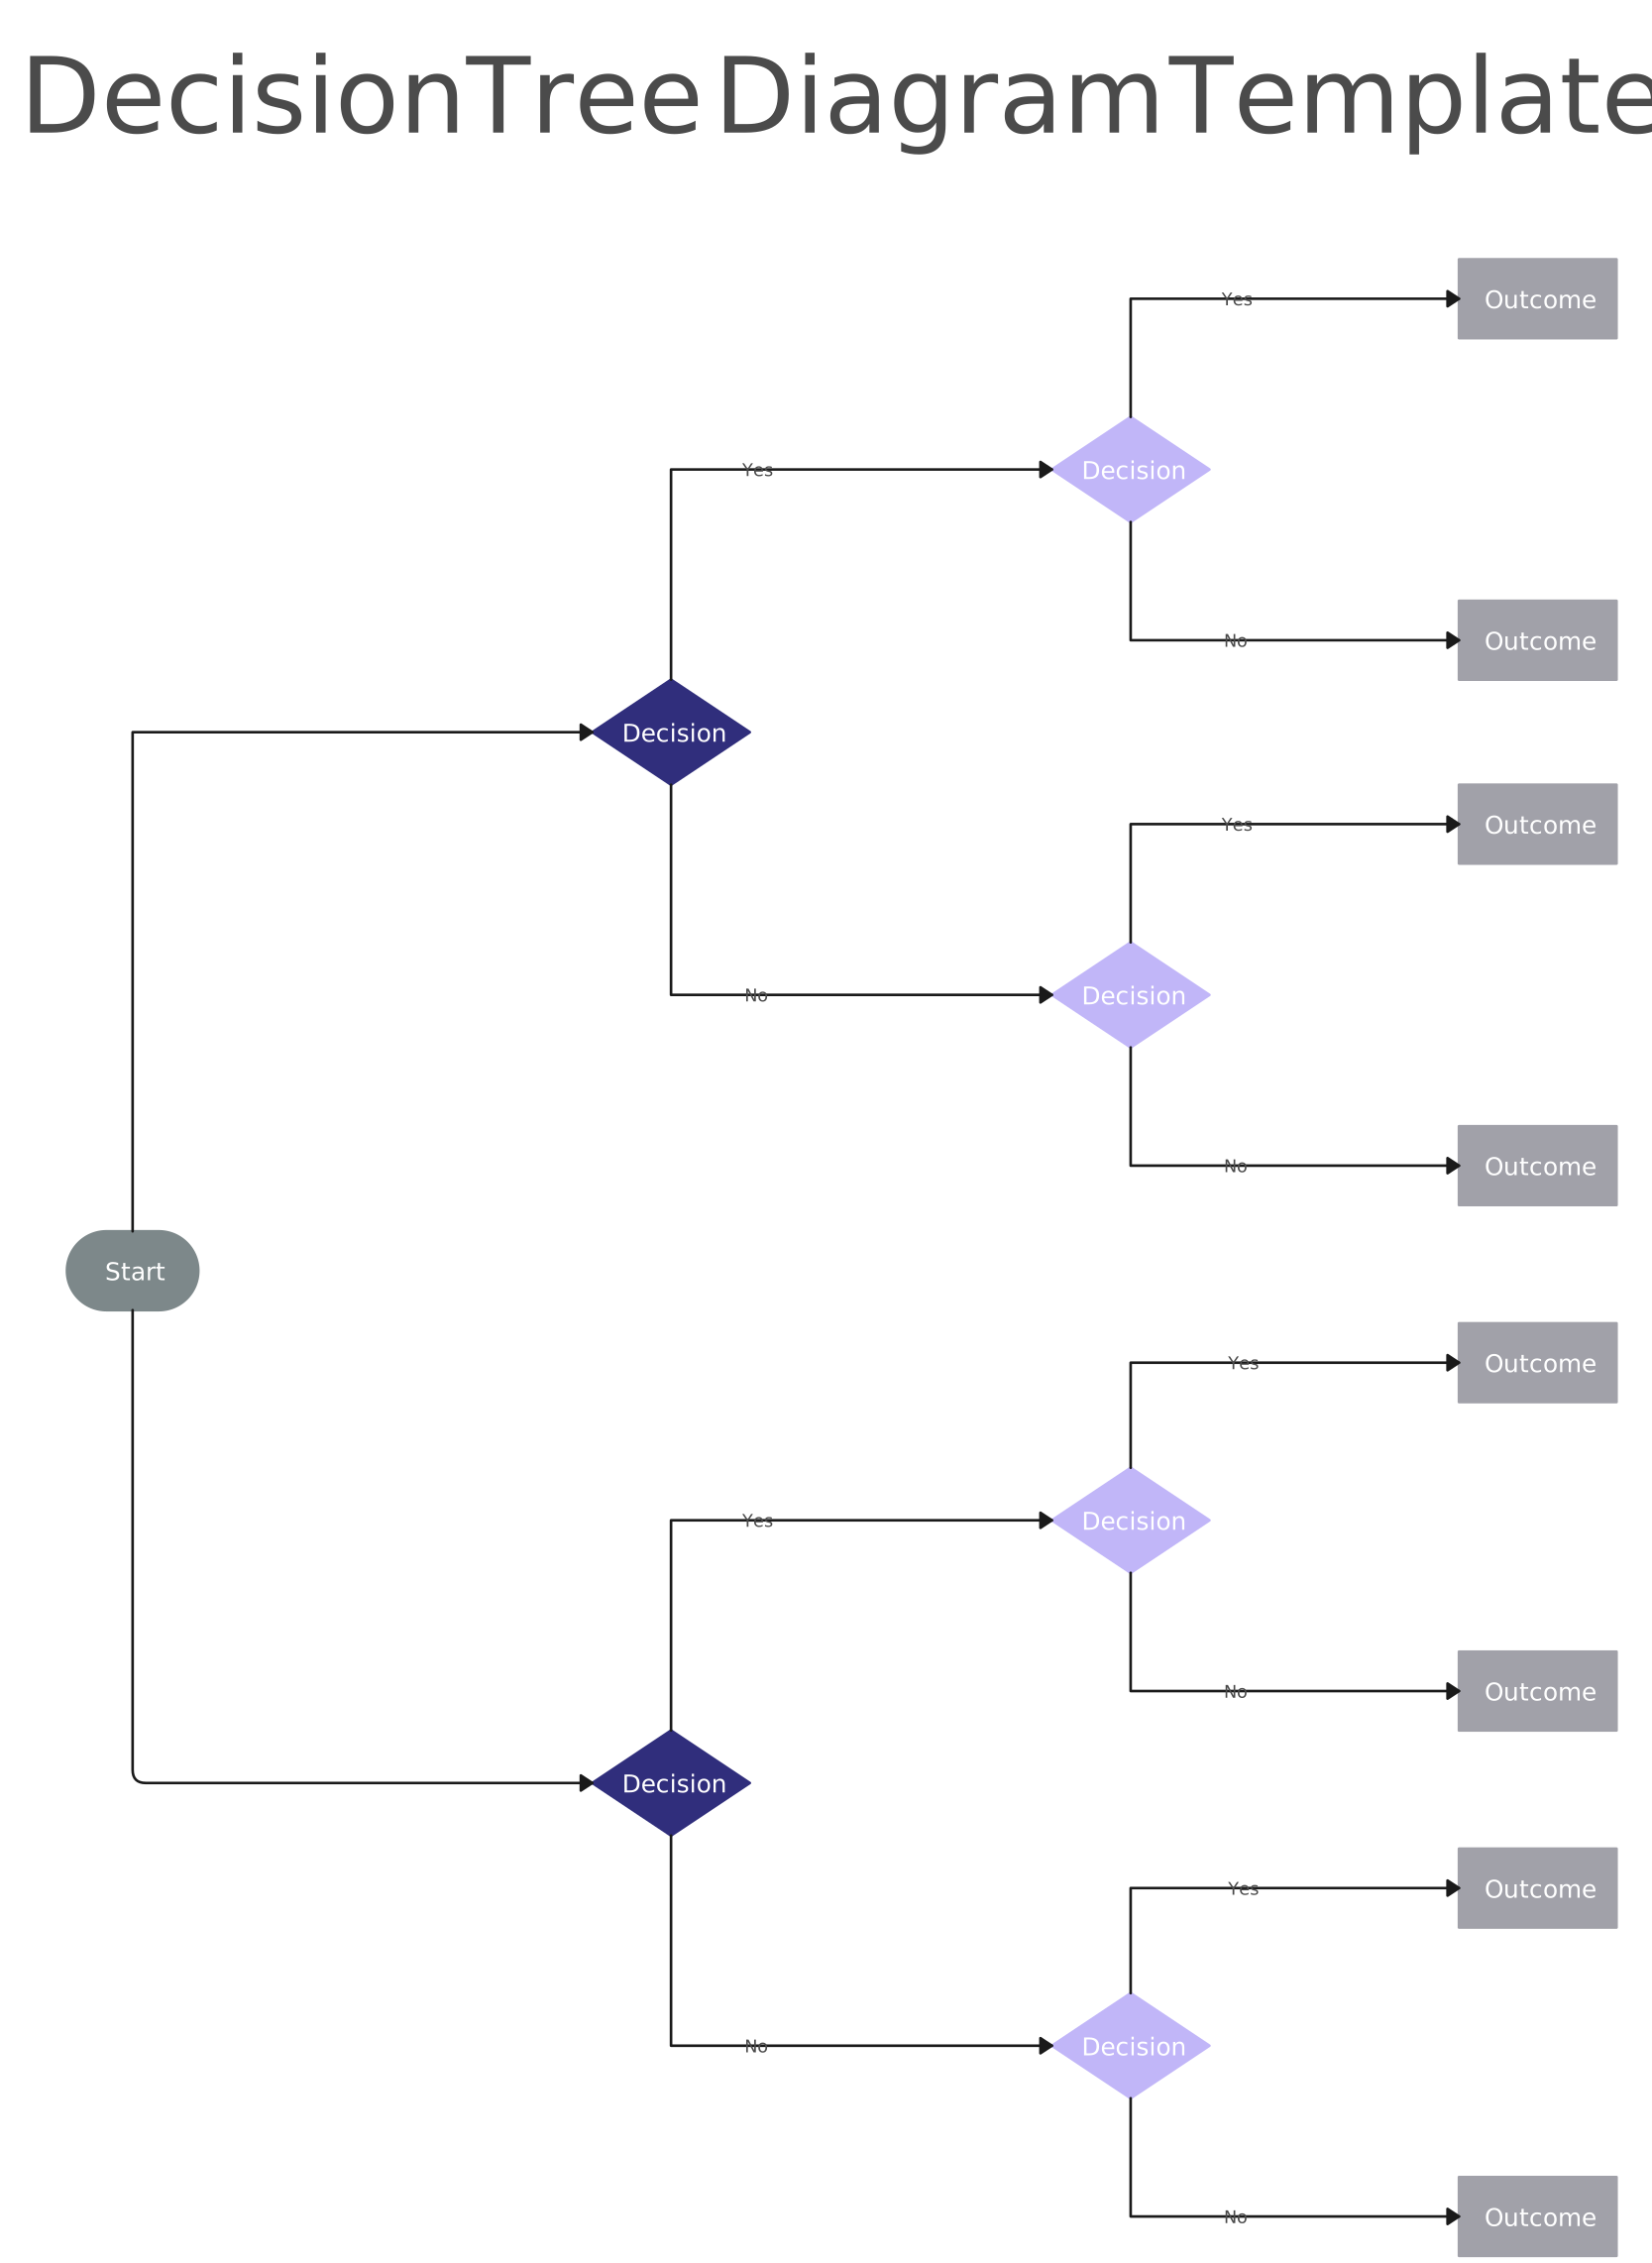
This template helps make informed decisions by systematically organizing and analyzing complex information, ensuring clarity and consistency in the decision-making process.
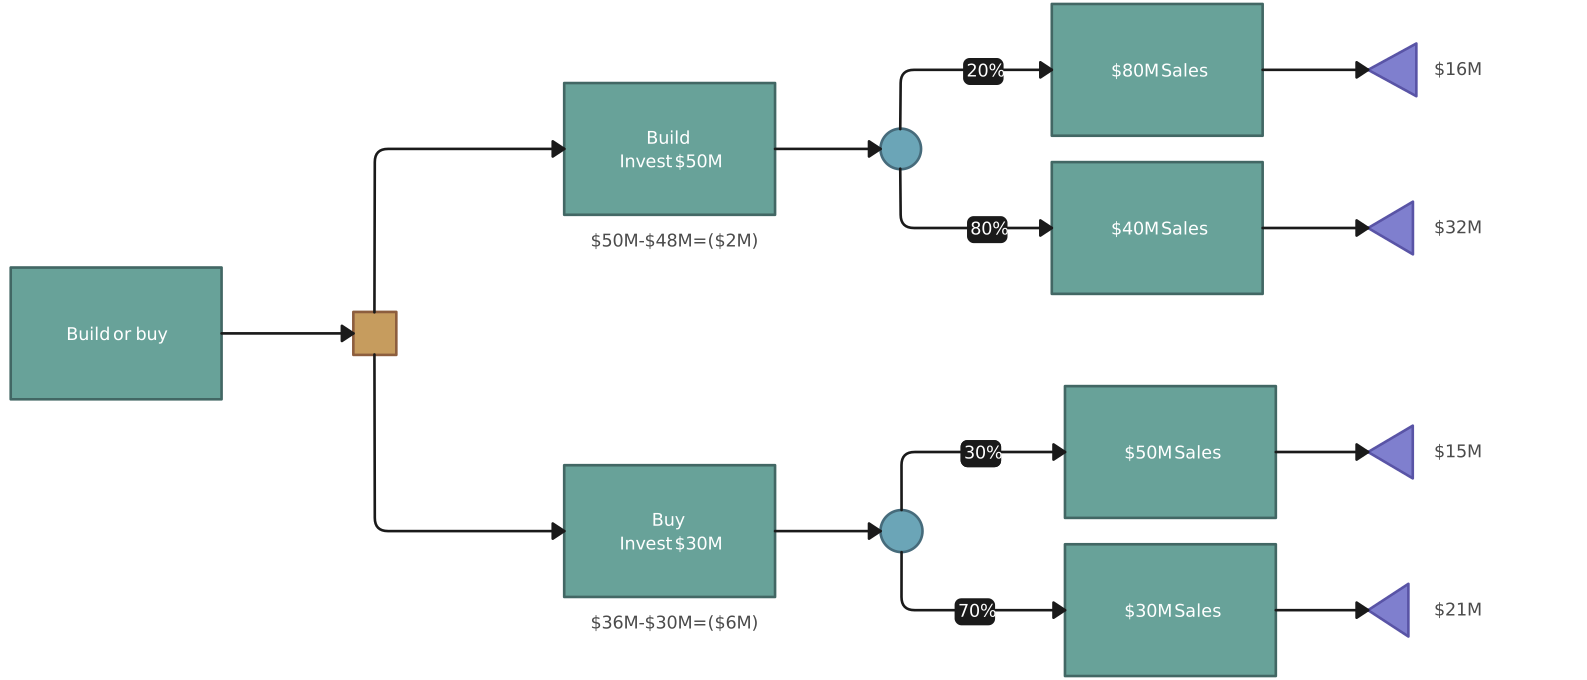
Bank decision tree
This Decision Tree helps banks decide if they should launch a new financial product by predicting outcomes based on market demand and customer interest. It guides banks in assessing risks and making informed decisions to meet market needs effectively.
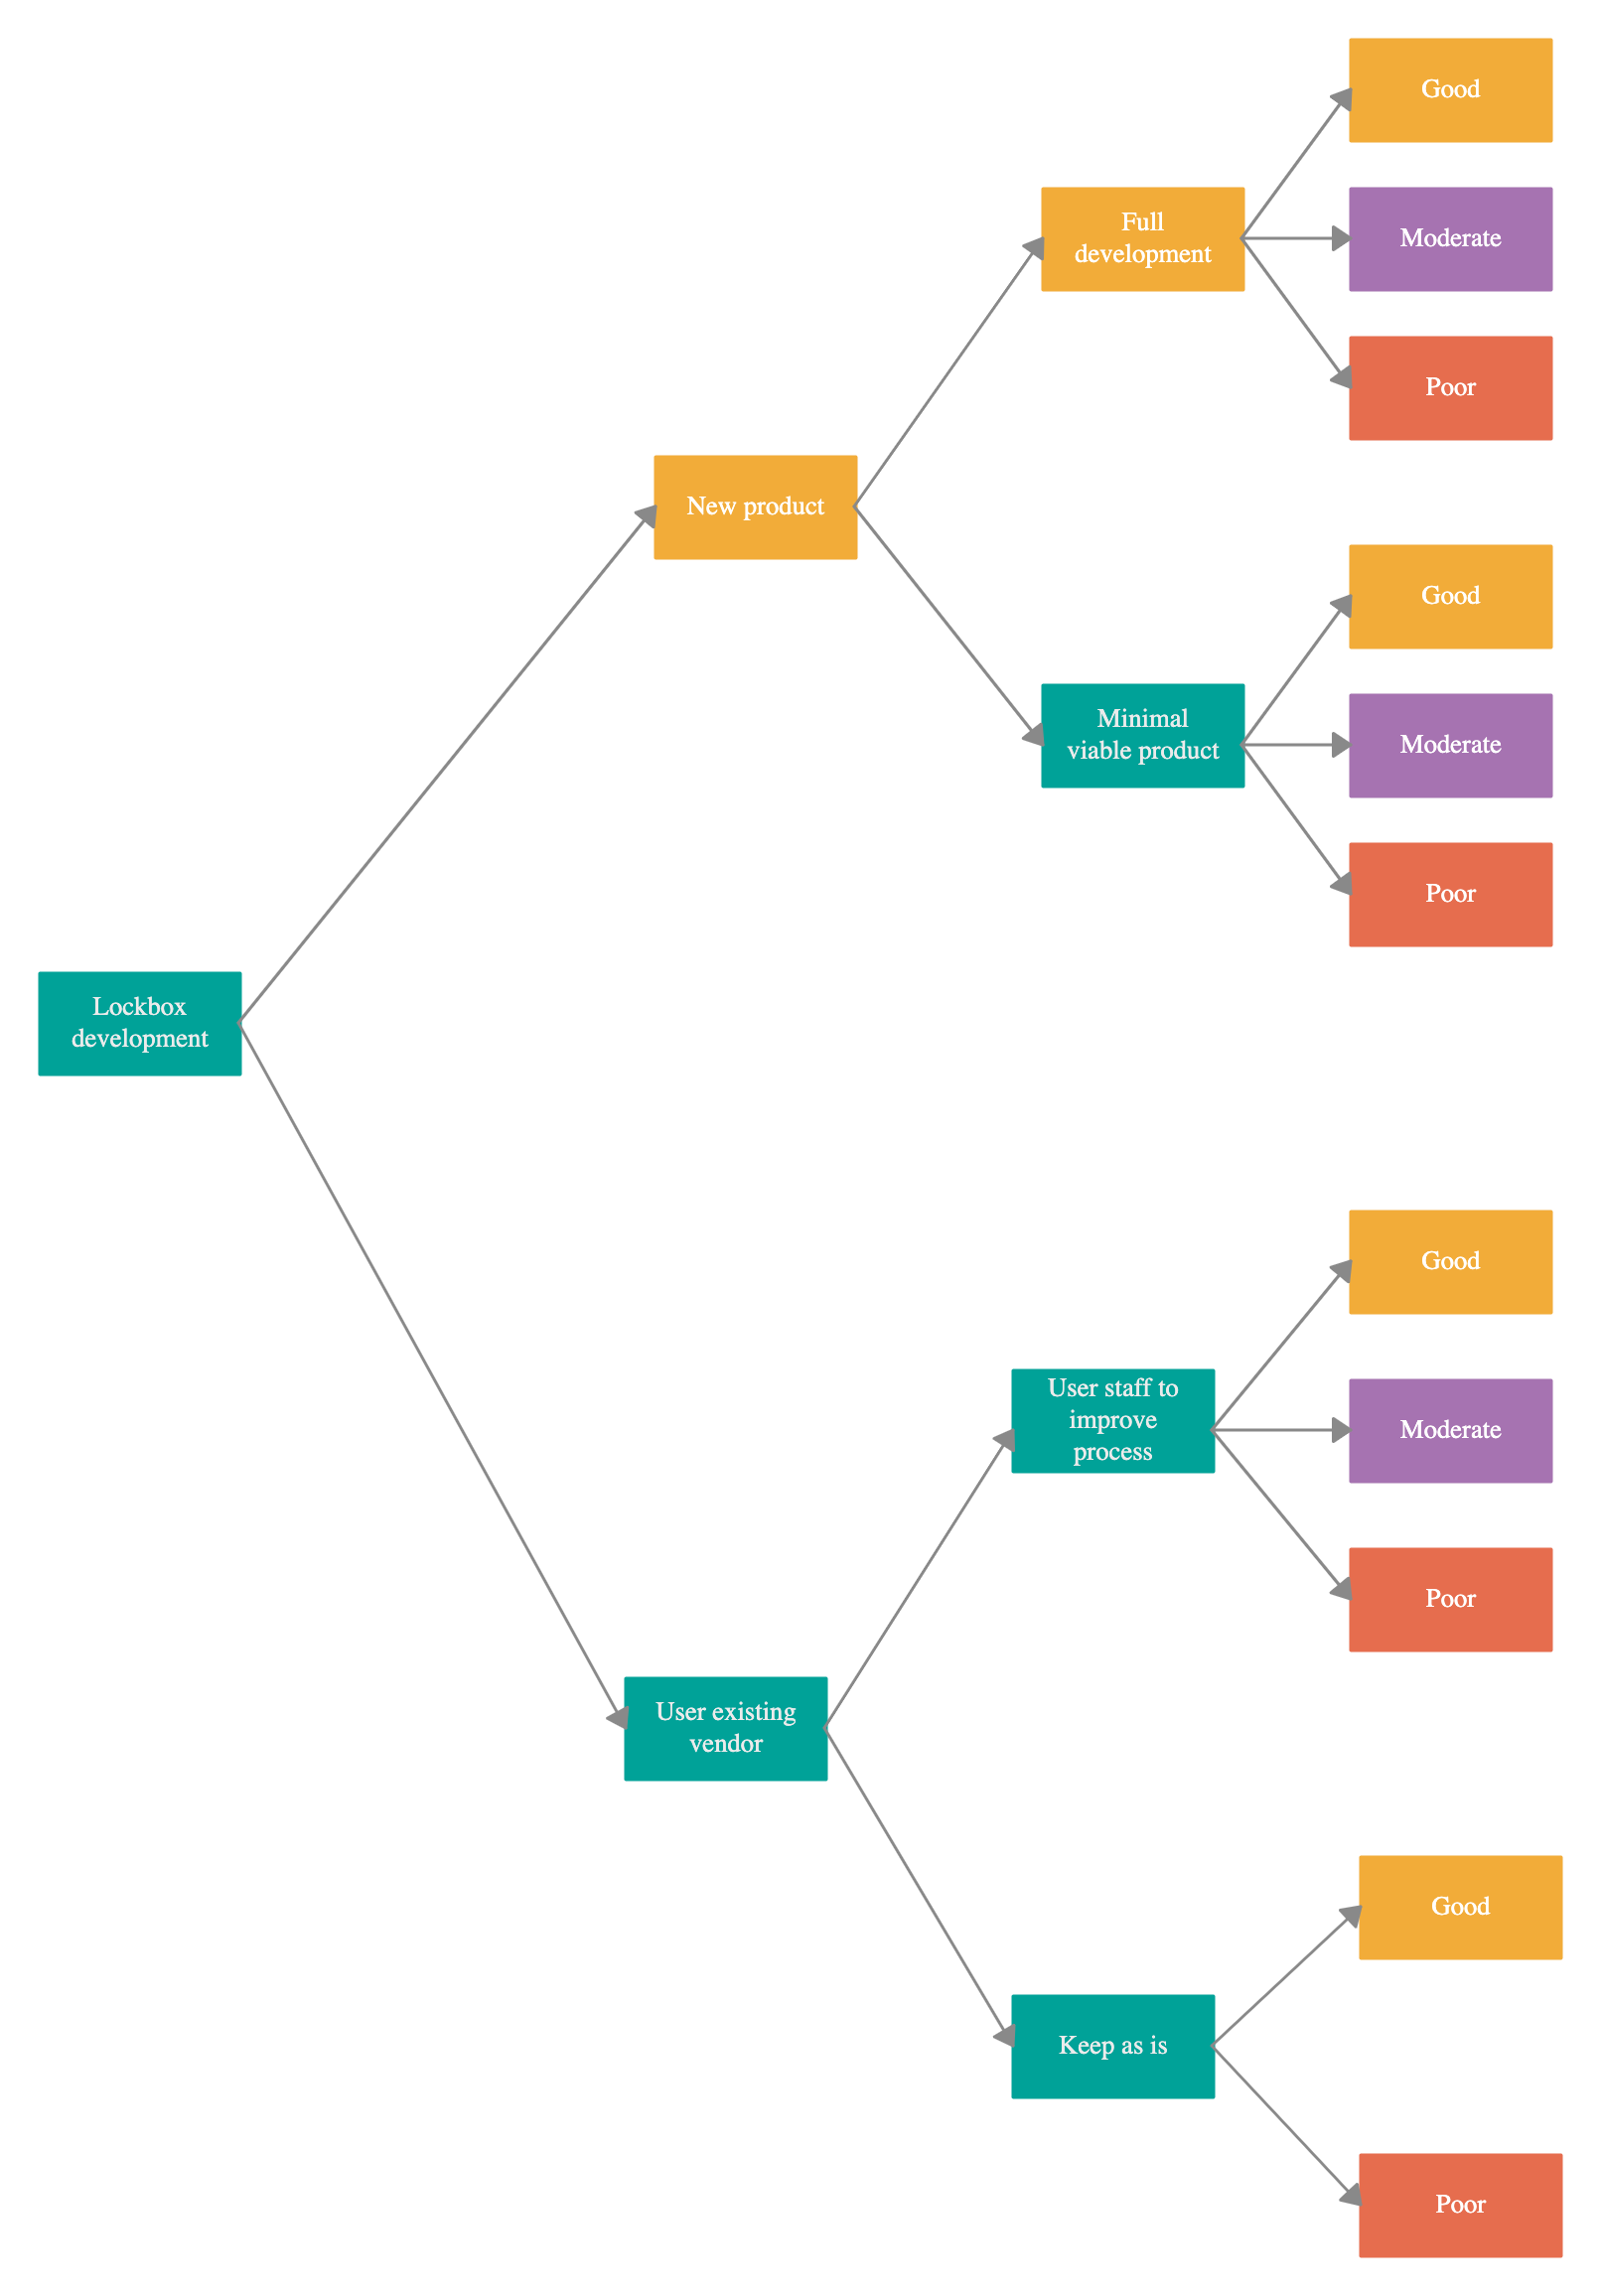
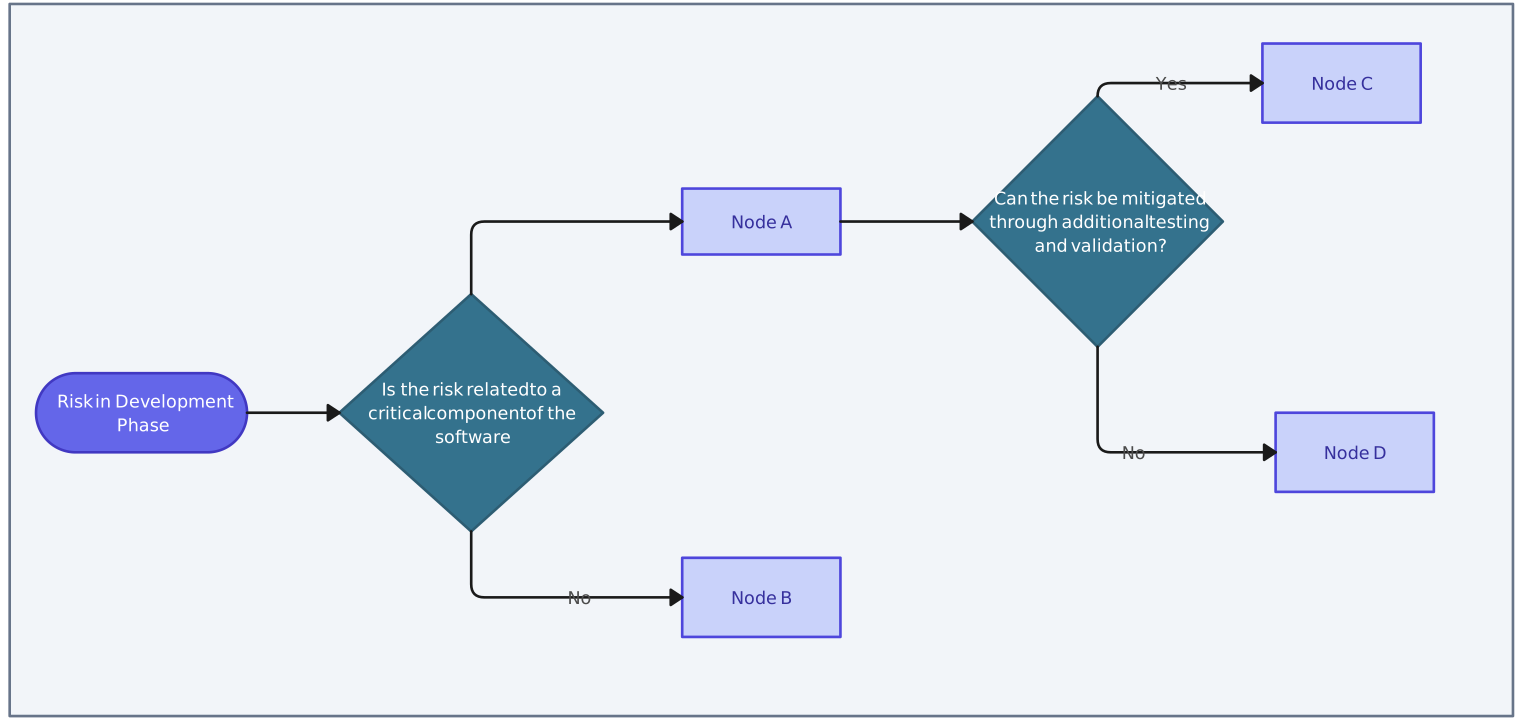
Risk decision tree for software engineering
The tree shows possible outcomes based on the severity and likelihood of each risk, guiding teams to make informed decisions that keep projects on track and within budget.
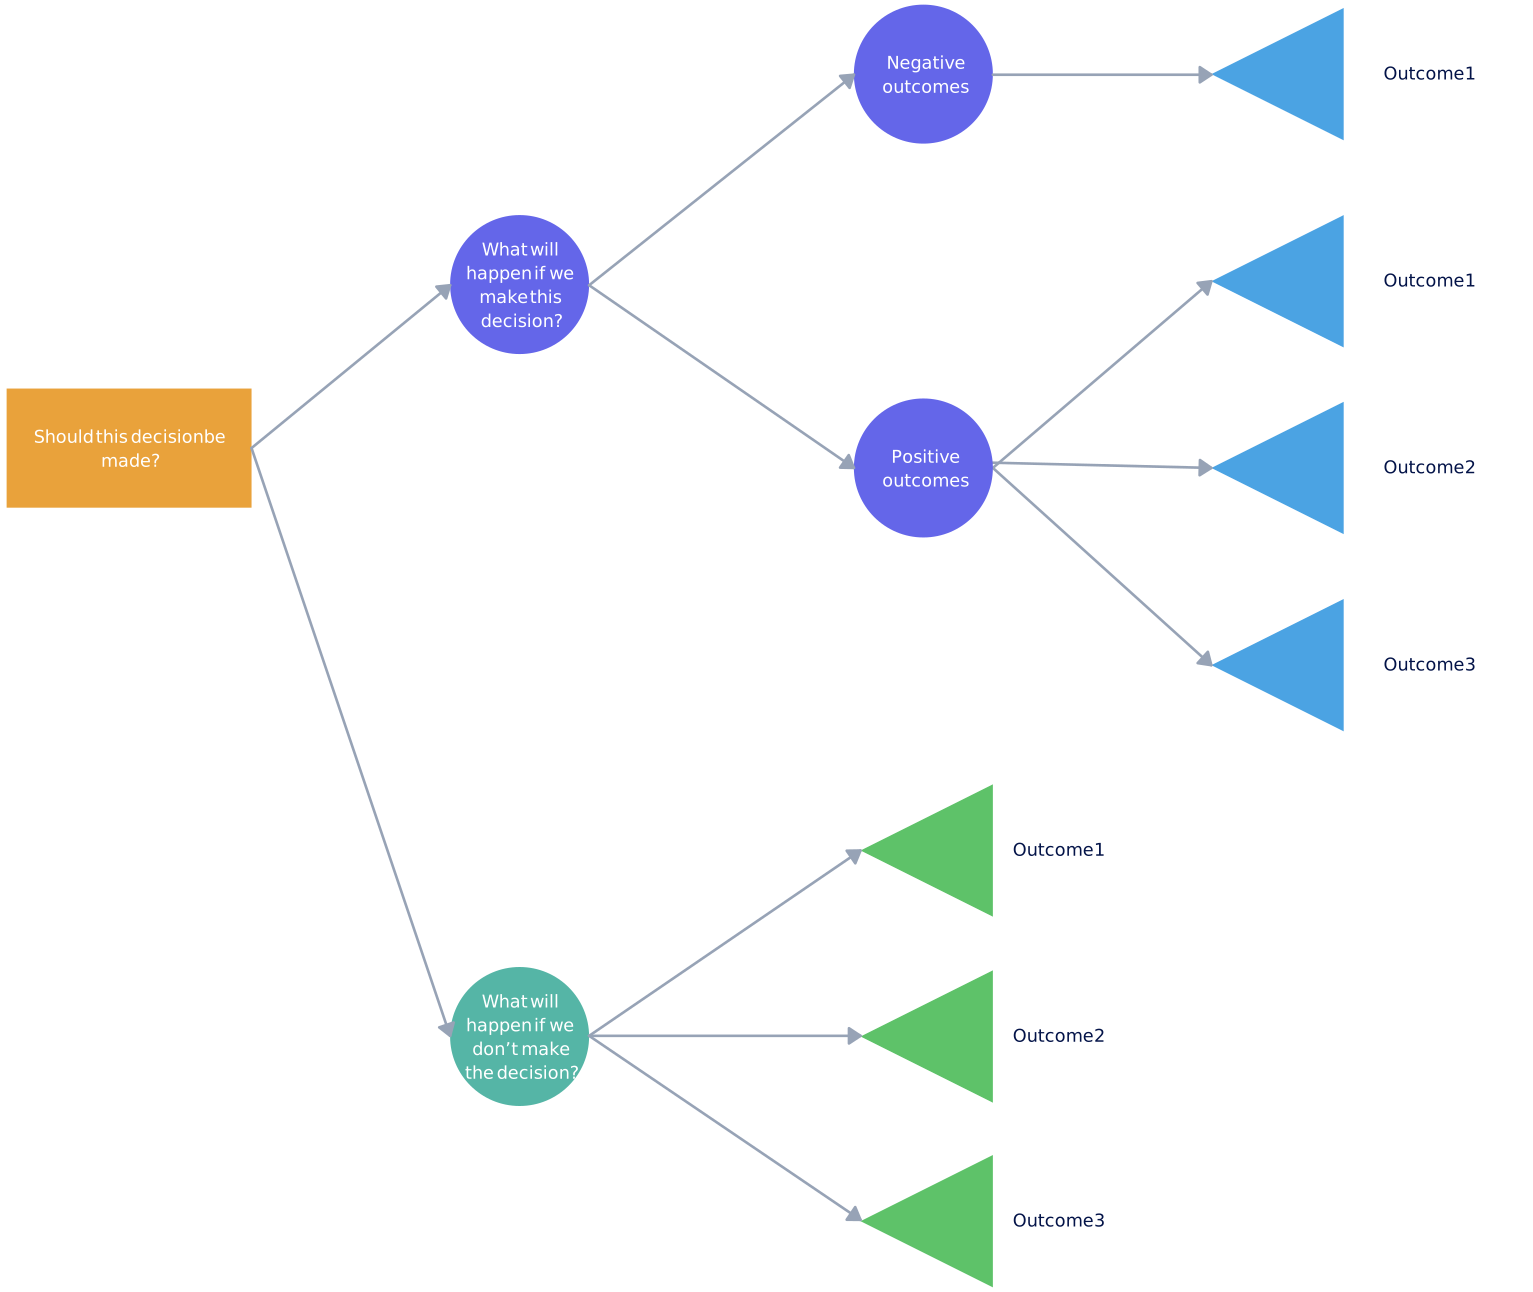
Simple Decision Tree
Use this simple template to map a choice from start to finish. For a service launch, put Launch now or run a pilot? at the root. The launch now branch ends at a launch outcome. The run a pilot branch leads to a test result: if demand meets the agreed threshold, proceed to launch; if it does not, revise the service or stop. Each path should end with a named outcome, not a dangling branch.
Advantages and Disadvantages of a Decision Tree
The table below focuses on machine-learning decision trees. For a hand-built decision tree, the main benefit is a visible path from choice to outcome; the main limitation is that omitted options or unsupported assumptions can make that path misleading.
| Advantages | Disadvantages |
| Easy to interpret and visualize. | Can overfit complex datasets without proper pruning. |
| Can handle both numerical and categorical data without requiring data normalization. | Small changes in data can lead to different tree structures. |
| Captures non-linear relationships between features and target variables effectively. | Tends to favor dominant classes in imbalanced datasets. |
| Automatically selects significant variables and feature interactions. | May struggle with complex interdependencies between variables. |
| Applicable to both classification and regression tasks across various domains. | Can become memory-intensive with large datasets. |
Using Decision Trees in Data Mining and Machine Learning
In data mining and machine learning, an algorithm learns branch conditions from training data to classify a case or predict a numeric value. This differs from a hand-built decision tree, where people map actions, uncertain events, costs, and desired outcomes before choosing a path.
The process begins with defining the decision problem and collecting relevant data. Algorithms like ID3 or C4.5 are then used to build the tree, selecting attributes that best split the dataset to maximize information gain. Once constructed, the tree is analyzed to understand relationships between variables and visualize decision paths.
Decision tree analysis is commonly used in;
Business decision making:
- Strategic planning: Evaluating different strategic options and outcomes.
- Operational efficiency: Optimizing workflows and processes.
Healthcare:
- Medical diagnosis: Assisting in diagnosing diseases.
- Treatment plans: Determining the best treatment options.
Finance:
- Credit scoring: Evaluating creditworthiness of loan applicants.
- Investment decisions: Assessing risks and returns of investments.
Marketing:
- Customer segmentation: Identifying customer groups for targeted marketing.
- Campaign effectiveness: Predicting success of marketing campaigns.
Environmental science:
- Environmental planning: Analyzing impacts of environmental policies.
- Conservation efforts: Identifying critical areas for conservation.
Risk assessment:
- Project risk analysis: Evaluating project risks and their impacts.
- Operational risk management: Identifying and mitigating operational risks.
Diagnostic reasoning:
- Fault diagnosis: Detecting faults in industrial processes.
- System troubleshooting: Guiding troubleshooting in technical systems.
While decision tree analysis offers clarity and flexibility, it can become too specific if not pruned properly and is influenced by variations in input data. Overall, decision tree analysis is valuable for pulling out useful insights from complicated datasets to help with decision-making.
Wrapping up
A decision tree is an invaluable tool for simplifying decision-making processes by visually mapping out choices and potential outcomes in a structured manner. Despite their straightforward approach, decision trees offer robust support for strategic planning across various domains, including project management. While they excel in clarifying decisions and handling different data types effectively, challenges like overfitting and managing complex datasets should be considered. Nevertheless, mastering decision tree analysis empowers organizations to make well-informed decisions by systematically evaluating options and optimizing outcomes based on defined criteria.