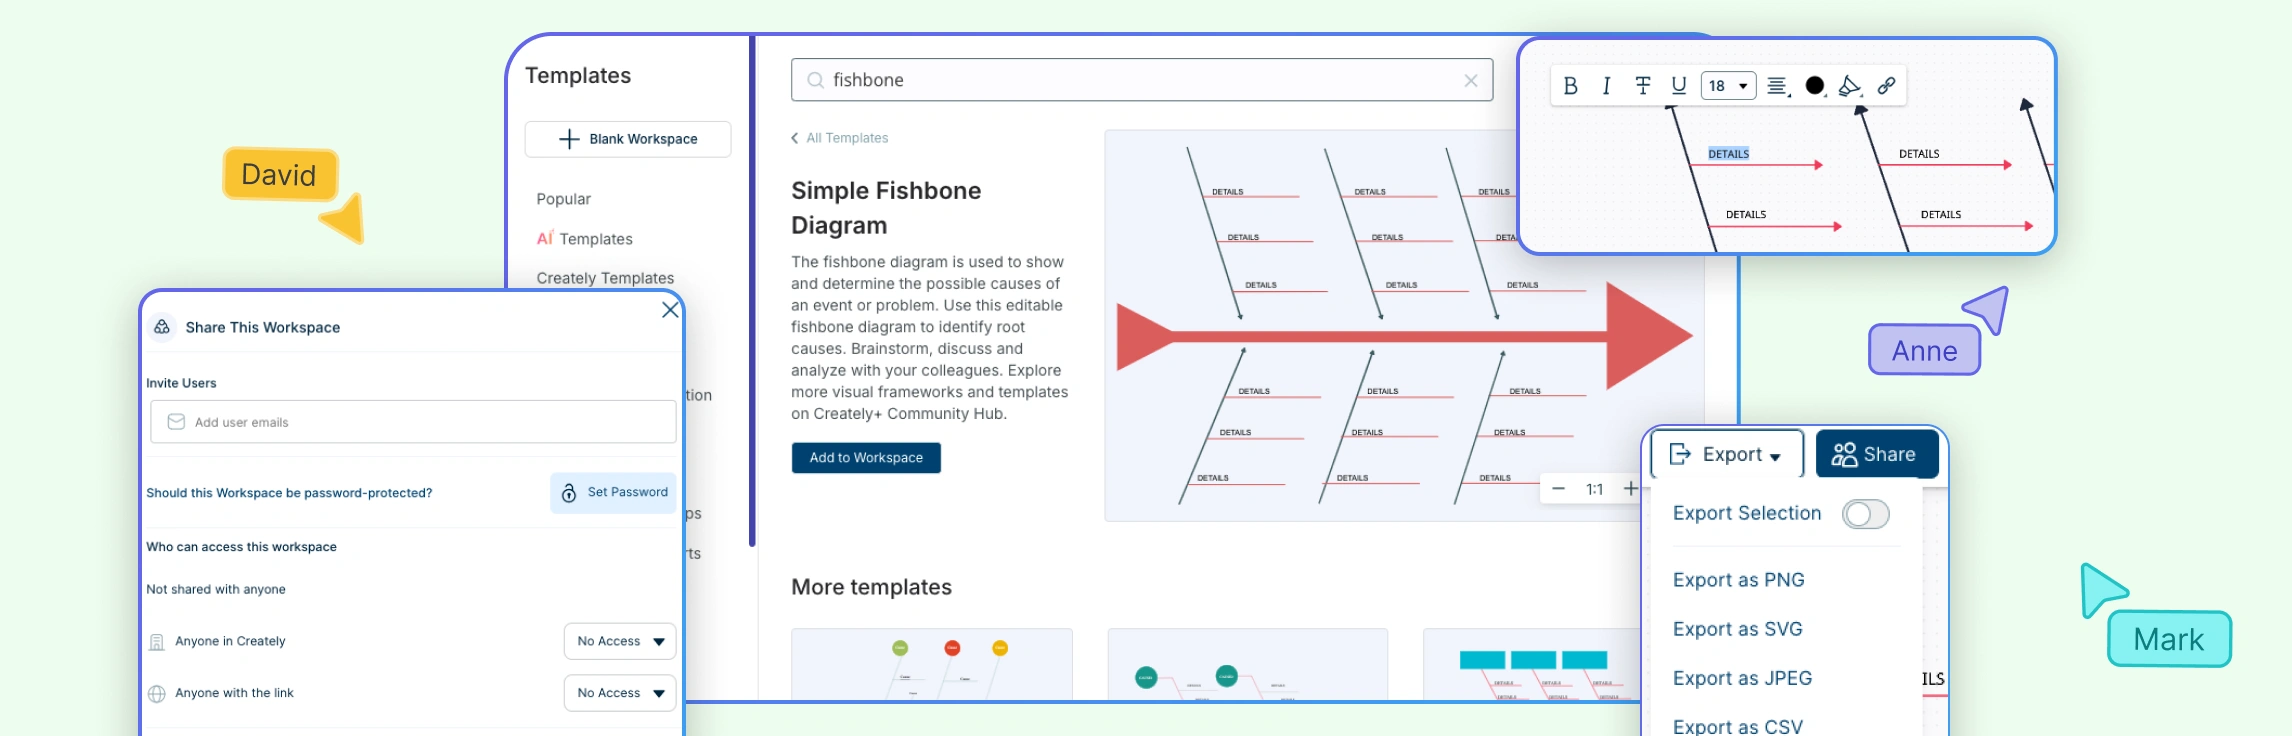
When a problem has many possible causes, a fishbone diagram helps teams organize them clearly and work toward the real root cause. Also known as an Ishikawa diagram or cause-and-effect diagram, it breaks a problem into major cause categories so teams can see patterns, compare contributing factors, and decide where to investigate first.
There are several types of fishbone diagrams, and each one works best for a different kind of problem. A 6M fishbone diagram is commonly used for manufacturing and quality issues, while 8P and 4S fishbone diagrams are better suited for service, marketing, and business process problems.
In this guide, we’ll walk through the main types of fishbone diagram, including simple, 6M, 8P, and 4S variations, with examples and guidance on how to choose the right one for your root cause analysis.
What Is a Fishbone Diagram
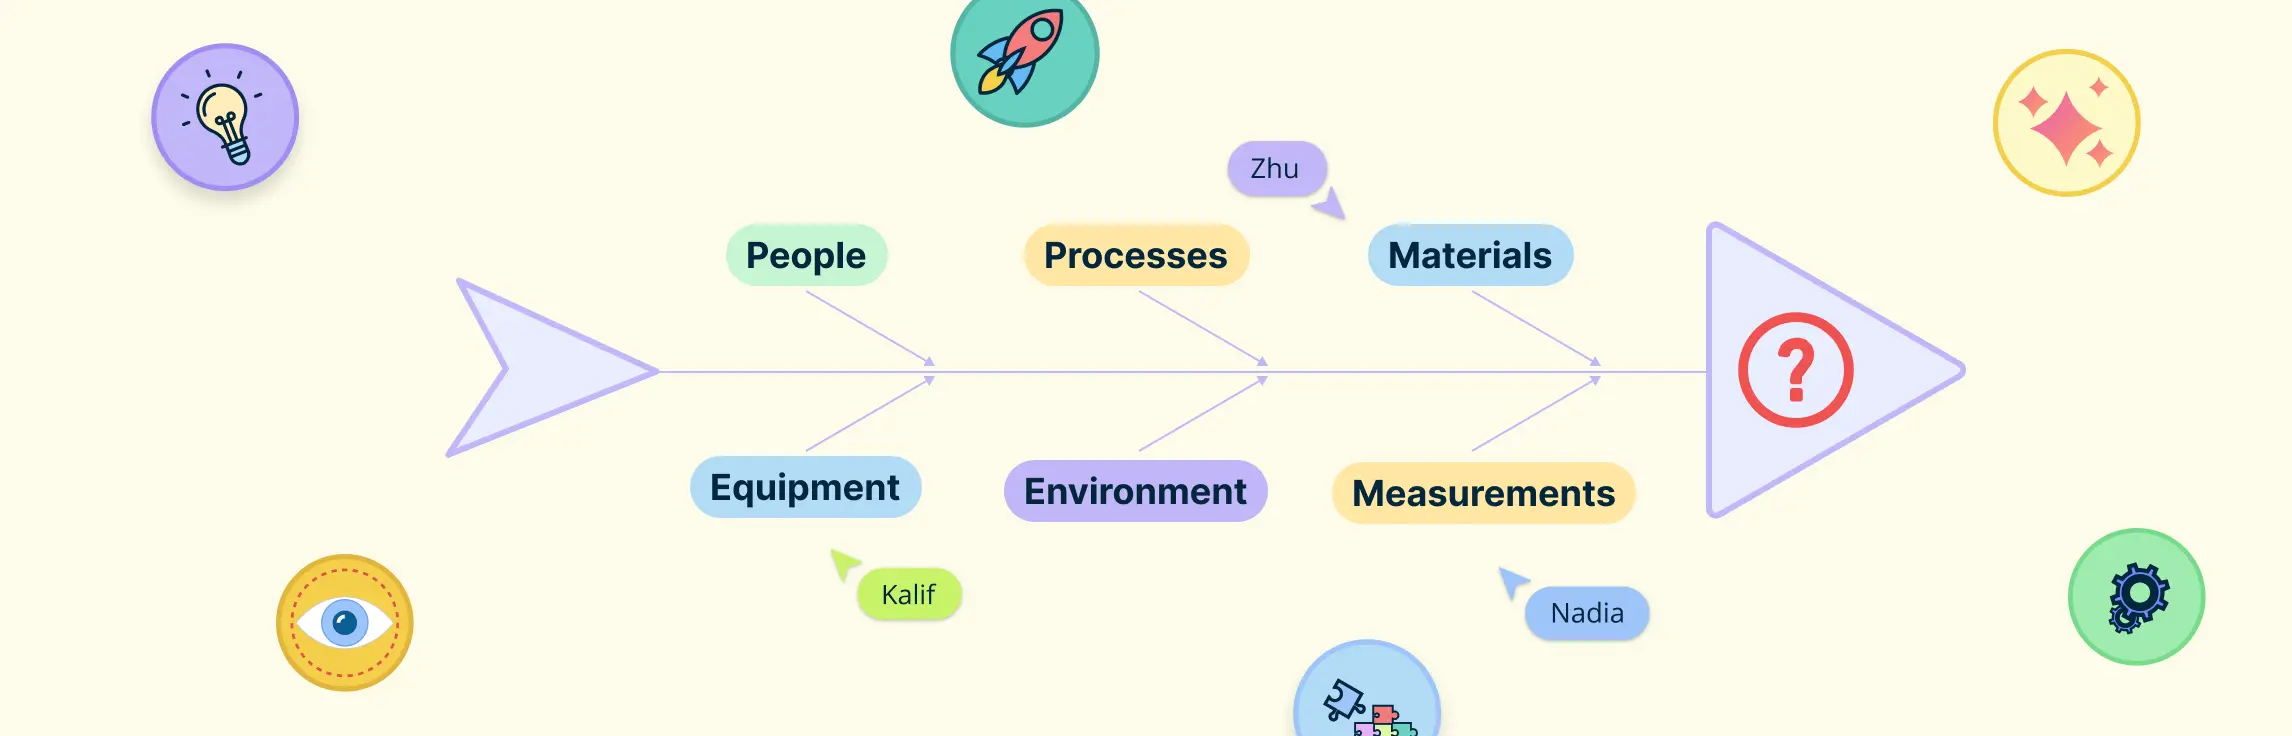
A Fishbone Diagram, also known as an Ishikawa or Cause-and-Effect Diagram, helps identify the root cause of a problem. Shaped like a fish skeleton, the “head” represents the problem, while the “bones” show possible causes.
It organizes factors into categories, making it easier to spot patterns and find real issues. Used in business, healthcare, and education, Fishbone Diagrams help teams focus on solutions rather than just symptoms.


Types of Fishbone Diagrams: 6M, 8P, 4S, and Other Examples
Fishbone diagrams come in different types, each designed for specific problems and industries. Choosing the right one helps you get to the root cause faster and more effectively. Here are some of the most common types of fishbone diagrams and when to use them:
| Fishbone Diagram Type | Best For | Common Categories |
| Simple Fishbone Diagram | General root cause analysis | Flexible categories |
| 6M Fishbone Diagram | Manufacturing and quality | Manpower, Method, Machine, Material, Measurement, Mother Nature |
| 8P Fishbone Diagram | Marketing and service | Product, Price, Place, Promotion, People, Process, Physical Evidence, Performance |
| 4S Fishbone Diagram | Service operations | Surroundings, Suppliers, Systems, Skills |
| Process Fishbone Diagram | Workflow issues | Causes organized by process stages |
Type 1: The Simple Fishbone Diagram
The standard fishbone diagram is the most basic and widely used version of this problem-solving tool. It helps teams break down a problem into clear categories, making it easier for the root cause analysis. Since it’s simple and flexible, businesses, healthcare professionals, educators, and engineers all use it to tackle issues in their fields.

Best used for
- Early-stage problem exploration
- General brainstorming
- Team root cause workshops
- Problems that do not fit standard frameworks
How it works
The diagram is shaped like a fish skeleton:
- The head represents the main problem or effect you’re trying to analyze.
- The bones branching out from the spine represent different categories of possible causes.
- Each category can be further broken down into more specific causes until patterns start to emerge.
Common cause categories
The standard fishbone diagram doesn’t have fixed categories, but common ones include:
- People – Are there human errors, skill gaps, or miscommunications?
- Processes – Are workflows inefficient or outdated?
- Materials – Are the resources or supplies faulty or low quality?
- Equipment – Are tools, machines, or software causing the issue?
- Environment – Are external factors like weather, regulations, or culture playing a role?
Type 2: The 4S Fishbone Diagram
The 4S Fishbone Diagram is a streamlined version of the traditional fishbone diagram, mainly used in service industries, business operations, and process improvement. It focuses on four key categories that commonly impact performance: Surroundings, Suppliers, Systems, and Skills.
Best for
- Service delivery issues
- Healthcare processes
- Hospitality operations
- Customer support challenges

Breaking down the 4S categories
Each “S” represents a critical area that can contribute to a problem. By analyzing these categories, teams can uncover root causes and develop effective solutions.
1. Surroundings
This is the environment where the service happens, like the store’s cleanliness, layout, or atmosphere. Problems here might be things like poor lighting or uncomfortable seating.
- Is the workplace safe and organized?
- Are environmental factors (lighting, noise, temperature) affecting performance?
- Are external influences like competition or regulations causing problems?
2. Suppliers
Supplies are the materials or tools needed to provide the service. If there are shortages, damaged items, or broken equipment, it can disrupt the service.
- Are vendors providing reliable services or products?
- Are delays or inconsistencies from suppliers causing issues?
- Are supplier contracts and expectations clearly defined?
3. Systems
Systems are the processes used to deliver the service. If these processes are slow or disorganized, it can lead to delays or mistakes.
- Are internal processes efficient and well-documented?
- Are there bottlenecks in workflow?
- Are outdated systems or software slowing things down?
4. Skills
Skills refer to how well the staff is trained or their abilities. If employees don’t have the right skills, it can affect the quality of the service.
- Do employees have the necessary skills for their tasks?
- Is training adequate and up to date?
- Are communication or teamwork issues affecting performance?
Type 3: The 8P Fishbone Diagram
The 8P fishbone diagram, also known as the marketing fishbone diagram, is widely used in service industries, business operations, and process improvement. It builds upon the traditional fishbone diagram by categorizing potential causes into eight key areas: product, price, place, promotion, people, process, physical evidence, and performance.
This structured approach makes it especially useful in marketing, retail, and customer service, where multiple factors influence business success. By analyzing these categories, organizations can pinpoint challenges related to branding, customer experience, and operational efficiency, leading to more effective problem-solving and strategy development.

Best for
- Customer experience issues
- Marketing performance problems
- Service quality analysis
- Business process improvement
Breaking Down the 8P Categories
Each “P” represents a key area that could be contributing to a problem. By analyzing these categories, businesses can pinpoint root causes and improve their strategies.
1. Product
Product is what the business offers, such as goods or services. It’s important that the product is high quality and meets customer needs. Problems can arise if the product doesn’t live up to expectations.
- Is the product meeting customer needs?
- Are there quality or design issues?
- Is there enough variety or customization?
2. Price
Price is what customers pay for the product or service. The price should reflect the value of the product while being competitive. If the price is too high or low, it can impact sales and customer satisfaction.
- Is the pricing competitive?
- Are customers finding it too expensive or too cheap?
- Are there hidden costs or unclear pricing structures?
3. Place
Place is how the product gets to customers. This includes both physical locations and online channels. The product must be easy to access, and distribution issues can cause delays or lost sales.
- Are products/services easy to find and purchase?
- Are there supply chain issues causing delays?
- Is the location or online presence effective?
4. Promotion
Promotion involves how the business markets and advertises its products. This can include ads, promotions, and public relations. If promotional efforts aren’t reaching the right audience, the business may not attract enough customers.
- Is the marketing strategy effective?
- Is the message clear and reaching the right audience?
- Are there issues with ad placement or branding?
5. People
People refer to the staff and customers. It includes customer service, training, and engagement. If employees aren’t well-trained or customer service isn’t up to par, customers may not be happy.
- Are employees well-trained and engaged?
- Is customer service efficient?
- Are there staffing shortages affecting service?
6. Process
Process is about how the business operates and delivers its products or services. If processes are slow or inefficient, it can lead to delays and a poor customer experience.
- Are workflows smooth and efficient?
- Are there bottlenecks slowing down service?
- Is there a lack of standardization?
7. Physical evidence
Physical evidence includes the things customers see and interact with, such as store design, packaging, and online presence. Everything should reflect the brand’s image and create a positive experience.
- Does the business create a strong brand image?
- Is the store, website, or packaging appealing and professional?
- Are customer reviews and testimonials positive?
8. Performance
Performance is about tracking the business’s results, like sales or customer satisfaction. By measuring performance, businesses can see if they are meeting their goals and find areas that need improvement.
- Are key business goals being met?
- Is revenue or customer satisfaction declining?
- Are there recurring quality or service issues?
Note: Some variations of the 8P Fishbone Diagram include an additional factor like Policies, which focuses on the internal rules and guidelines governing a business’s operations. This category could cover issues related to how company policies affect service delivery, customer satisfaction, or employee performance.
Type 4: 6M Fishbone Diagram
The 6M Fishbone Diagram is one of the most widely used types of fishbone diagrams, especially in manufacturing, production, and quality control. It helps teams identify the root causes of problems by organizing them into six key categories: Manpower, Method, Machine, Material, Measurement, and Mother Nature (Environment).

Best for
- Defect analysis
- Quality issues
- Production bottlenecks
- Lean and Six Sigma analysis
- Process variation investigations
When to use it: This structured approach makes it easier to analyze issues, spot patterns, and find solutions, rather than relying on guesswork. It’s particularly useful for companies that want to improve efficiency, reduce defects, and maintain high-quality standards.
Breaking down the 6M categories
Each “M” represents a different area where problems can arise. By investigating each category, teams can uncover hidden causes and address them effectively.
1. Manpower
This refers to the people involved in the process. It includes their skills, training, and performance. Problems here could include workers being under-trained, lacking experience, or not following procedures properly.
- Are employees properly trained?
- Is there a communication gap between teams?
- Are workers following the correct procedures?
- Is there a staffing shortage affecting productivity?
2. Method
This focuses on the processes or procedures used to do the work. Problems might arise if the method is inefficient, outdated, or not followed consistently, leading to mistakes or delays.
- Are procedures outdated or inefficient?
- Are steps being skipped in the workflow?
- Are there unnecessary delays in the process?
- Is there a lack of standardization in how tasks are done?
3. Machine
This category is about the equipment, tools, and machines used in production. Issues can occur if the machines are broken, outdated, poorly maintained, or not suitable for the task at hand.
- Are machines or tools breaking down frequently?
- Is the equipment outdated or in need of maintenance?
- Are there calibration issues affecting precision?
- Are the wrong tools being used for the job?
4. Material
This involves the raw materials or components used in production. Problems can happen if the materials are of poor quality, damaged, or not available in the right quantities, which can affect the final product.
- Are materials of poor quality or defective?
- Are there supply chain delays affecting production?
- Are the right materials being used for the job?
- Are there inconsistencies in material quality?
5. Measurement
This refers to the data or measurements used in the process, such as quality checks or production counts. Issues can arise if the measurements are inaccurate, inconsistent, or not properly recorded.
- Is the data being recorded accurately?
- Are measurement tools properly calibrated?
- Are quality control standards being followed?
- Are incorrect assumptions affecting decisions?
6. Mother nature
This category looks at external factors that could affect the process, such as weather, temperature, or the location of the production facility. Environmental conditions can impact product quality or the efficiency of the process.
- Is weather affecting production or deliveries?
- Are temperature or humidity levels impacting materials?
- Are workplace conditions affecting employee performance?
- Are external regulations causing delays?
Other Fishbone Diagram Types and Variations
Not every problem fits neatly into the 6M, 8P, or 4S models. Many teams adapt fishbone diagrams by changing the cause categories to match their industry, process, or problem type. Here are a few common variations.
5M+E Fishbone Diagram
The 5M+E fishbone diagram is a variation of the 6M model where Environment is separated from the other “M” categories. This makes it useful when external conditions, workplace setup, safety requirements, or regulatory factors have a strong impact on the problem.
It is commonly used in lean manufacturing, quality audits, compliance reviews, and process improvement projects.
Common categories include:
- Manpower
- Method
- Machine
- Material
- Measurement
- Environment

Process Fishbone Diagram
A process fishbone diagram organizes causes around the stages of a workflow instead of using fixed cause categories. This works well when the problem is linked to delays, handoffs, approvals, rework, or unclear responsibilities across a process.
For example, a team investigating delayed order fulfillment might use stages such as order received, inventory check, packing, shipping, and delivery as the main branches.
This type is useful for:
- Workflow bottlenecks
- Process handoff failures
- Service delays
- Rework or quality issues across process stages

Service Industry Fishbone Diagram
A service industry fishbone diagram uses categories that reflect how services are delivered and experienced by customers. Instead of focusing on machines or materials, it looks at people, systems, policies, communication, and customer-facing interactions.
For example, a customer support team may use this type to investigate low satisfaction scores by analyzing staffing, response process, training, tools, and customer expectations.
Common categories may include:
- Staff
- Systems
- Policies
- Communication
- Customer expectations
- Service environment

Healthcare Fishbone Diagram
A healthcare fishbone diagram is used to analyze problems related to patient care, safety, delays, compliance, or operational quality. It helps clinical and administrative teams examine contributing factors without focusing on one cause too early.
For example, a hospital may use a healthcare fishbone diagram to investigate long patient wait times, medication errors, missed follow-ups, or gaps in discharge planning.
Common categories may include:
- People
- Procedures
- Equipment
- Policy
- Environment
- Communication

How to Choose the Right Type of Fishbone Diagram
Choosing the right type of fishbone diagram depends on the kind of problem you’re analyzing, the causes you need to explore, and how much structure your team needs. While some fishbone diagrams are built for specialized use cases, others are flexible enough for general problem solving.
A good starting point is to match the diagram to the nature of the issue.
| If Your Problem Involves | Use This Fishbone Diagram | Why It Fits |
| Manufacturing defects, production issues, or process variation | 6M Fishbone | Covers operational causes across manpower, method, machine, material, measurement, and environment. |
| External conditions or compliance-related production issues | 5M+E Fishbone | Separates environment as its own category, making workplace, safety, and regulatory factors easier to analyze. |
| Service delivery failures or customer support issues | 4S Fishbone | Focuses on service-related causes such as surroundings, suppliers, systems, and skills. |
| Marketing, customer experience, or business performance issues | 8P Fishbone | Looks at product, price, place, promotion, people, process, physical evidence, and performance. |
| Workflow bottlenecks, delays, handoff issues, or rework | Process Fishbone | Organizes causes by workflow stage instead of fixed categories. |
| Healthcare, patient safety, or clinical process issues | Healthcare Fishbone | Uses healthcare-specific categories such as people, procedures, equipment, policy, environment, and communication. |
| General brainstorming or early problem exploration | Simple Fishbone | Keeps categories flexible when the root causes are unclear or do not fit a standard model. |
The best fishbone diagram is not always the most detailed one. Choose the type that matches the problem, the industry, and the level of structure your team needs. Use structured models like 6M, 8P, or 4S when you want a proven framework, and use a simple or custom fishbone diagram when the problem needs more flexibility.
References
ResearchGate. (n.d.). (PDF) Application Of Fishbone Diagram To Determine The Risk Of An Event With Multiple Causes. [online] Available at: https://www.researchgate.net/publication/46567642_Application_Of_Fishbone_Diagram_To_Determine_The_Risk_Of_An_Event_With_Multiple_Causes.
Sakdiyah, S.H., Eltivia, N. and Afandi, A. (2022). Root Cause Analysis Using Fishbone Diagram: Company Management Decision Making. Journal of Applied Business, Taxation and Economics Research, 1(6), pp.566–576. doi:https://doi.org/10.54408/jabter.v1i6.103.
Kumah, A., Nwogu, C.N., Issah, A.-R., Obot, E., Kanamitie, D.T., Sifa, J.S. and Aidoo, L.A. (2024). Cause-and-Effect (Fishbone) Diagram: a Tool for Generating and Organizing Quality Improvement Ideas. Innovations Journals, [online] 7(2). doi:https://doi.org/10.36401/jqsh-23-42.
FAQs about the Types of Fishbone Diagrams
What is the purpose of a Fishbone Diagram?
What are the common types of Fishbone Diagrams?
How do I know which Fishbone Diagram to use?
Can a Fishbone Diagram be used for quality improvement?
What are the key categories in the 6M Fishbone Diagram?
Is the 8P Fishbone Diagram useful for businesses outside of marketing?
How do you use a fishbone diagram for root cause analysis?