A deployment diagram is a UML diagram that shows how software components are deployed across hardware nodes, servers, devices, or cloud environments. It bridges the gap between design and implementation by visualizing where each part runs and how elements communicate. Used across industries from web and mobile apps to IoT, cloud, and enterprise systems, it helps teams plan, document, and optimize architecture for scalability, reliability, and efficiency.
What is a Deployment Diagram A UML Deployment Diagram is a structural diagram that shows how software components are deployed across hardware or network environments. It maps hardware nodes (servers, devices) to software artifacts (applications, databases) to visualize where each part runs and how they interact. In short, it illustrates a system’s runtime architecture, helping teams understand and document how software operates within its infrastructure.
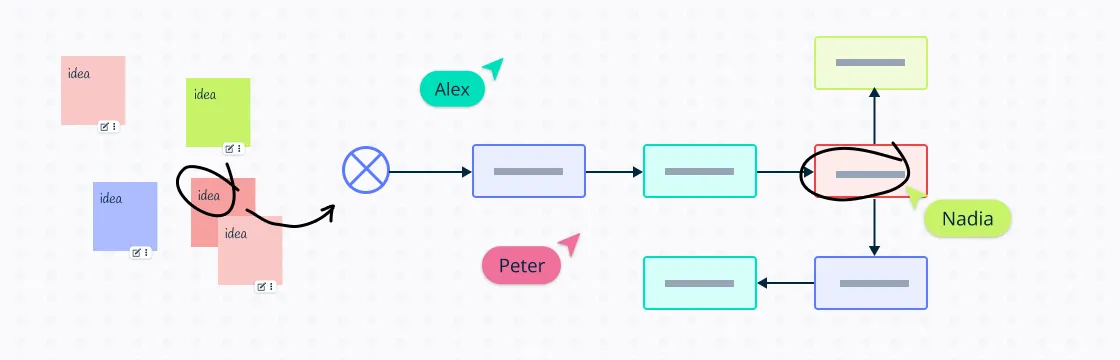
Understanding how systems work is essential to making informed decisions, solving problems effectively, and finding ways to innovate. Using a visual tool like block diagrams helps us organize thoughts and gives us a broader view of complicated systems. At its core, a block diagram is a streamlined graphical representation of a system, illustrating the relationships between different components or processes. It’s a form of visualization that uses blocks to represent the parts and arrows to indicate the flow of information or process. This simplicity is what makes a block diagram an invaluable tool for product managers and engineers alike, as it helps to demystify complex systems.