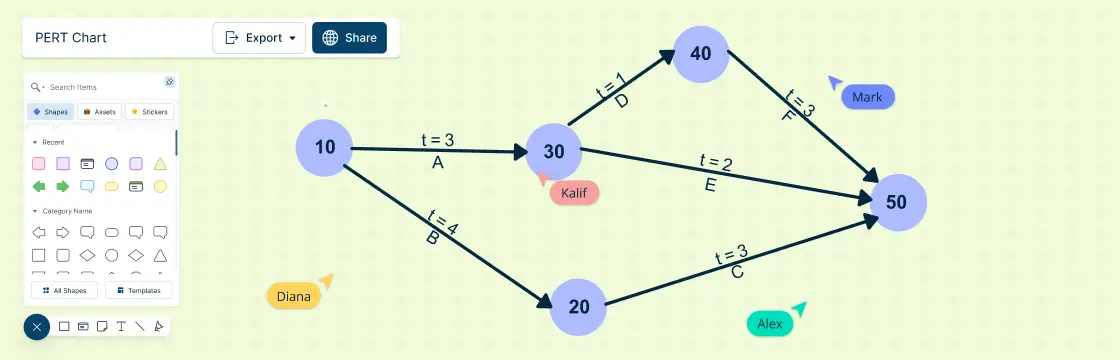
A PERT chart is a graphical tool that helps you visualize the tasks, dependencies, and milestones of your project. In this blog post, we’ll explain what a PERT chart is, how it originated, what it can be used for.
A PERT chart is a graphical tool that helps you visualize the tasks, dependencies, and milestones of your project. In this blog post, we’ll explain what a PERT chart is, how it originated, what it can be used for.