
A calendar shows what you intended to do. A time audit shows what actually happened. If your day fills with meetings, messages, and unexpected requests, that difference can explain why important work keeps moving to tomorrow.
A calendar shows what you intended to do. A time audit shows what actually happened. If your day fills with meetings, messages, and unexpected requests, that difference can explain why important work keeps moving to tomorrow.
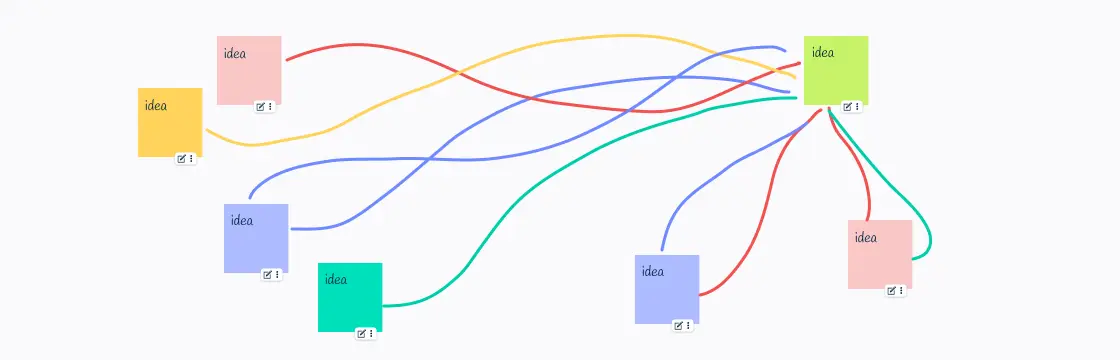
What is a Spaghetti Diagram? A spaghetti diagram is a visual representation of physical movement through a workspace, tracing the paths taken by people, materials, products, or equipment. By recording actual routes and distances, it helps teams identify repeated travel, backtracking, congestion, and other forms of motion or transportation waste. Teams can then use that evidence to evaluate changes to a layout or workflow.
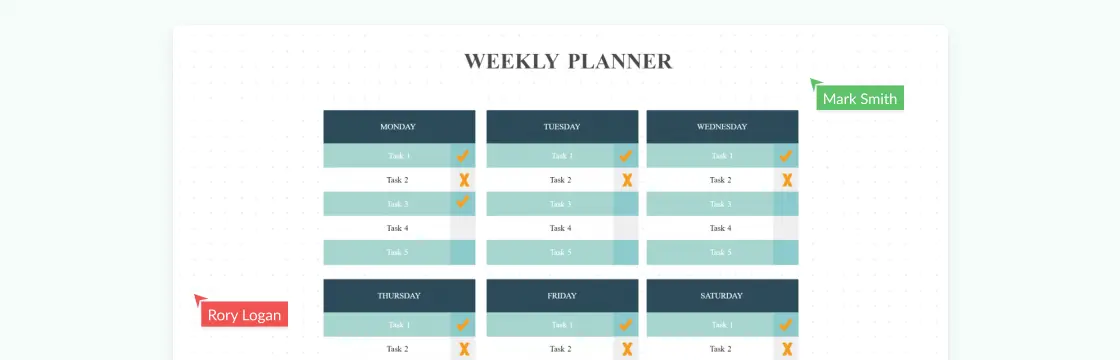
One of the simplest joys in life is to cross off a completed item from your to-do list as it gives you an amazing sense of accomplishment. In this post, we are going to talk about creative to-do list ideas and ways in which you can visualize them to keep a track of your day-to-day tasks.