Managing distributed teams means coordinating people across regions, time zones, reporting lines, and functions without losing visibility into who owns what. Organizational charts help by turning a complex multi-location structure into something teams can actually understand and use.
What Is a Distributed Team?
A distributed team is a team made up of people working across different cities, regions, countries, or time zones instead of from one shared office. These teams often include a mix of local teams, regional leadership, global functions, and shared services working together across locations.
Unlike a typical remote setup, distributed teams usually involve more complex structures. People may report locally while also working across regions, departments, or cross-functional teams. That makes visibility much more important, because employees need to understand not just who they report to, but how the wider organization connects across locations.
Why Org Charts Matter for Distributed Teams
When teams are distributed, structure is harder to pick up naturally. People cannot simply look around the office to understand who leads what, how departments connect, or where to go for support. Organizational charts help solve that by making team structure visible. They give managers and employees a clearer view of reporting lines, functional ownership, cross-team relationships, and how the wider organization fits together.
What to Include in a Distributed Team Org Chart
A distributed team org chart should usually include:
- names and job titles
- reporting lines and regional leadership
- function, department, or business unit
- region, office, or country
- time zone or working-hour overlap
- matrix or dotted-line relationships
- shared services or cross-regional support teams
- work arrangement only where relevant
The goal is not to overload the chart with detail. It is to include the information that helps distributed teams work with more clarity.
How Org Charts Help Distributed Teams
| How org charts help | Why it matters |
| They make multi-location teams easier to understand | Distributed teams work across regions, offices, or countries, which can make structure harder to follow. Org charts help by showing how teams are organized across locations so employees can better understand how the wider organization fits together. |
| They improve visibility across functions and regions | Employees in distributed teams often work with people outside their immediate location or department. Org charts make these connections more visible, helping teams see how functions, regions, and leadership lines connect across the business. |
| They help people find the right teams faster | When employees can quickly see who leads a team, which group owns a function, or where regional support sits, communication becomes easier. Org charts reduce guesswork and help people reach the right contacts faster. |
| They support coordination across locations and time zones | Distributed teams often need to collaborate across working hours and regions. Org charts help by showing where people and teams are based, giving managers and employees better context for planning communication and collaboration. |
Steps to Managing Distributed Teams Using Org Charts
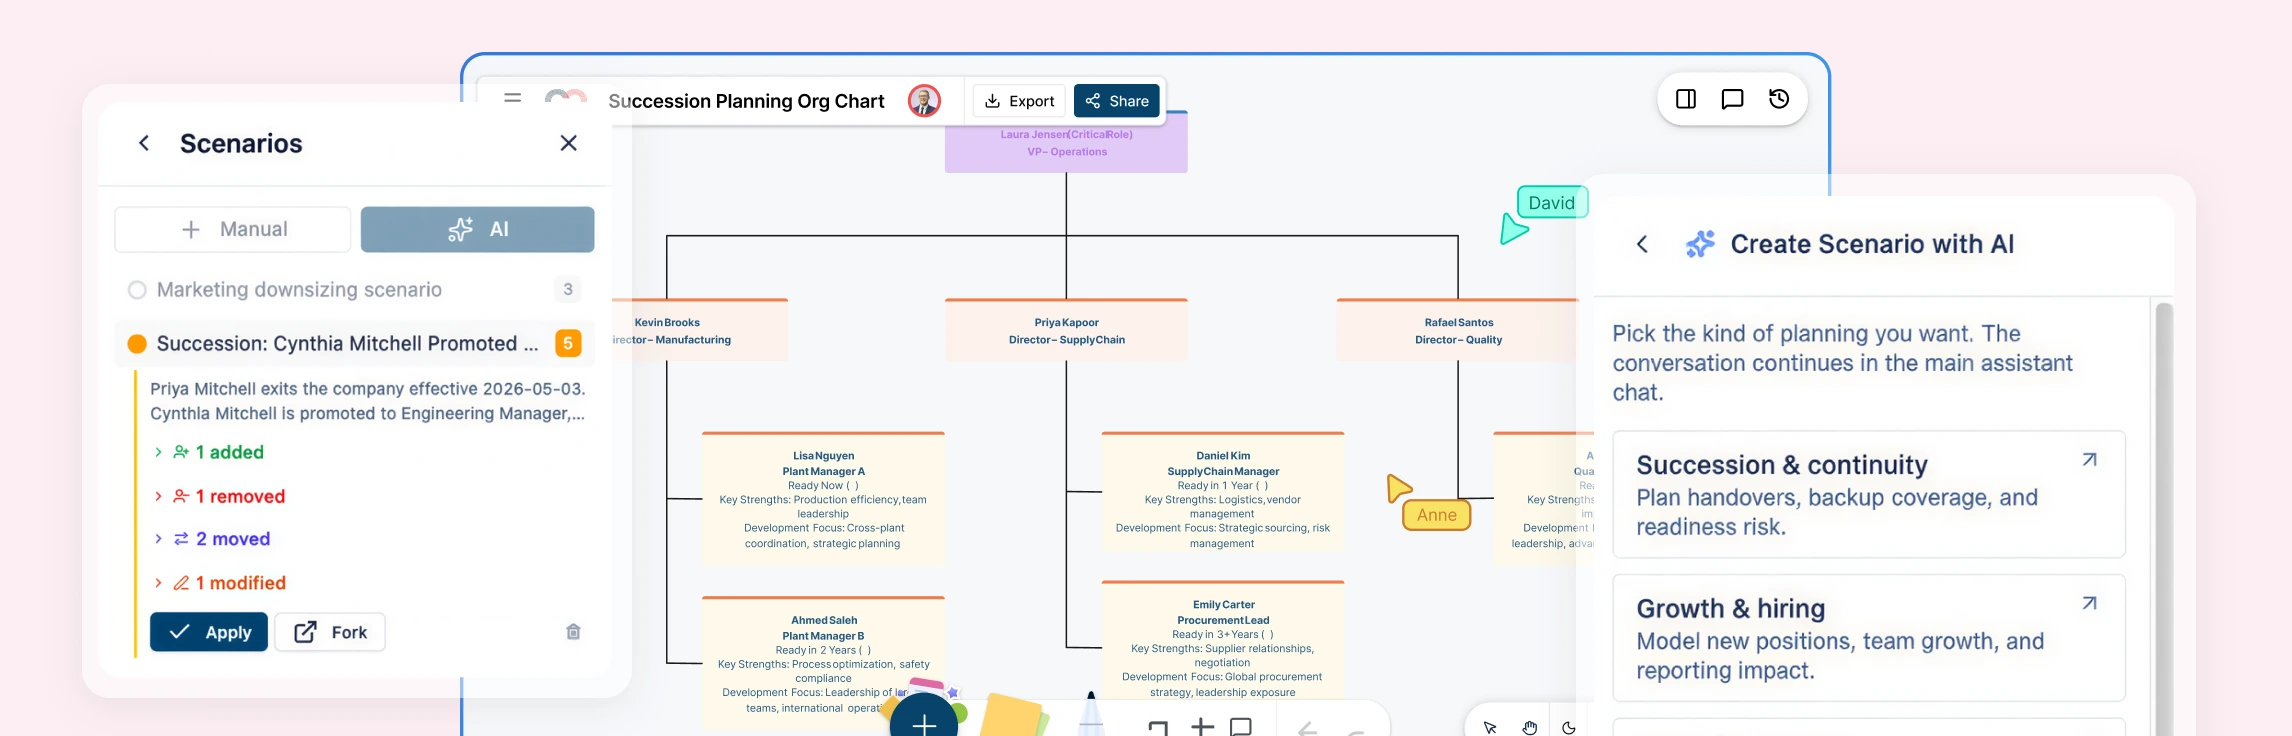
Managing distributed teams is not just about showing who reports to whom. Teams also need visibility across regions, time zones, functions, and leadership layers. Using org charts in Creately helps make that structure easier to map, understand, and keep aligned as the organization grows.
Step 1: Map the overall organization across regions
Start by laying out the broader organizational structure across the business. Instead of focusing only on one team or department, begin with the company-wide hierarchy so employees can see how leadership, functions, and regional teams fit together.
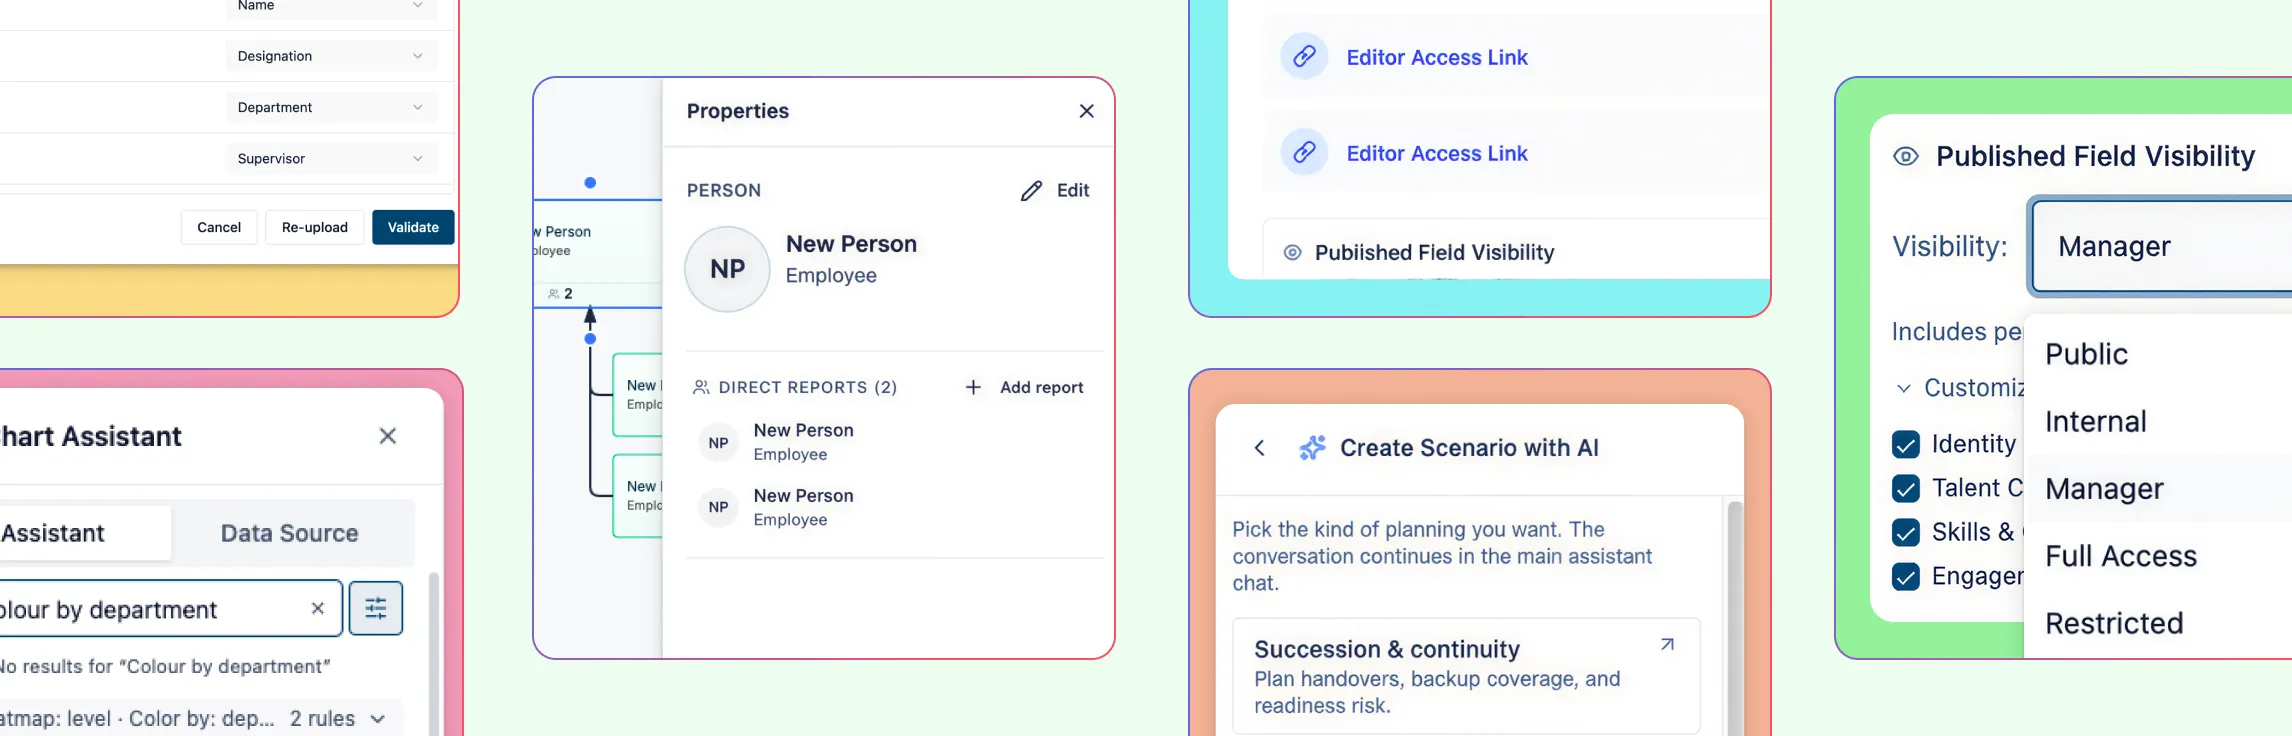
In Creately, you can build this structure by importing employee data from a spreadsheet or creating the chart manually. If you already have team data in a CSV file, the import wizard helps speed things up by recognizing common columns such as name, title, manager, department, employee ID, and hire date.
- import employee and reporting data from a spreadsheet
- auto-map common fields such as name, title, manager, and department
- review validation warnings for missing IDs, unknown managers, reporting cycles, or empty rows
- generate the org chart automatically with auto-layout
- undo the full import in one step if you need to fix the source file and try again
This gives you a clear starting point and makes it easier to see how the organization is structured across locations.
Step 2: Define regional ownership and local leadership
Once the overall structure is in place, make it clearer who leads each region, office, market, or geography. Distributed teams often have multiple layers of responsibility, with local leaders managing execution while regional or global leaders oversee broader functions.
Use the org chart to show these responsibilities clearly so employees can understand who owns what at both the local and broader organizational level.
- identify regional leaders, country heads, or office leads
- show how local leadership connects to broader functional or executive leadership
- include region, office, or country details where relevant
- make it easier for employees to see who leads each location or market
This helps reduce confusion in distributed organizations where leadership is spread across multiple places.
Step 3: Connect functions that operate across locations
Distributed teams rarely operate as isolated location-based groups. Functions such as HR, support, finance, operations, product, and sales often work across multiple regions at once. That makes it important to show not just where teams sit, but how functions connect across locations.
In Creately, you can use fields such as department, division, business unit, and region to make these cross-location structures easier to understand.
- show which functions operate across multiple regions
- connect shared services to the teams or locations they support
- use department and business unit details to show how teams fit into the wider organization
- add custom fields if needed for details such as time zone, language, or market coverage
This gives employees a better understanding of how support and ownership work across the organization.
Step 4: Model matrix and dotted-line relationships
Distributed teams often work in structures that go beyond a simple hierarchy. Employees may report to one manager locally, collaborate with another team regionally, and contribute to cross-functional work globally. That is why it is useful to show more than direct reporting lines.
In Creately, you can represent both formal hierarchy and the dotted-line or matrix relationships that shape how work actually happens.
- use solid lines for direct reporting relationships
- add dotted-line relationships for secondary or functional reporting
- show matrix structures where employees work across teams, regions, or business units
- reflect cross-functional collaboration that does not fit neatly into the hierarchy
This makes the org chart more realistic and more useful for distributed organizations with layered structures.
Step 5: Make regional views easier to navigate
As distributed organizations grow, employees need a practical way to move through the structure without getting lost in the full chart. A useful org chart should help people quickly find the right region, team, leader, or function.
Creately supports search, zoom, focus views, and branch controls that make large org charts easier to use.
- search by name, title, department, region, or other fields
- zoom directly to the matching person or team
- use focus views to isolate a region, function, or leadership group
- collapse branches to reduce noise and simplify navigation
This makes it easier for employees to understand both their local structure and how it connects to the wider organization.
Step 6: Analyze coverage, overlap, and gaps across geographies
Once the org chart includes the right structural and regional information, use it to evaluate how the distributed organization is set up. This is where the org chart becomes more than a visual reference and starts supporting better management decisions.
In Creately, visual views, filters, and color-coded perspectives make it easier to compare teams across locations and spot patterns that may be harder to notice in spreadsheets.
- color the chart by region, department, or work arrangement
- filter by geography, function, or team type
- compare how coverage is distributed across regions
- spot overlaps in responsibility or gaps in support, leadership, or staffing
- identify structural patterns that may affect coordination across locations
This is especially useful for distributed teams because complexity often builds gradually across geographies and functions.
Step 7: Keep the structure aligned as regions and teams change
Distributed organizations are constantly changing as teams grow, regions expand, responsibilities shift, and reporting lines evolve. The org chart needs to stay aligned with those changes to remain useful.
Creately makes updates easier by letting teams edit directly on the chart instead of rebuilding it from scratch each time something changes.
- update names, titles, and reporting lines inline
- edit regional or team details as structures evolve
- add new people or direct reports with quick-create actions
- keep updates visible in one shared workspace
- collaborate in real time so everyone sees the latest structure
This helps the org chart stay useful as a living reference for a distributed organization, not just a one-time snapshot.