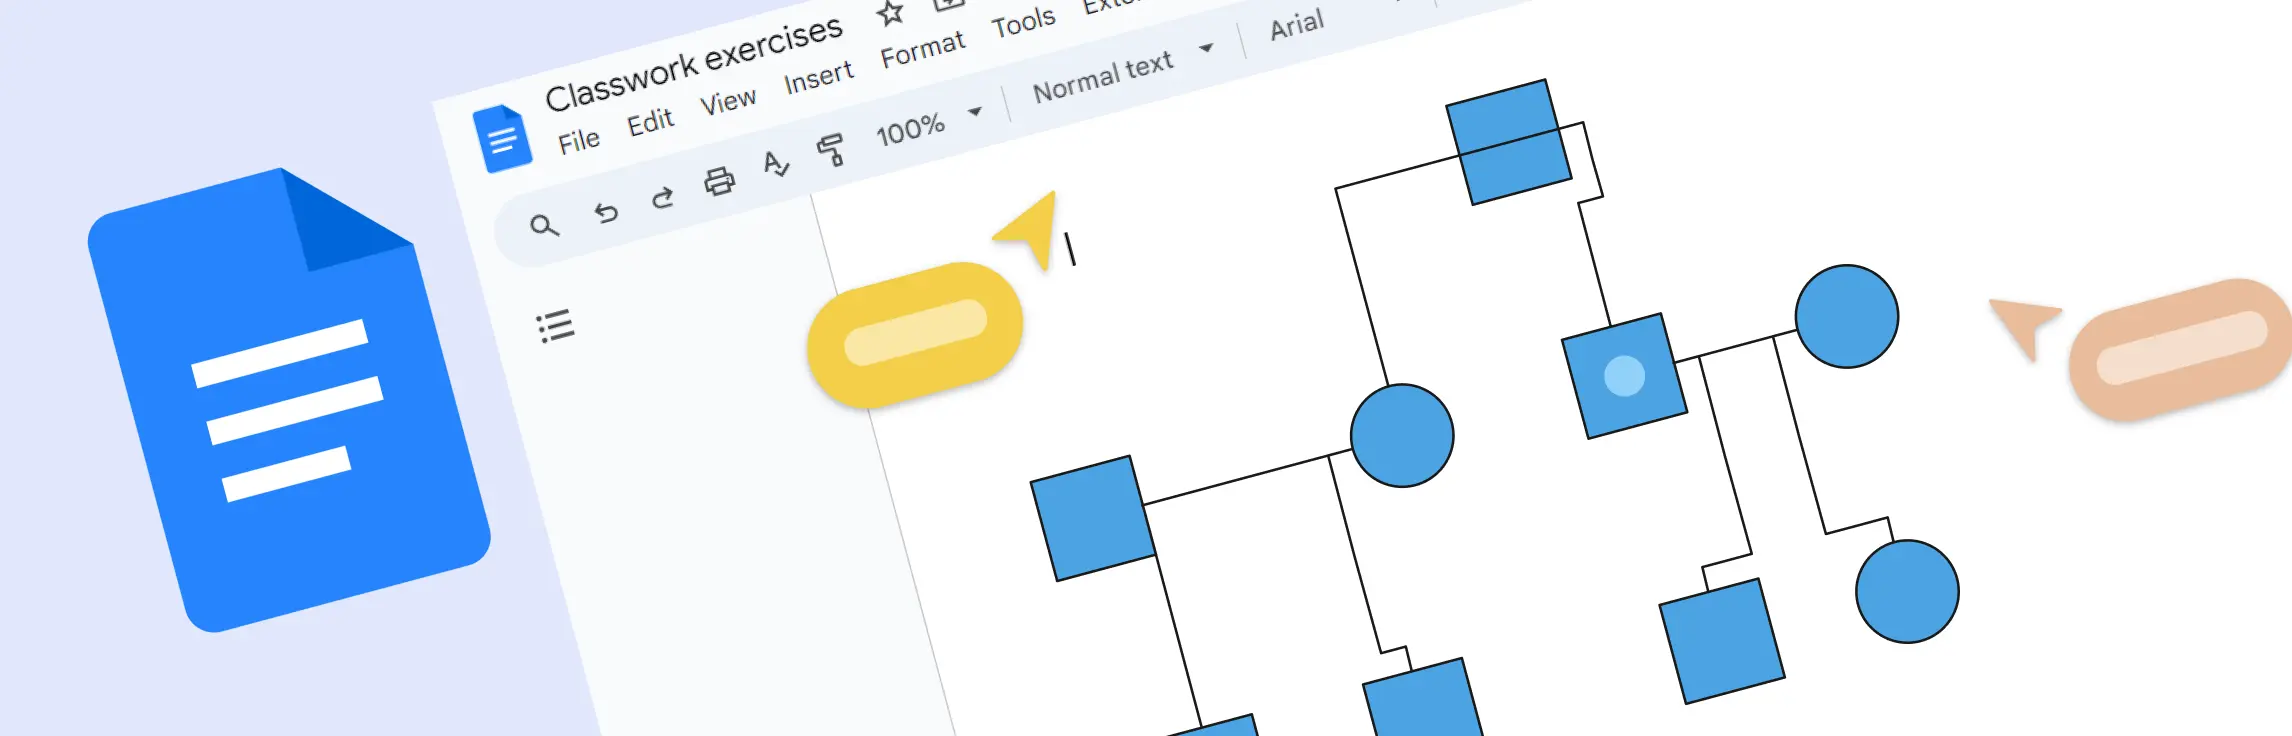
If you want to make a genogram on Google Docs, you can do it with the built-in Drawing tool, basic shapes, text boxes, and connectors. This method works best for simple family diagrams or quick drafts, but it takes more manual effort as the genogram becomes more detailed.
In this guide, you’ll learn how to make a genogram on Google Docs step by step, from opening a blank document to labeling relationships and formatting the final diagram. You’ll also see where Google Docs starts to feel limiting and when it makes sense to move to a dedicated genogram maker.
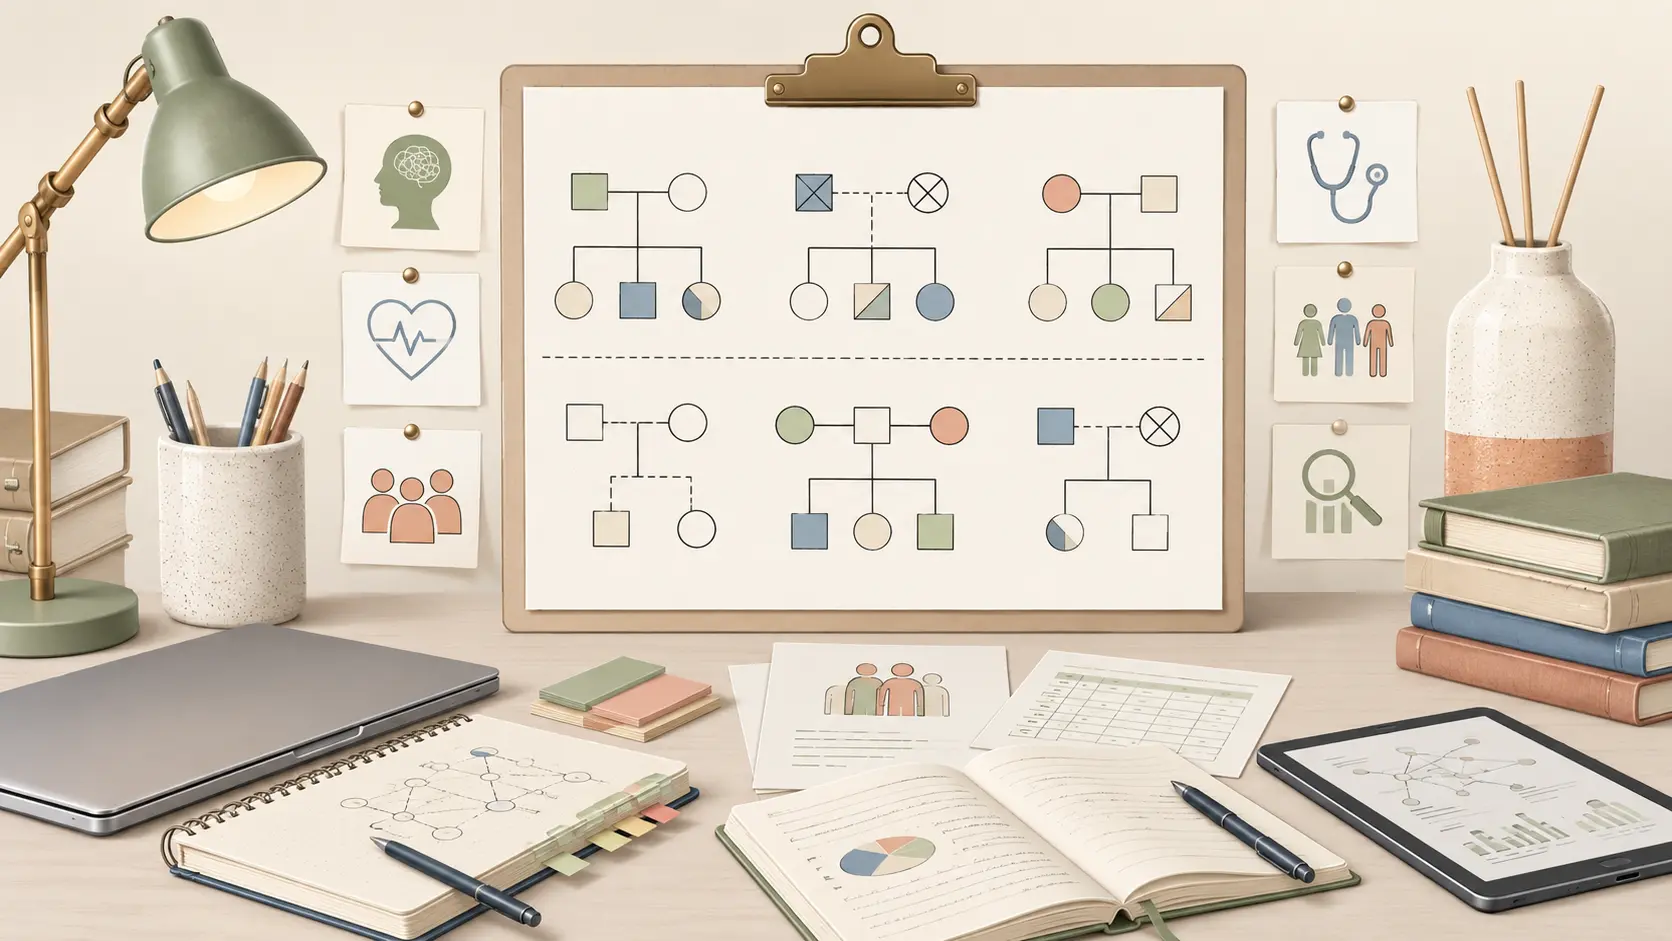
What Is a Genogram?
A genogram is a visual map of a person’s family relationships, history, and important patterns such as health conditions, emotional bonds, or behavioral traits. It goes beyond a basic family tree by including detailed information that can help with analysis in fields like healthcare, counseling, and education.
Step-by-Step: Make a Genogram on Google Docs
Now let’s go step by step through the manual Google Docs method for making a genogram.
Step 1. Open a new document in Google Docs
Go to docs.google.com and log in with your Google account.
Click the + Blank button to start a new document.
You can give your genogram a title at the top of the page like “My Family Genogram.”
Tip: If your genogram might be wide, go to File > Page setup, and change the orientation to landscape.
Step 2. Launch the Drawing tool
- Click on Insert in the top menu.
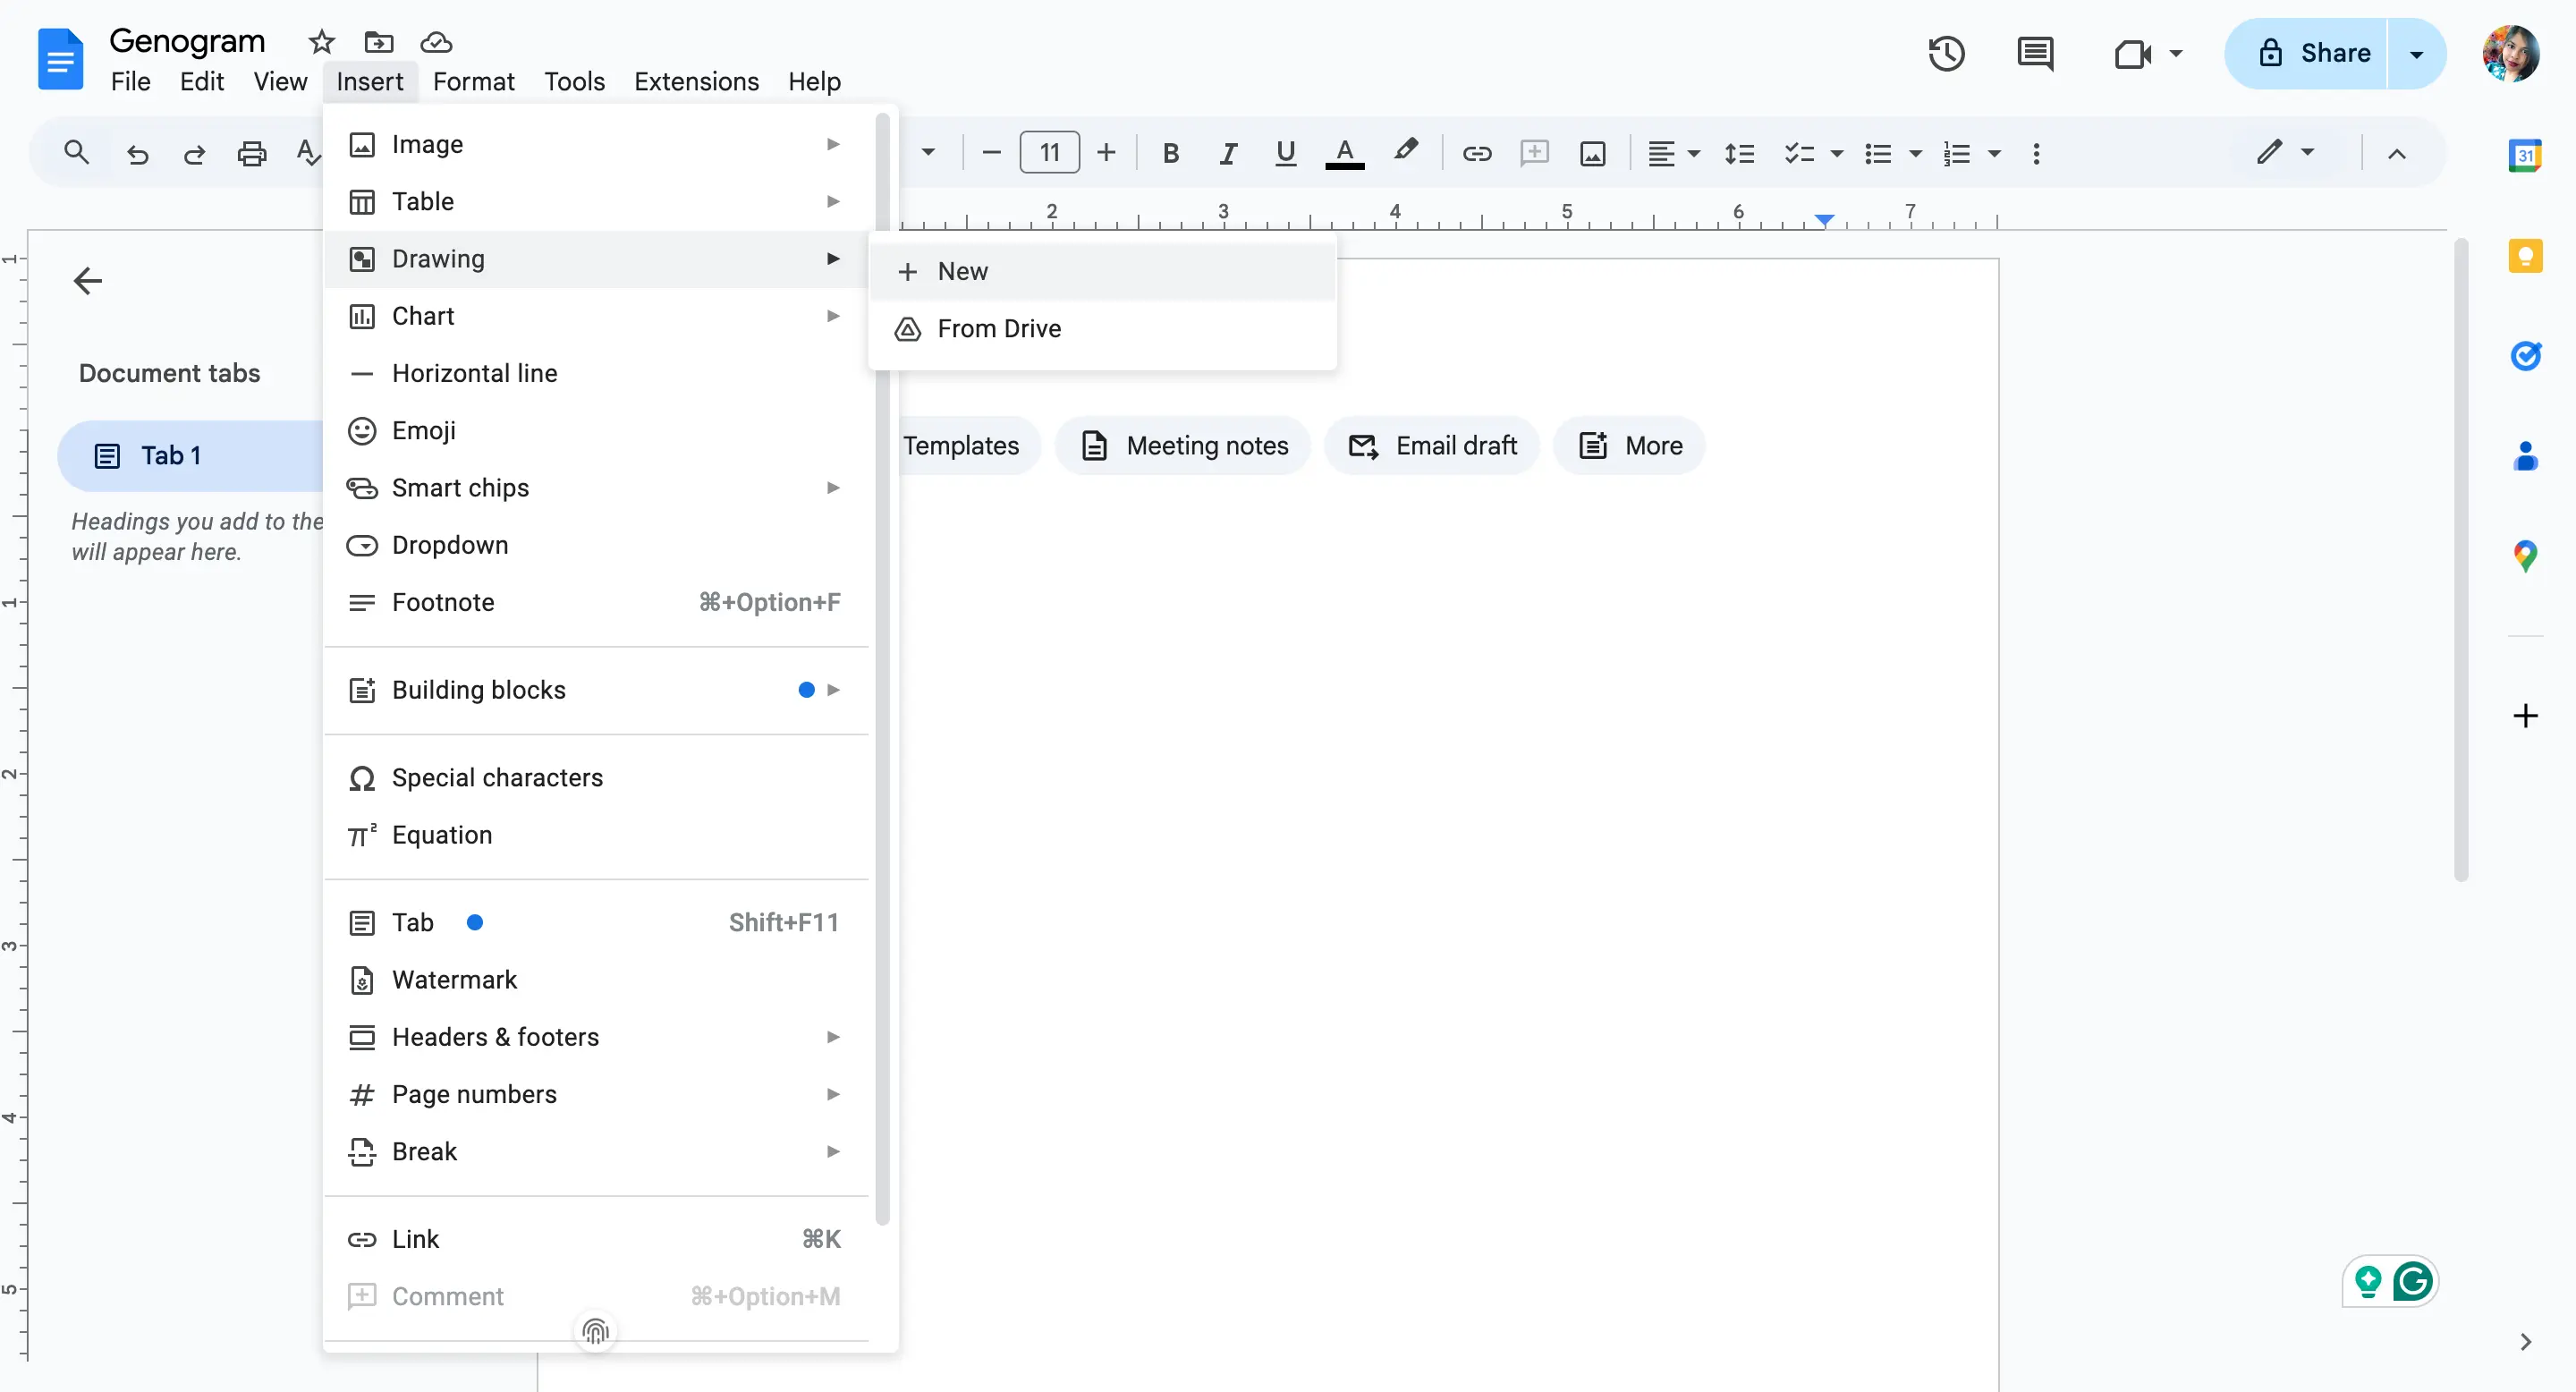
Hover over Drawing, then click + New.
A pop-up window will open where you can create and arrange shapes, lines, and text.
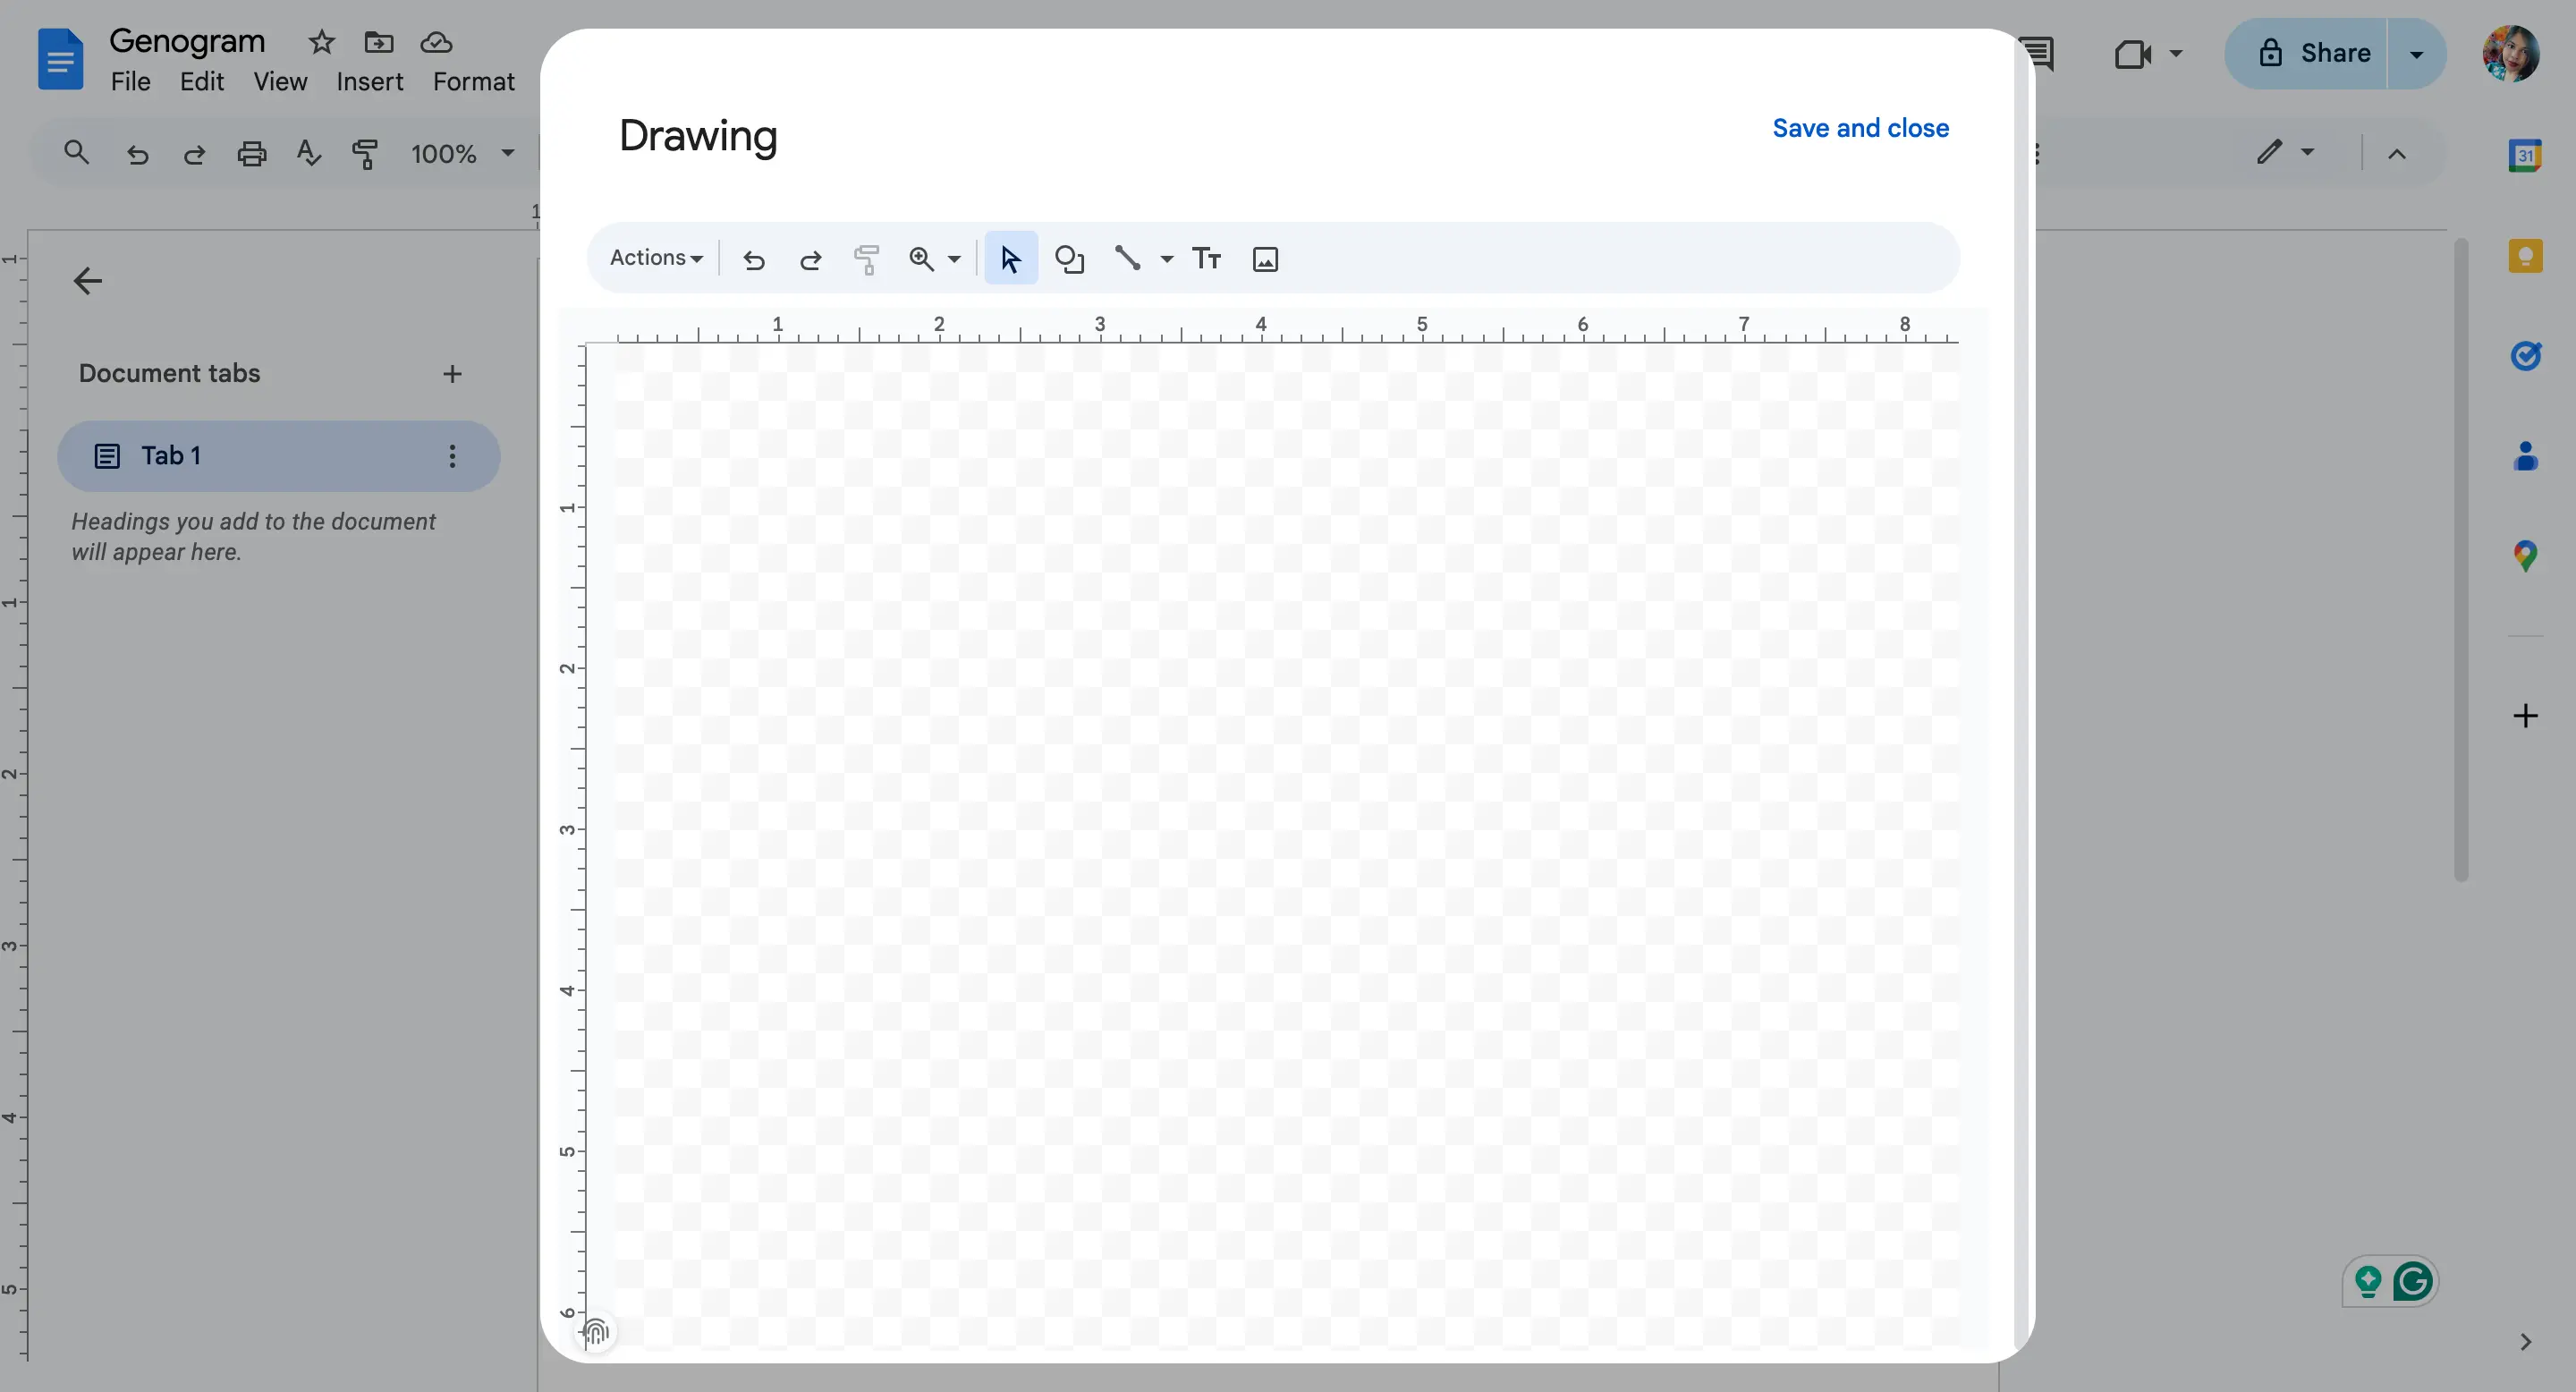
This is where you’ll build your genogram.
Step 3. Add family member symbols
In genograms, standard genogram symbols are used:
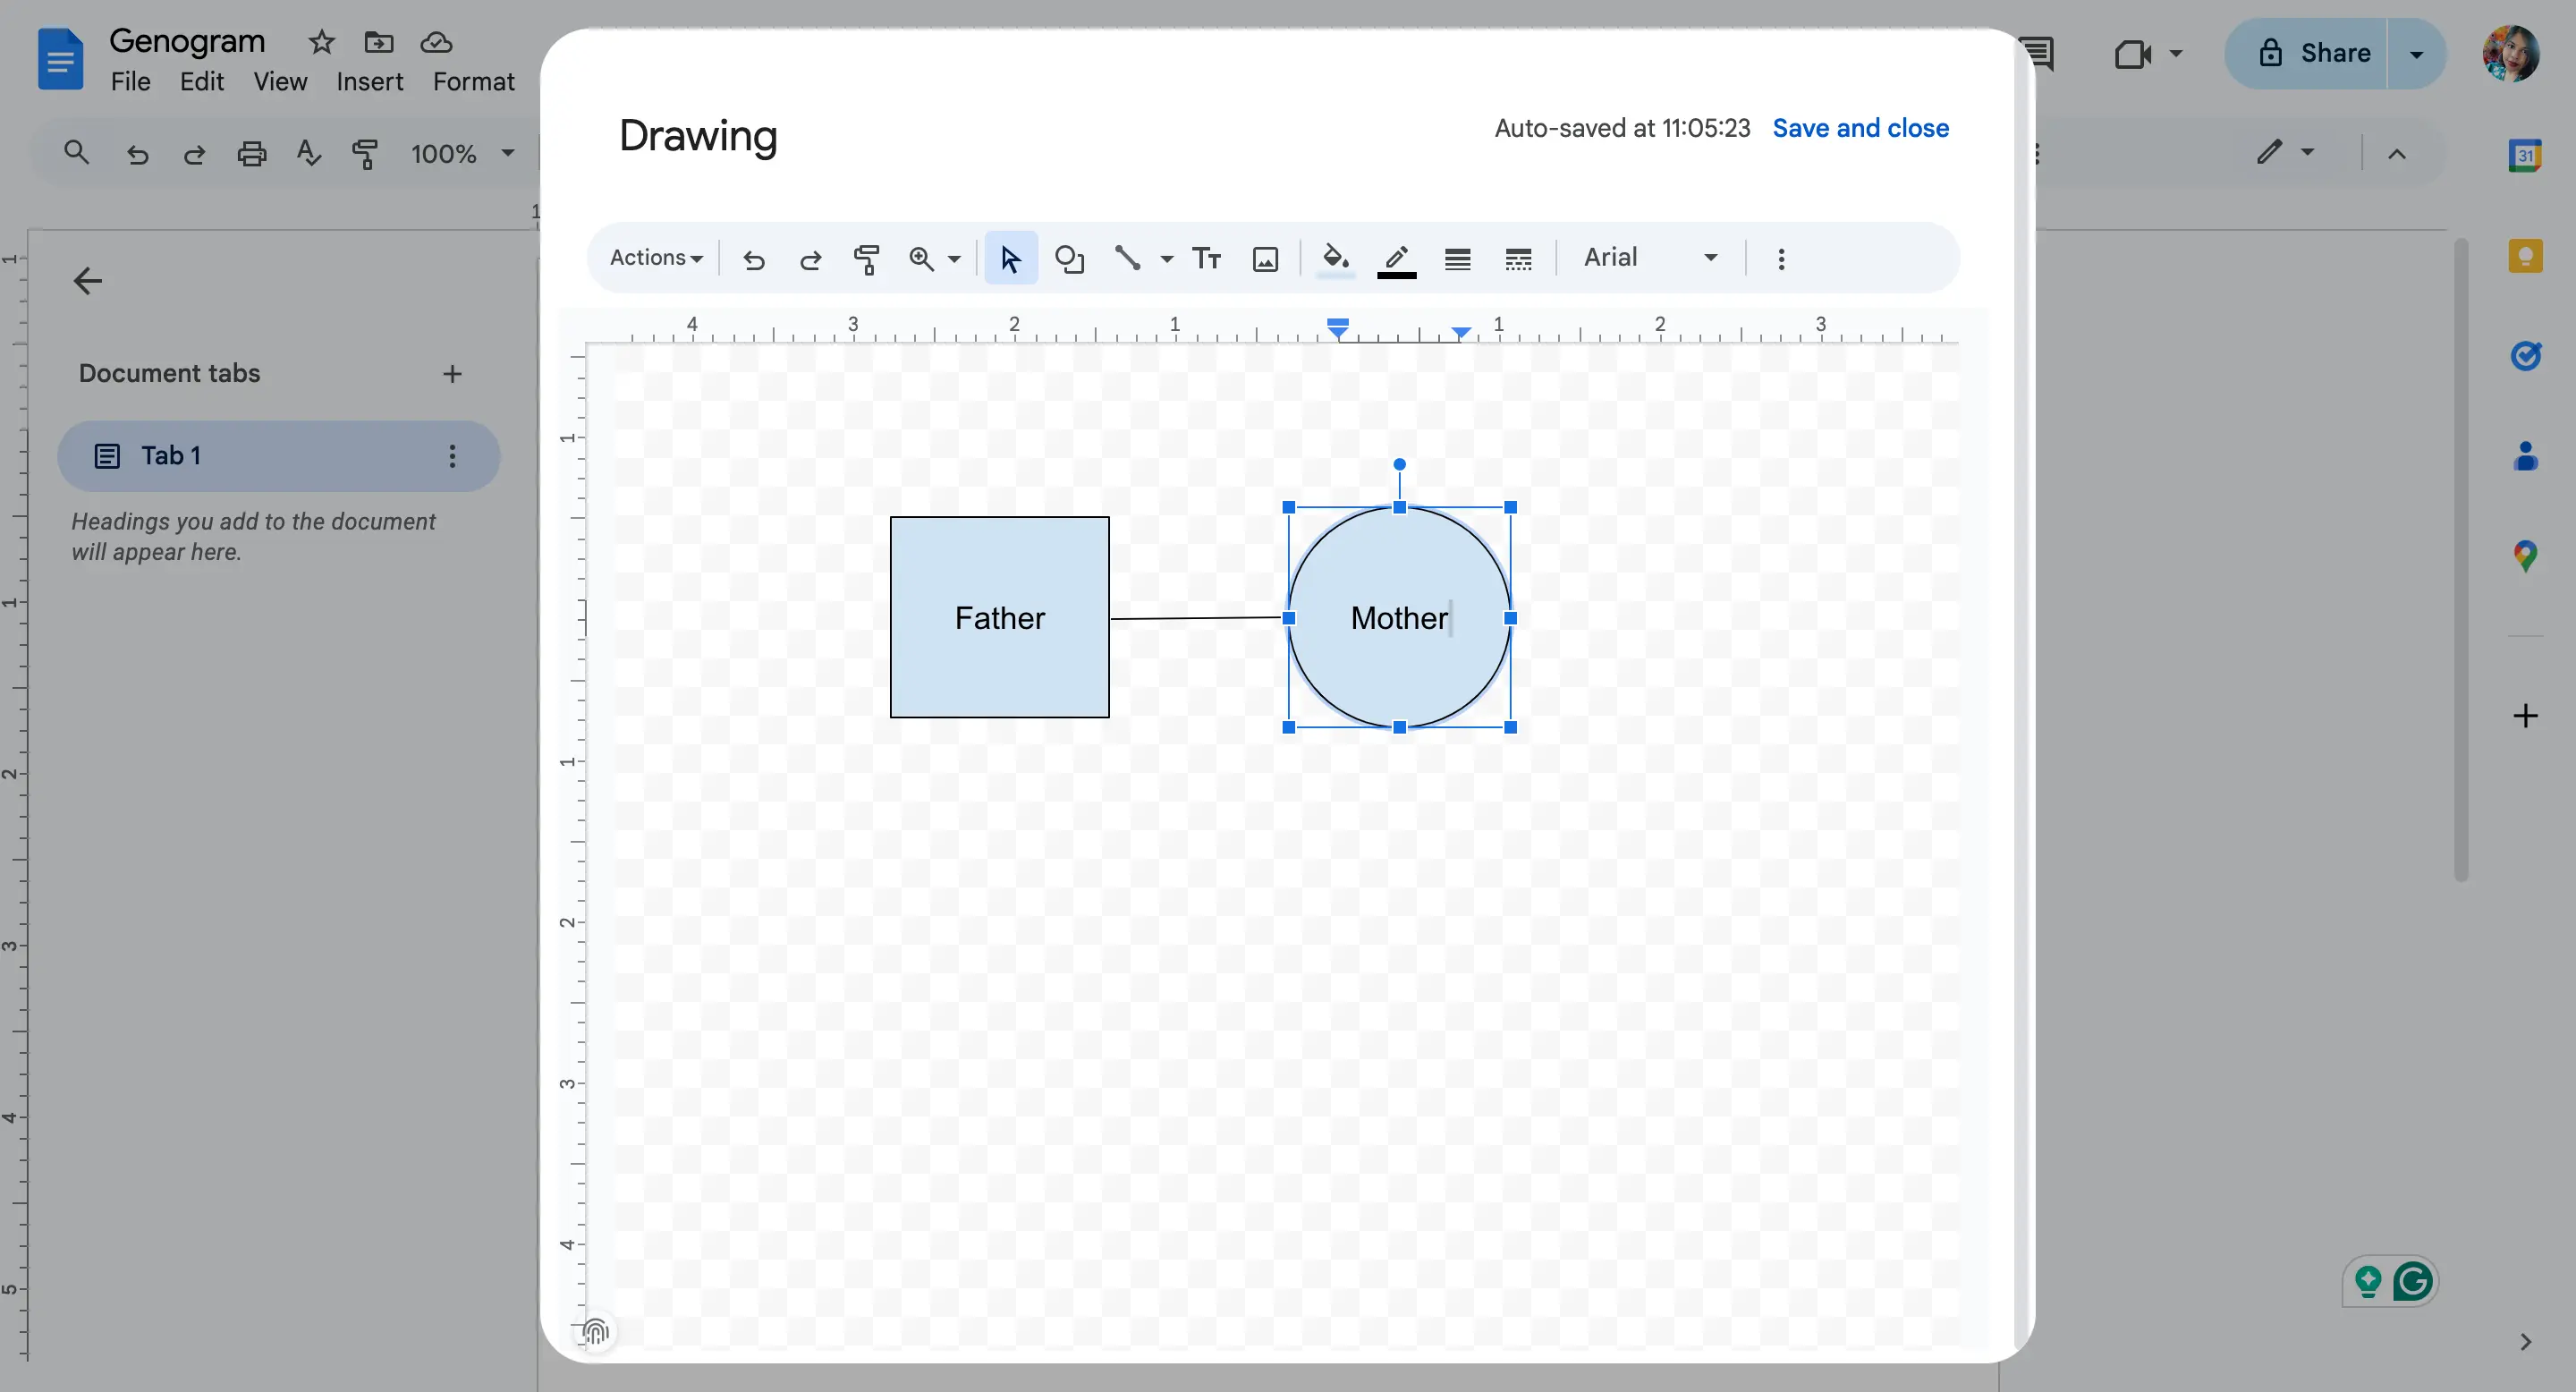
Circle = Female
Square = Male
To add these:
Click the Shape icon (a circle and square) in the Drawing toolbar.
Choose Shapes > Shapes, then pick the circle or square.
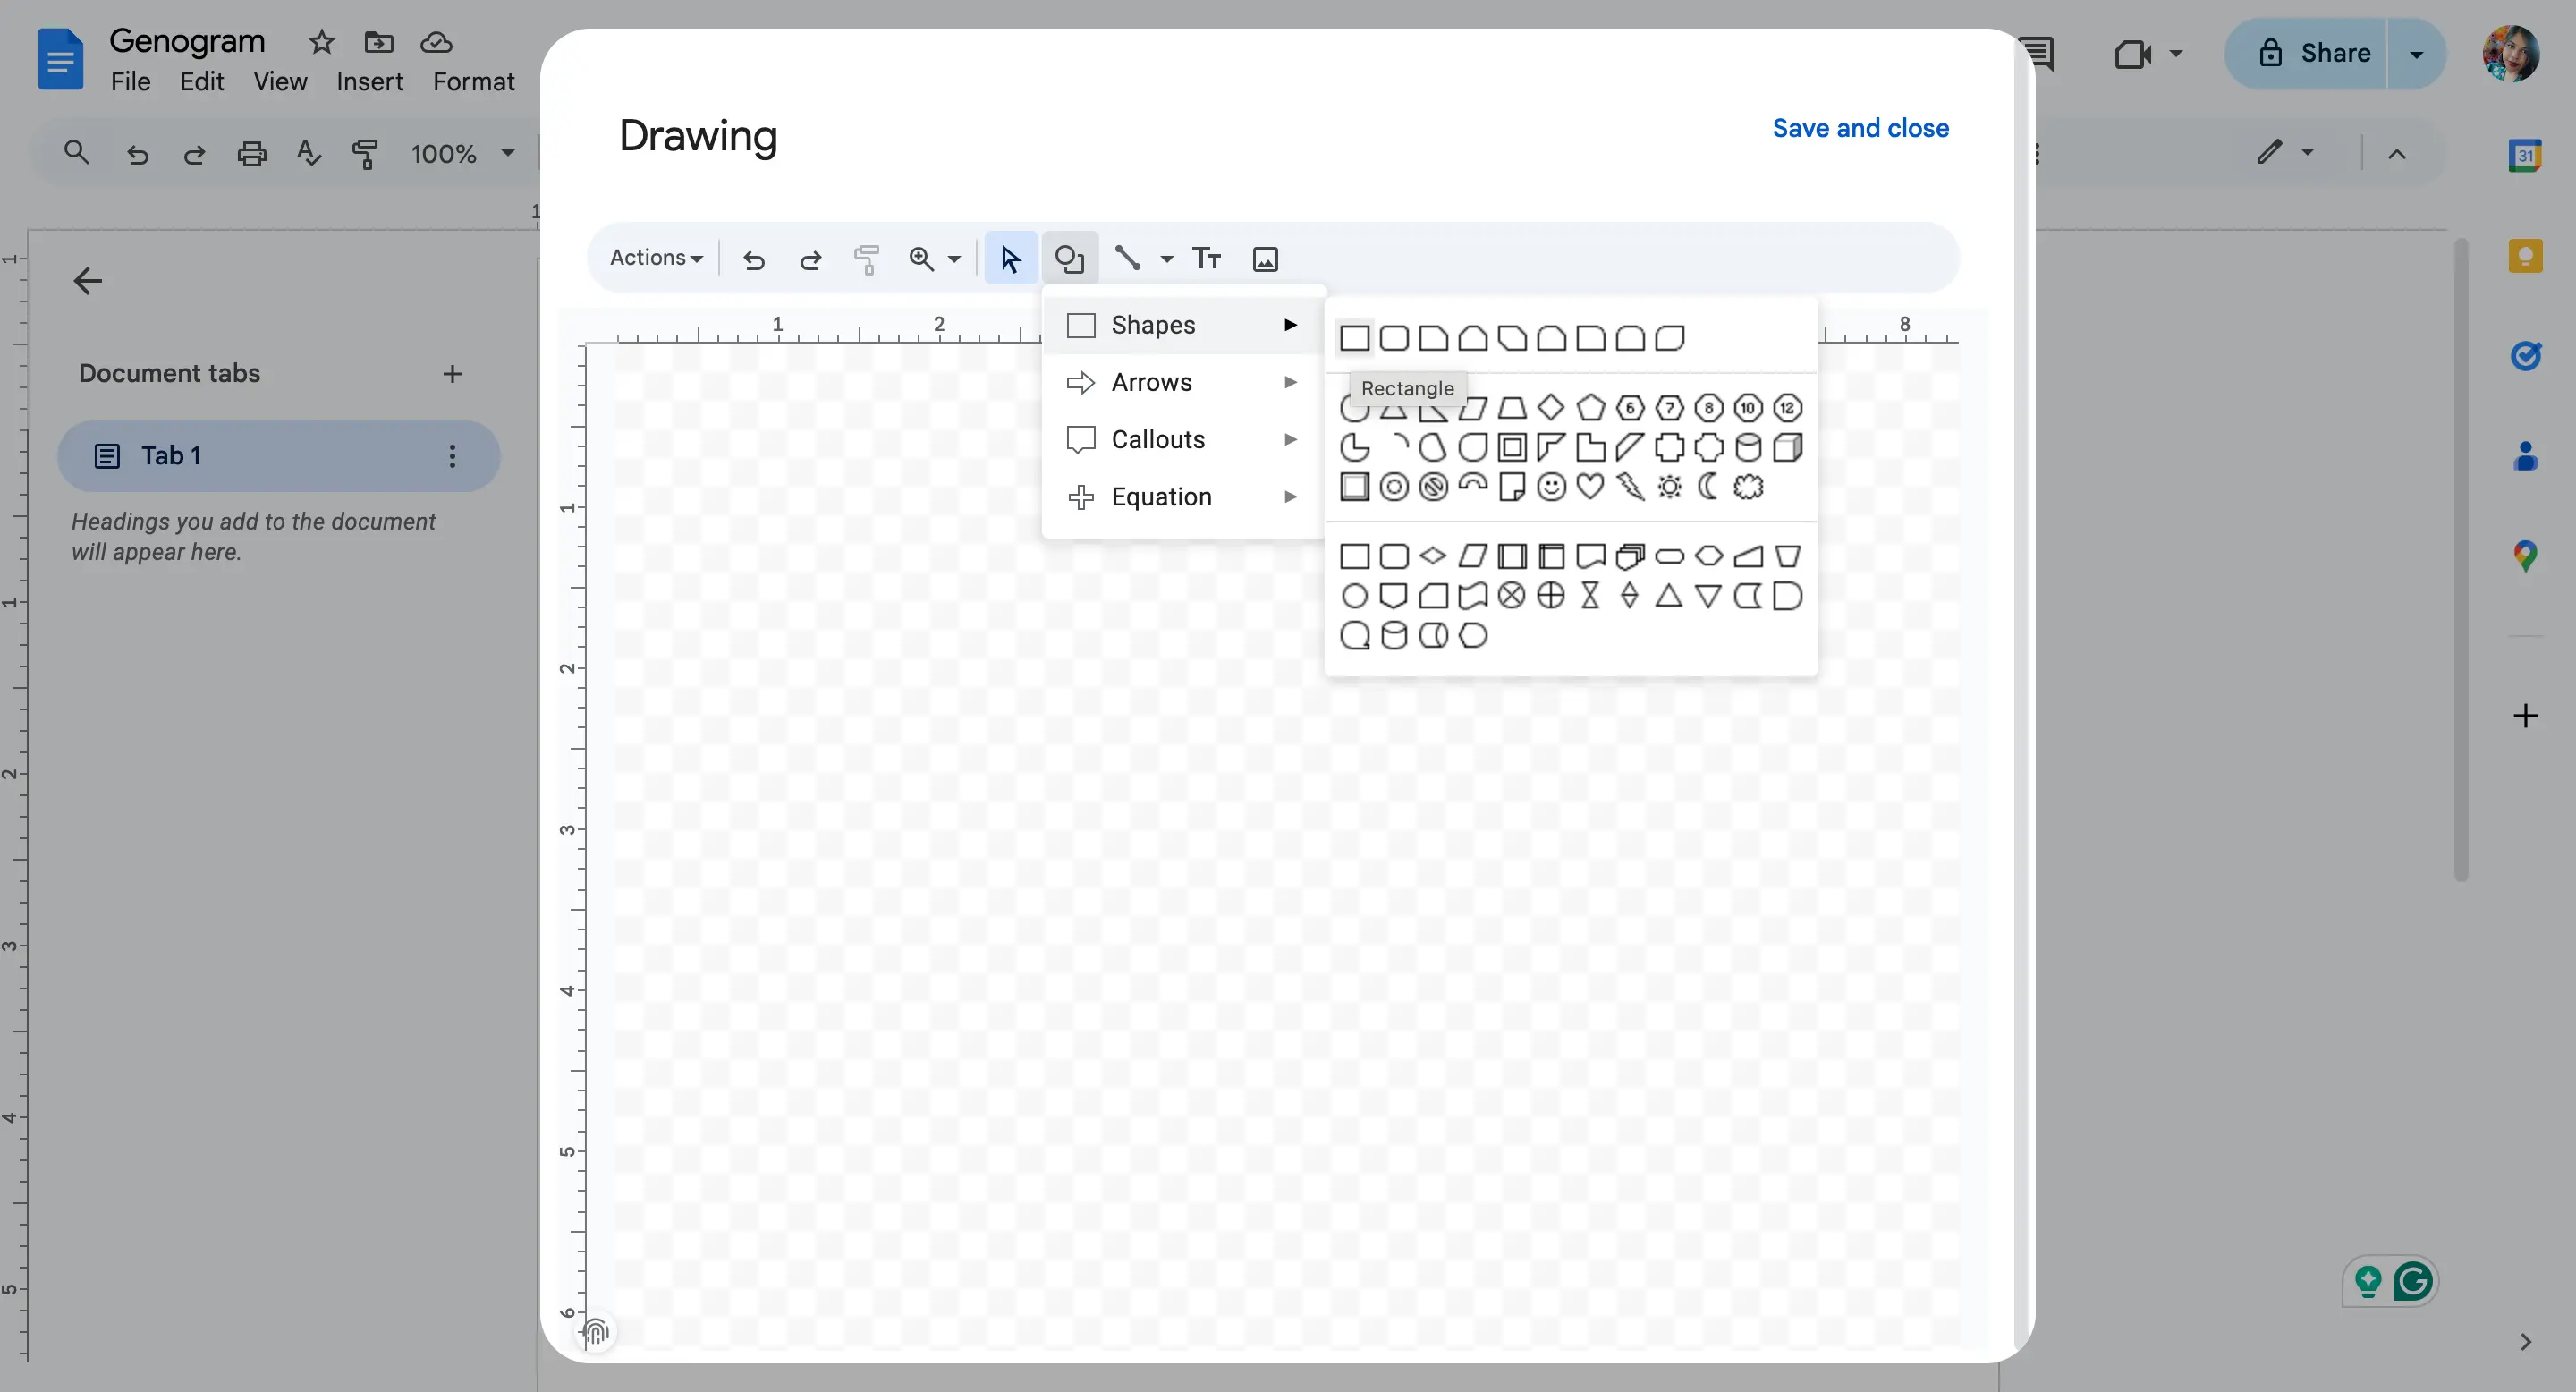
Click and drag on the canvas to draw the shape.
After adding a shape, double-click inside it to type the person’s name, birth year, or other details.
You can resize shapes and move them around easily by clicking and dragging.
Step 4. Show relationships with lines
Use lines to show how people are related:
- Click the Line icon in the Drawing toolbar.
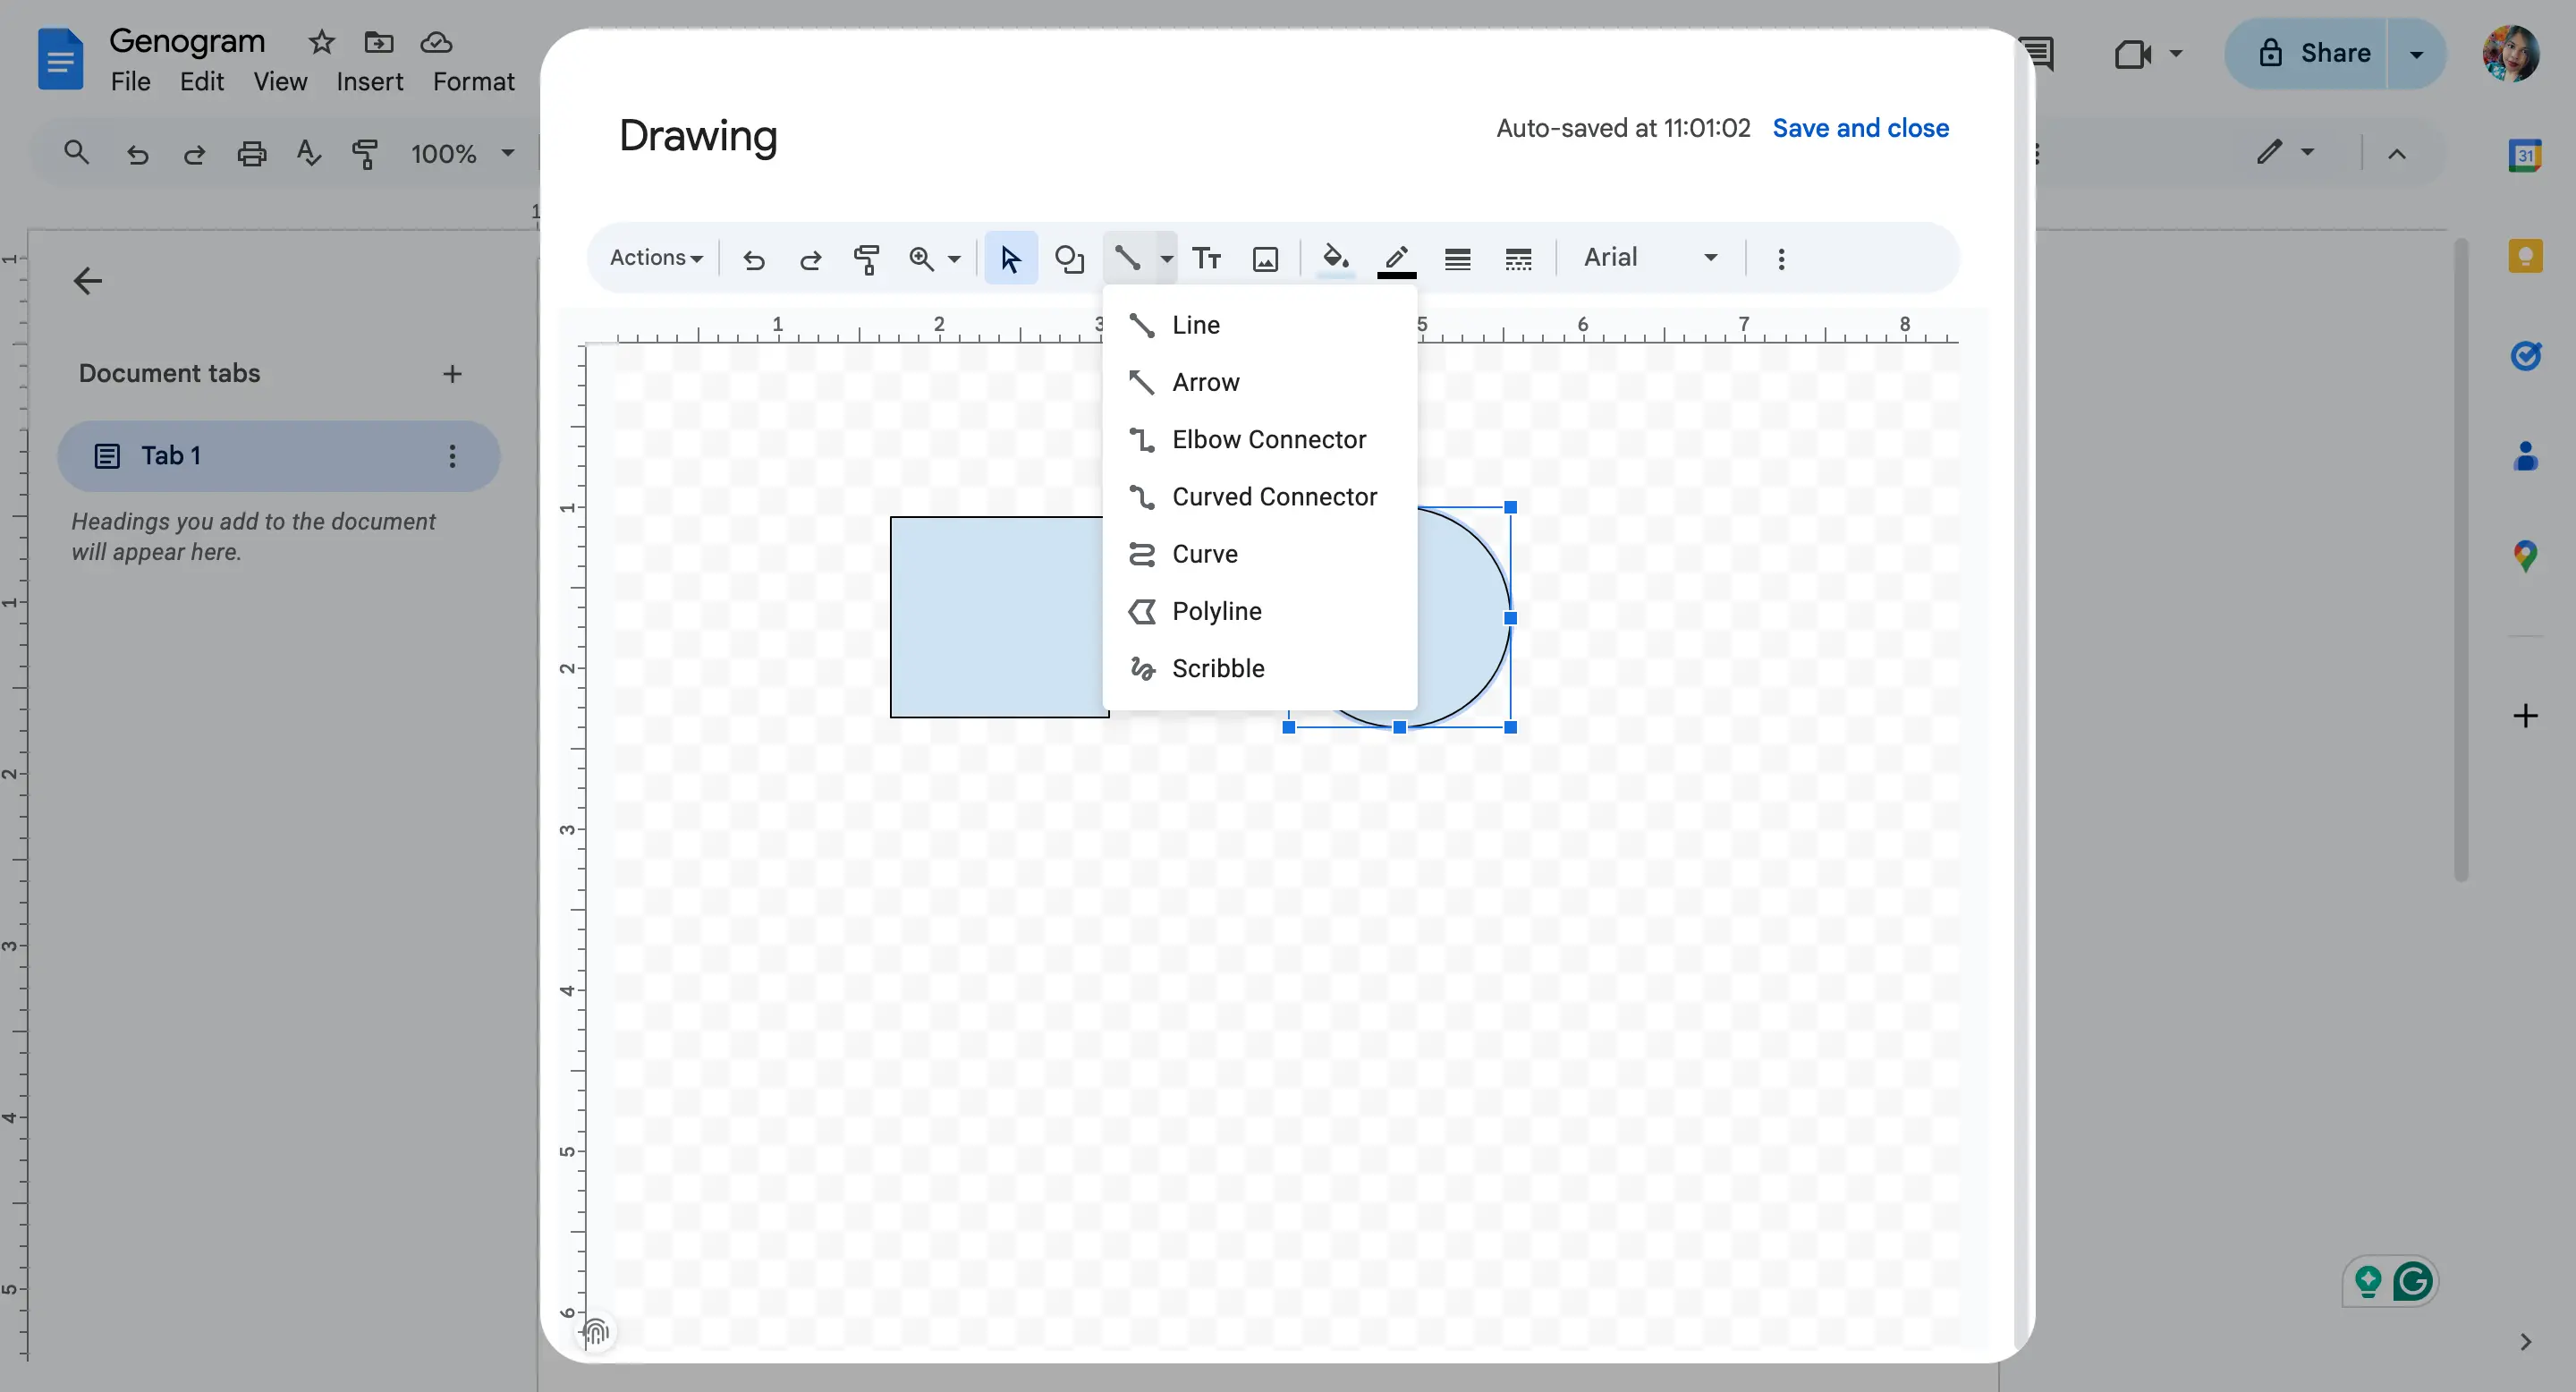
Draw a straight line between a male and female shape to show a marriage or relationship.
Draw vertical lines downward to connect to children.
Tip: Use the Elbow Connector or Arrow line styles if it helps make things clearer.
For more complex relationships:
Double lines can show separation or divorce.
Dotted lines can represent non-biological relationships (like adoption or guardianship).
Use text boxes to label relationships if needed.
Genogram notation can vary depending on the context, so keep a small legend nearby if you use custom line styles or simplified relationship markers.
If you need a quick reference for different connection styles, see this guide to genogram relationship types and genogram rules.
Step 5. Organize your layout
Arrange family members by generation—grandparents at the top, parents in the middle, children below.
Keep spacing consistent for a clean look.
Use text boxes if you want to add medical history, emotional relationships, or other notes next to a person.
To add a text box:
Click the Text box icon in the toolbar.
Click and drag to draw the box, then type your text.
Step 6. Save and insert the genogram into your document
Once your genogram is ready, click Save and Close (top right of the Drawing window).
It will now appear in your Google Doc as an image.
You can click on it later and select Edit to open the Drawing window again and make changes.
Step 7. Add a legend or notes (optional)
If you’ve used symbols or colors to show different things—like health conditions, emotional connections, or important dates—you can add a key or legend below your genogram to explain them.
Just type it like regular text or create a simple table:
Click Insert > Table, choose the number of rows and columns.
Fill it in with the meanings of your symbols and colors.
Step 8. Review and format your genogram
Make sure all names and connections are clear and easy to read.
Double-check for missing family members or relationship lines.
If you plan to print it, go to File > Print to preview how it will look.
Limitations of Using Google Docs for Genograms
If you’re learning how to make a genogram on Google Docs, it helps to know where the manual workflow becomes harder to manage. Google Docs can handle a simple genogram, but as your diagram gets more detailed, the lack of specialized genogram features becomes more noticeable:
No built-in genogram templates: You have to create everything from scratch—shapes, lines, labels, and symbols. This can take time, especially for larger families.
Limited design tools: The Drawing tool in Google Docs is basic. It doesn’t offer advanced features like auto-alignment, layering, or symbol libraries that you might find in dedicated genogram software.
No smart connections: Lines don’t automatically adjust when you move shapes around. You’ll have to reposition them manually, which can get frustrating with complex layouts.
Hard to scale: If your genogram gets big, it can be tricky to fit it neatly on one page. There’s no zoom feature inside the Drawing tool, and resizing the entire genogram can be awkward.
Lacks collaboration for the drawing itself: While you can collaborate on the document, two people can’t edit the genogram drawing at the same time.
So, while Google Docs works fine for creating simple genograms, it may not be the best choice for more detailed or professional ones. If you find yourself needing more features, you might want to explore tools made specifically for genogram building.
When to Use Creately Instead of Google Docs
Google Docs works if you want to build a simple genogram manually. But if you need to show complex relationships, work across multiple generations, add structured family data, or collaborate with others, a dedicated genogram tool is easier to manage.
Creately helps you move from written family information to a structured genogram faster. You can generate a starter genogram from a family description, review and edit the result, then refine the diagram with genogram symbols, relationship types, quick-add controls, field packs, comments, and export options.
Creately’s free genogram maker helps you move beyond the manual Google Docs workflow:
Generate a Genogram From Text: Paste a written family description and Creately’s text-to-genogram AI creates an initial visual genogram by identifying people, family roles, relationships, conditions, cultural heritage, dates, and other clearly stated details.
Edit the AI-Generated Output: The generated genogram is fully editable, so you can adjust names, relationships, layouts, symbols, and details instead of starting from a blank Google Docs drawing canvas.
Use Proper Clinical Genogram Notation: Creately includes person shapes following McGoldrick/Gerson notation, 40+ auto-derived person shape variants, and 71 relationship subtypes across 9 categories, helping you represent family structures more accurately than with basic Google Docs shapes.
Build Faster With Quick-Add Controls: Select a person and quickly add a partner, child, parent, parents, or sibling using quick-add controls or keyboard shortcuts, instead of manually drawing each person and connector.
Capture Structured Family Data: Activate field packs for medical and genetic details, family therapy, social work, legal and estate planning, or research to record important information directly within each person’s profile.
Collaborate in Real Time: Work with others using comments, live cursors, auto-save, and role-based permissions, which makes review and editing much easier than passing a Google Docs drawing back and forth.
Export and Generate Clinical Reports: Export your genogram as PDF, DOCX, PNG, JPEG, SVG, or JSON for documentation, sharing, or presentations. When you need more formal documentation, Creately can also generate a structured clinical report with the genogram diagram, individual profiles, a relationship matrix, and a symbol legend.
If you’re exploring how to create a genogram beyond the manual Google Docs method, this Creately guide shows the full process step by step, with clearer structure, symbols, and relationship mapping.
Google Docs Method vs Creately Genogram Maker
Google Docs and Creately can both help you create a genogram, but they fit different needs. Google Docs is fine for a small manual diagram, while Creately is better suited for larger, more detailed, or frequently updated genograms.
| Criteria | Google Docs Method | Creately Genogram Maker |
|---|---|---|
| Speed | Manual setup from scratch | Faster with templates, quick-add controls, and AI-powered text-to-genogram generation |
| Symbols | Basic shapes only | 40+ auto-derived person shape variants following McGoldrick/Gerson notation |
| Relationships | Manual lines and labels | 71 relationship subtypes with distinct clinical notation |
| Collaboration | Document collaboration, limited drawing editing | Real-time diagram collaboration with live cursors, comments, auto-save, and role-based permissions |
| Family Relationship Complexity | Harder to manage as the diagram grows | Better for complex, blended, clinical, and multi-generational genograms |
| Structured Data | Notes must be added manually | Field packs for medical, therapy, social work, legal, estate, and research data |
| Export | Basic document workflow | Export as PDF, DOCX, PNG, JPEG, SVG, and JSON |
| Templates | No built-in genogram templates | Blank, couple, 2-generation, 3-generation, and clinical framework genogram templates |