What is a Deployment Diagram
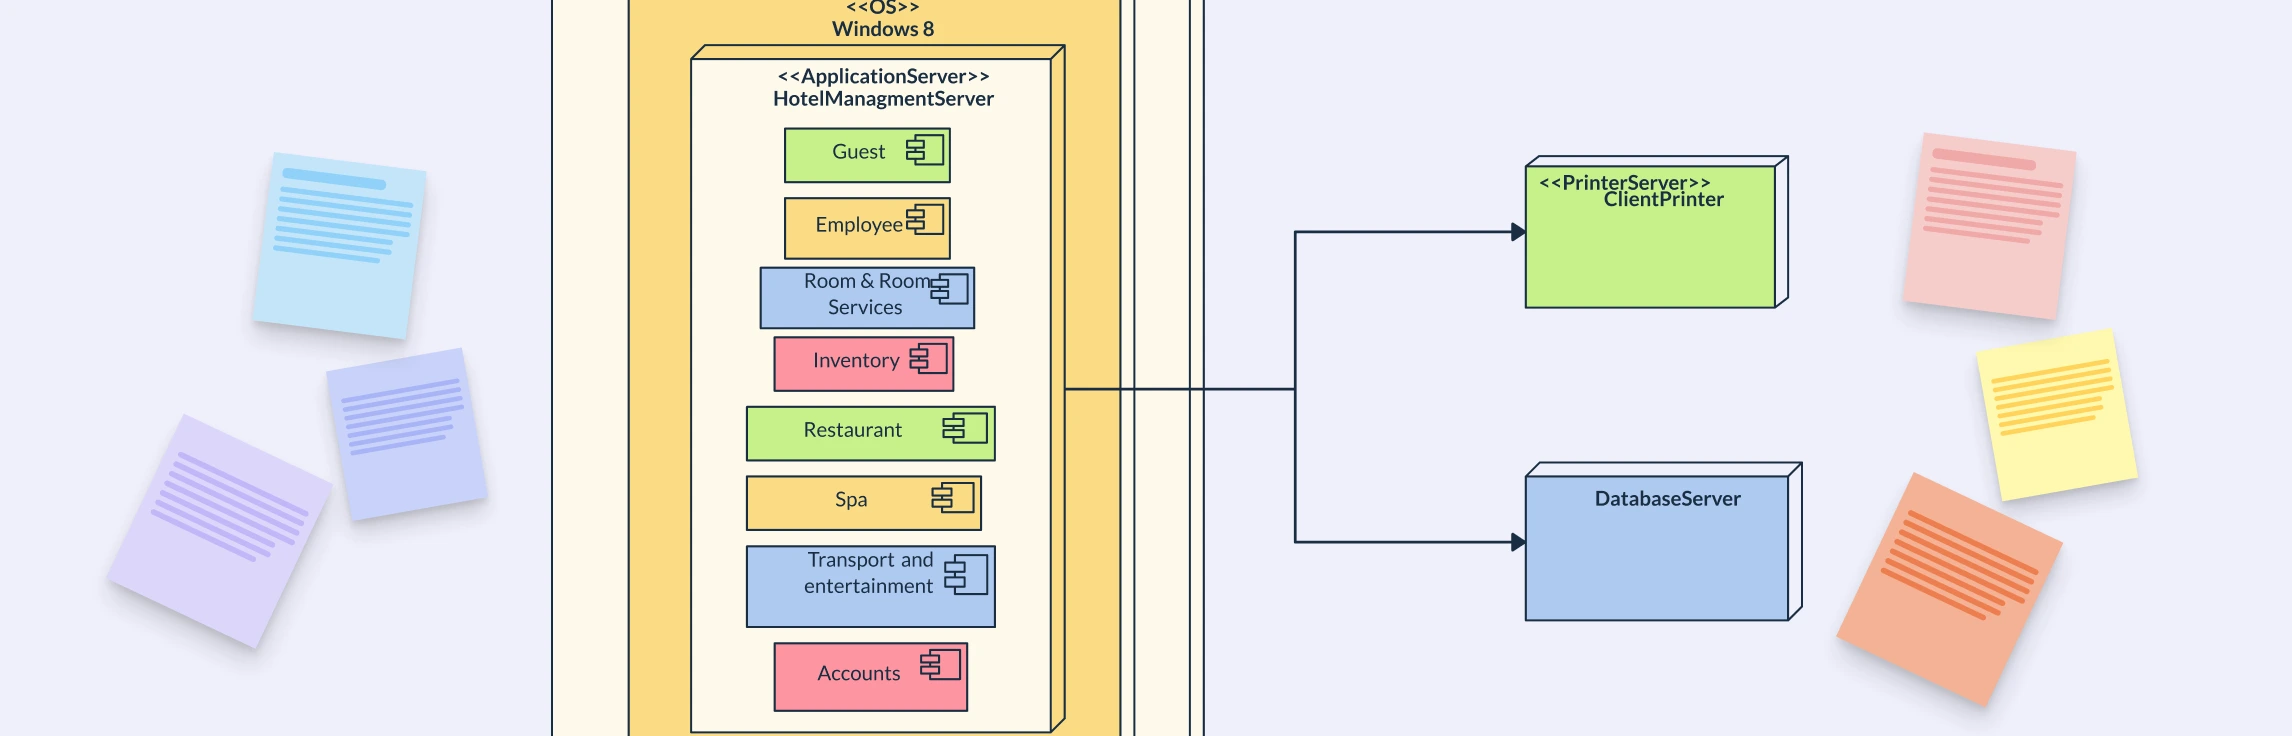
A UML Deployment Diagram is a structural diagram that shows how software components are deployed across hardware or network environments. It maps hardware nodes (servers, devices) to software artifacts (applications, databases) to visualize where each part runs and how they interact. In short, it illustrates a system’s runtime architecture, helping teams understand and document how software operates within its infrastructure.


Purpose of Deployment Diagrams
Visualize System Architecture: Depicts the distribution of software artifacts (like executables, components, databases) across hardware nodes such as servers, devices, or cloud instances.
Understand Hardware–Software Interaction: Helps engineers and system architects see how software elements interact with the underlying hardware and how communication occurs between nodes.
Plan Deployment and Scalability: Useful for system deployment planning which clarifies load distribution, redundancy, and performance considerations in large-scale or distributed systems.
Support Implementation and Maintenance: Provides a reference for system administrators and developers during installation, configuration, and future scaling or debugging tasks.
Communicate Design Decisions: Helps technical teams, stakeholders, and DevOps engineers understand deployment constraints, network relationships, and component locations.
When to Use a Deployment Diagram
Modeling Enterprise Systems
Deployment diagrams are often used in large-scale enterprise applications to represent how different software modules are deployed across multiple servers or data centers. For example, you can map a corporate CRM system that spans an application server, database cluster, and client machines in various departments.
Designing Cloud and Hybrid Architectures
Teams use deployment diagrams to plan cloud migrations or hybrid deployments, showing which components run on on-premise servers and which move to the cloud. They help visualize distributed elements such as web apps on AWS EC2, databases on Azure SQL, and APIs hosted through Kubernetes clusters.
Documenting Web Application Deployments
Web and mobile development teams use deployment diagrams to document the layout of web servers, app servers, load balancers, and databases. This provides a clear map of how a web-based application functions after deployment and ensures consistent environments across development, staging, and production.
Planning Internet of Things (IoT) Systems
In IoT environments, deployment diagrams show how edge devices, sensors, gateways, and cloud platforms communicate. This makes it easier to design data collection, processing, and storage flows between the physical world and digital infrastructure.
Mapping Multi-Tier Applications
When building applications with distinct layers like presentation, business logic, and data, deployment diagrams help visualize how these layers are deployed on separate servers or containers. It’s especially useful in microservices or service-oriented architectures (SOA).
Visualizing Client–Server Systems
Deployment diagrams clearly represent how clients interact with central servers, such as in banking systems, online games, or ERP solutions. They show hardware configurations, communication protocols, and deployed software on both sides of the connection.
Modeling Distributed Databases
Architects use deployment diagrams to illustrate replicated or sharded database systems across different nodes. This helps in understanding how data synchronization and failover mechanisms work in a distributed setup.
Integrating Third-Party Systems
When software needs to communicate with external services like payment gateways, email servers, or analytics tools, deployment diagrams clarify where those integrations occur and how data flows between internal and external nodes.
Simulating Test or Production Environments
Before rollout, QA and DevOps teams use deployment diagrams to mirror test environments that replicate production. This ensures all required nodes, containers, and network configurations are correctly represented before deployment.
Supporting System Migration or Upgrades
During infrastructure changes or version upgrades, deployment diagrams help teams map old and new configurations side by side. This provides a visual plan for safe migration with minimal disruption.
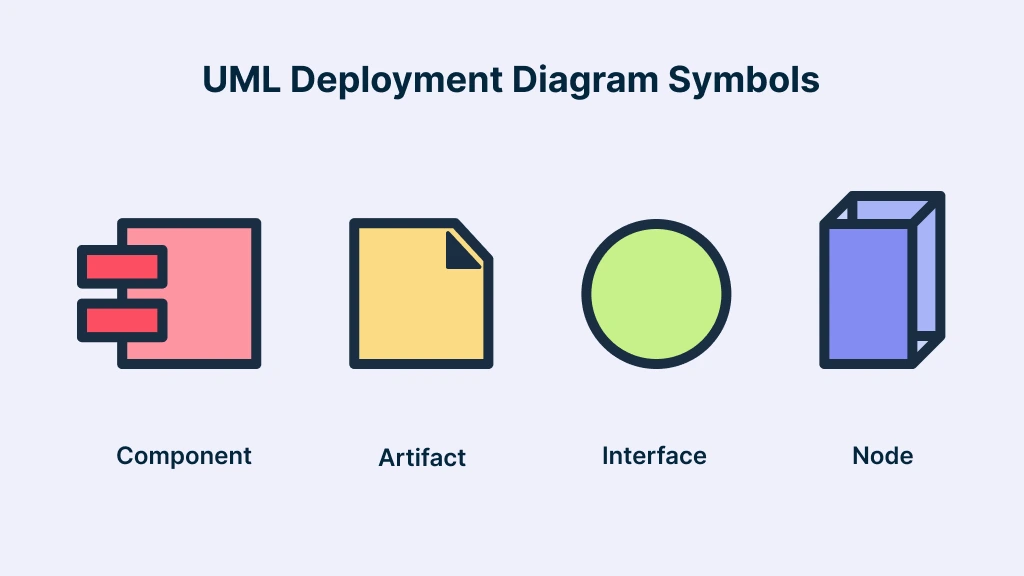
Deployment Diagram Symbols and Notations
In order to draw a deployment diagram, you need to first become familiar with the following deployment diagram elements and the symbols that represent them in UML.
Nodes
Nodes represent the physical or virtual hardware on which software components are deployed. These can be servers, routers, mobile devices, or cloud instances. Each node can host multiple artifacts or even contain other nodes (for example, a web server running inside a virtual machine). Nodes help you visualize the physical structure and resource allocation of your system.
Components
Represent modular parts of a system’s software that provide specific functionality. Components (e.g., WebApp, API Service, Database Module) can be shown inside nodes to clarify what part of the software runs there. This helps bridge the connection between component diagrams and the physical deployment.
Interfaces / Ports
Define the points of interaction between components or nodes. Ports represent specific connection points on nodes (e.g., API endpoints, network ports, or interfaces for external systems), making data exchange paths explicit.
Artifacts
Artifacts are the deployable software units that reside on nodes. They include application files, executables, libraries, scripts, databases, or configuration files. Artifacts define what is being deployed and help clarify which software components live on which device or server.
Communication Paths
Represented by a solid line between two nodes. They show the physical or logical links that allow nodes to communicate. For example, a network connection between a web server and a database server. They show how data and control signals move across the system.
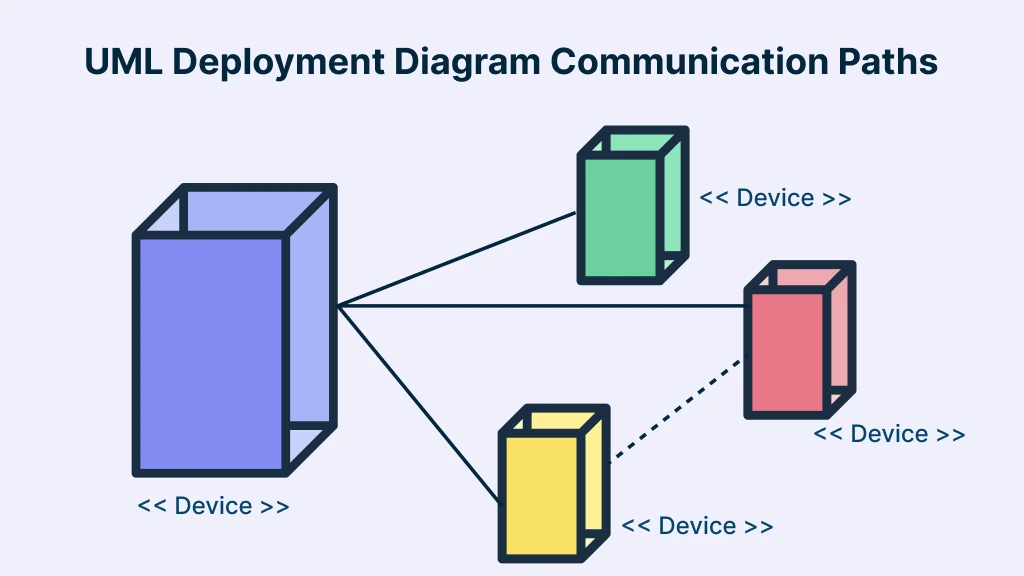
Dependencies
Indicate how nodes and components rely on or interact with one another. They highlight connections such as communication paths, deployment conditions, or other functional dependencies within the system.
Associations
Represent links between nodes and components, showing which components are deployed on specific nodes. They help map software elements to their corresponding physical or virtual deployment environments.
Devices and Execution Environments
A device represents tangible or virtual hardware like a mobile phone, IoT sensor, or server. An execution environment is a software container or platform, such as a Java Virtual Machine, Docker container, or application server, that hosts running artifacts. Together, they describe the runtime layers within the deployment architecture.
Deployment Specifications
A deployment specification is a configuration file (such as a text file or XML document) that defines how an artifact is deployed on a node. It specifies parameters like resource allocation, environment variables, and execution settings, ensuring the artifact runs correctly within its target environment.
Stereotype Labels
UML stereotypes like «device», «artifact», or «executionEnvironment» clarify each element’s role. Using consistent labels and annotations helps make the diagram easier to read and interpret, especially in complex architectures.
Guidelines for Creating Deployment Diagrams
Before you start creating your UML deployment diagram, keep these key guidelines in mind to ensure accuracy and completeness:
Identify the system scope: Decide whether you’re diagramming a single application or an entire network deployment.
Assess hardware limitations: Consider physical or virtual hardware constraints, legacy systems, and operating environments you’ll interact with.
Define your distribution architecture: Determine how many tiers your system will have and which applications or services belong in each layer.
List all nodes and connections: Identify every node (device, server, or container) involved and map out how they connect and communicate.
Assign components to nodes: Decide which software components, services, or artifacts are deployed on which nodes to reflect real-world structure.
How to Draw a Deployment Diagram in Creately
Follow the simple steps below to draw a deployment diagram. Use Creately’s Deployment Diagram Tool to visualize how software components are distributed across servers, devices, and networks.
Step 1: Choose a Deployment Diagram Template
Start by selecting a suitable deployment diagram template that fits your project to get started right away. You can also start from scratch if you prefer to build your diagram manually.
Step 2: Map Out Relationships Between Nodes
Determine how the nodes and devices connect within your system. Add communication paths (solid lines) to represent physical or logical links. For example, the network connection between a web server and a database server. This establishes the basic structure of your system’s architecture.
Step 3: Add Supporting Elements
Next, add components, artifacts, and active objects to show what software or services are deployed on each node. This step bridges the logical design (components) with the physical deployment (nodes and devices).
Step 4: Define Dependencies and Interactions
Include dependencies or associations between components and nodes using dashed lines. These relationships make it clear how different parts of the system rely on one another and ensure your diagram reflects accurate interaction flows.
Step 5: Review, Label, and Refine
Once your diagram is complete, review it for clarity and accuracy. Ensure each element is properly labeled with stereotypes such as «device» or «artifact», and verify that dependencies are correct. Clean up overlapping lines, adjust layout for readability, and confirm the diagram aligns with your deployment goals.
Step 6: Share and Collaborate
After refining your diagram, share it with your team to gather feedback and ensure alignment across stakeholders. In Creately, you can share diagrams via a secure link, invite collaborators to edit in real time, or export the diagram as an image, PDF, or SVG for documentation and presentations. You can also present directly from the canvas, allowing your team to discuss and iterate on the deployment design together.
Integrating Deployment Diagrams with other UML Diagrams
Integrating Deployment Diagrams with other UML diagrams provides a complete view of the system, combining both the logical design and the physical implementation. This integration helps teams understand how software elements are structured, deployed, and interact within real-world environments.
Use Case Diagrams: Link deployment diagrams with use case diagrams to identify which hardware nodes support specific use cases. This clarifies the physical infrastructure required for different system functions.
Class Diagrams: Connect deployment diagrams with class diagrams to show how software classes or modules are distributed across nodes. This helps visualize how system logic maps onto physical components.
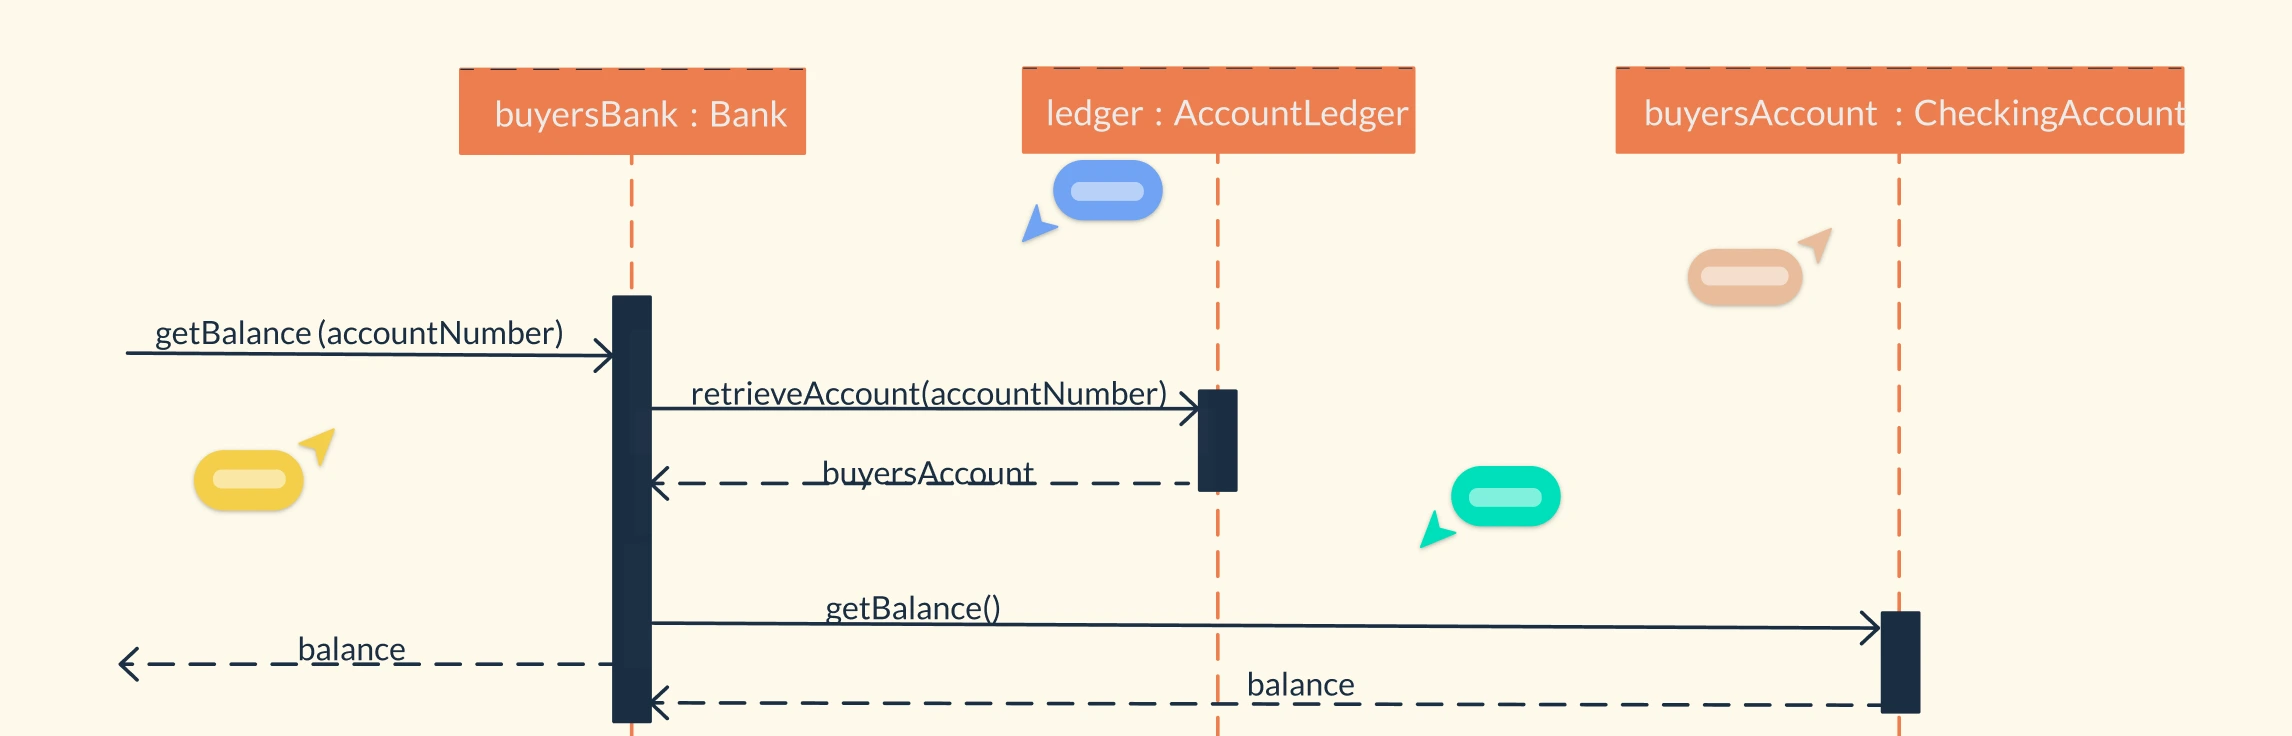
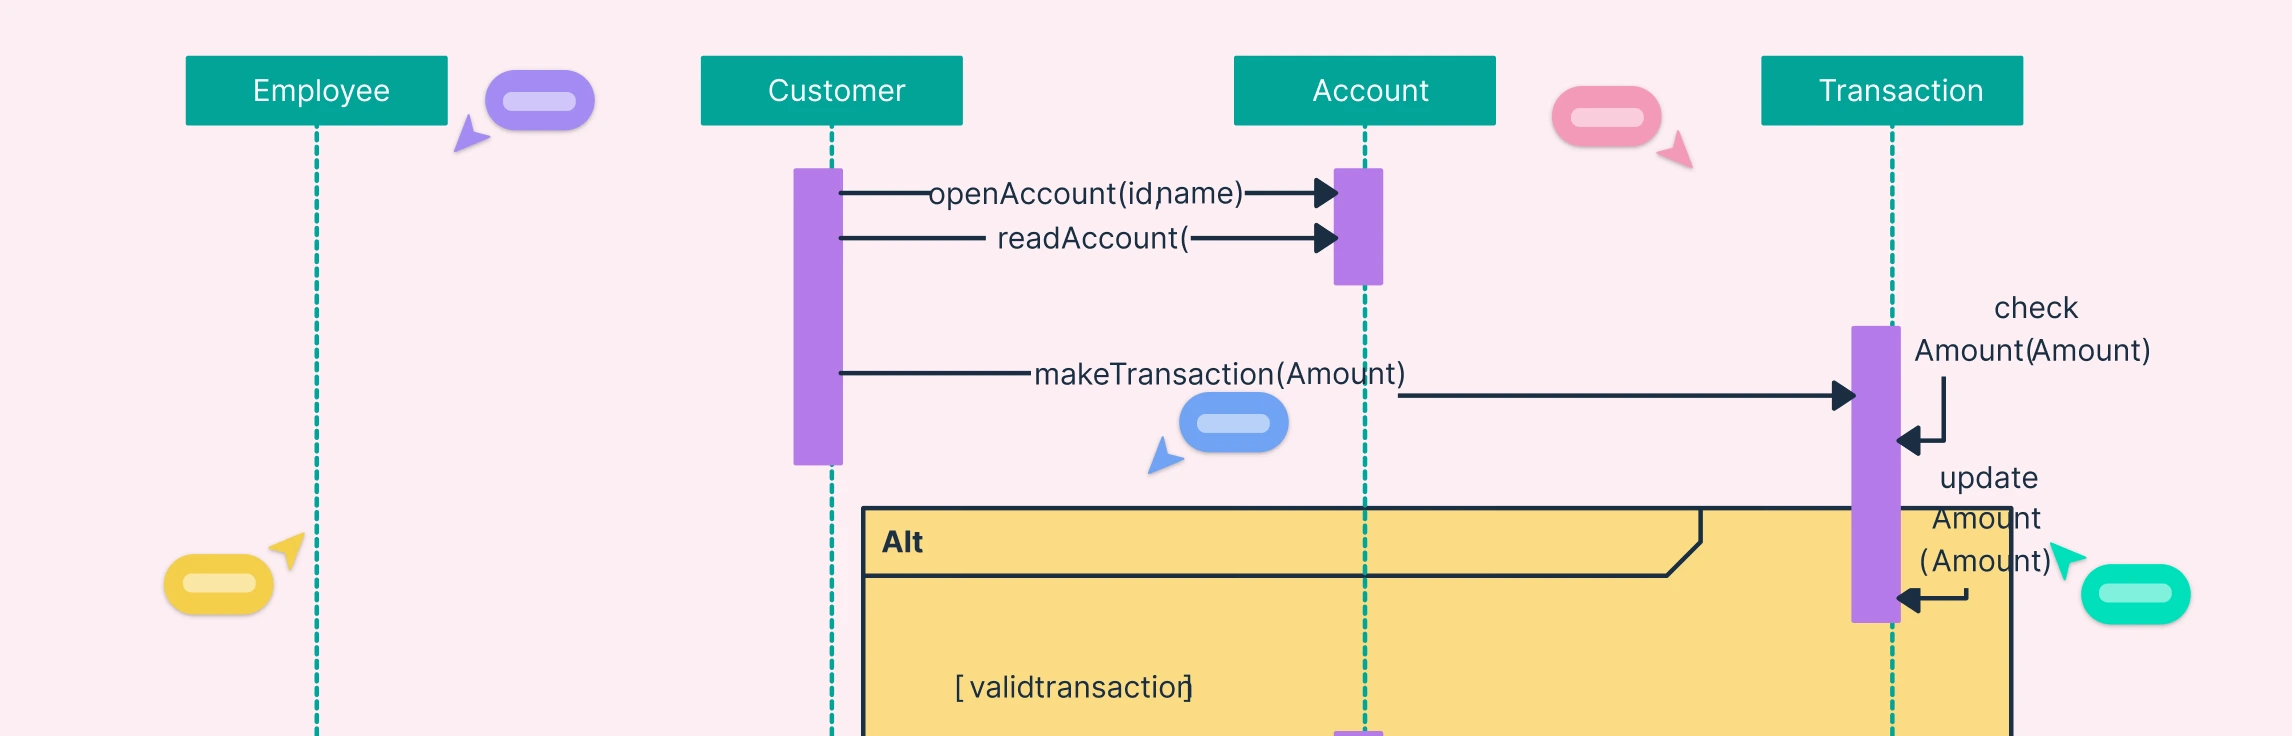
Sequence Diagrams: Combine sequence diagrams with deployment diagrams to display how messages and data flow between objects on different nodes, illustrating communication patterns in distributed systems.
Component Diagrams: Relate deployment diagrams to component diagrams to show where each software component is physically deployed, ensuring alignment between logical design and actual setup.
Activity Diagrams: Integrate with activity diagrams to represent how system activities or workflows are executed across multiple nodes, highlighting resource usage and operational flow.
Challenges of Using Deployment Diagrams
While UML deployment diagrams are highly useful for visualizing system architecture, they also come with a few challenges and limitations that teams should be aware of:
Complexity in Large Systems: In large or distributed systems with many nodes and components, deployment diagrams can become cluttered and difficult to interpret. Managing this visual complexity requires careful structuring and simplification.
Need for UML Proficiency: Creating and interpreting deployment diagrams effectively requires a solid understanding of UML notation. Team members unfamiliar with these conventions may struggle to read or contribute accurately.
Maintenance Effort: As systems evolve, keeping deployment diagrams up to date can be time-consuming. Frequent updates are necessary to ensure the diagram reflects the current architecture.
Limited Representation of Dynamic Behavior: Deployment diagrams focus on static architecture and do not capture real-time behavior, performance changes, or runtime interactions.
Collaboration Challenges: Building an accurate deployment diagram often requires input from multiple teams like developers, DevOps, network engineers, and architects. This can make alignment and version control difficult.
Free Deployment Diagram Templates to Get Started


FAQs about Deployment Diagrams
Who uses deployment diagrams?
Can UML deployment diagrams show software dependencies?
How is a deployment diagram different from a component diagram?
Are UML deployment diagrams only for large systems?
Resources
Gartziandia, Aitor. “Microservice-Based Performance Problem Detection in Cyber-Physical System Software Updates.” 2021 IEEE/ACM 43rd International Conference on Software Engineering: Companion Proceedings (ICSE-Companion), May 2021, pp. 147–149, https://doi.org/10.1109/icse-companion52605.2021.00062.
Accessed 7 Oct. 2025.Mohammadi, Reza Gorgan, and Ahmad Abdollahzadeh Barforoush. “Enforcing Component Dependency in UML Deployment Diagram for Cloud Applications.” 7’Th International Symposium on Telecommunications (IST’2014), Sept. 2014, https://doi.org/10.1109/istel.2014.7000739.