Managing a project can be overwhelming, especially when tracking all the tasks and their order. An arrow diagram is a simple visual tool that maps out activities, shows how tasks connect, and highlights which steps come first. It helps teams stay organized, plan efficiently, and keep projects on track. In this guide, we’ll explore what arrow diagrams are, how they work, and how to use them to make project planning easier and more effective.
What Is an Arrow Diagram (ADM)
An arrow diagram is a visual tool used in project planning to show the order of tasks and how they connect. Each arrow stands for an activity, while circles or nodes mark the start or end of that activity. The arrows point in the direction the work flows, making it easy to see what needs to happen first and what comes next. One of its biggest strengths is helping identify the critical path—the sequence of tasks that determines how long the project will take. This way, you can spot potential delays, organize resources better, and keep everything on track. Sometimes, dotted arrows are also used to show dependencies that don’t represent real tasks but help clarify the flow of the project.
Components of an Arrow Diagram

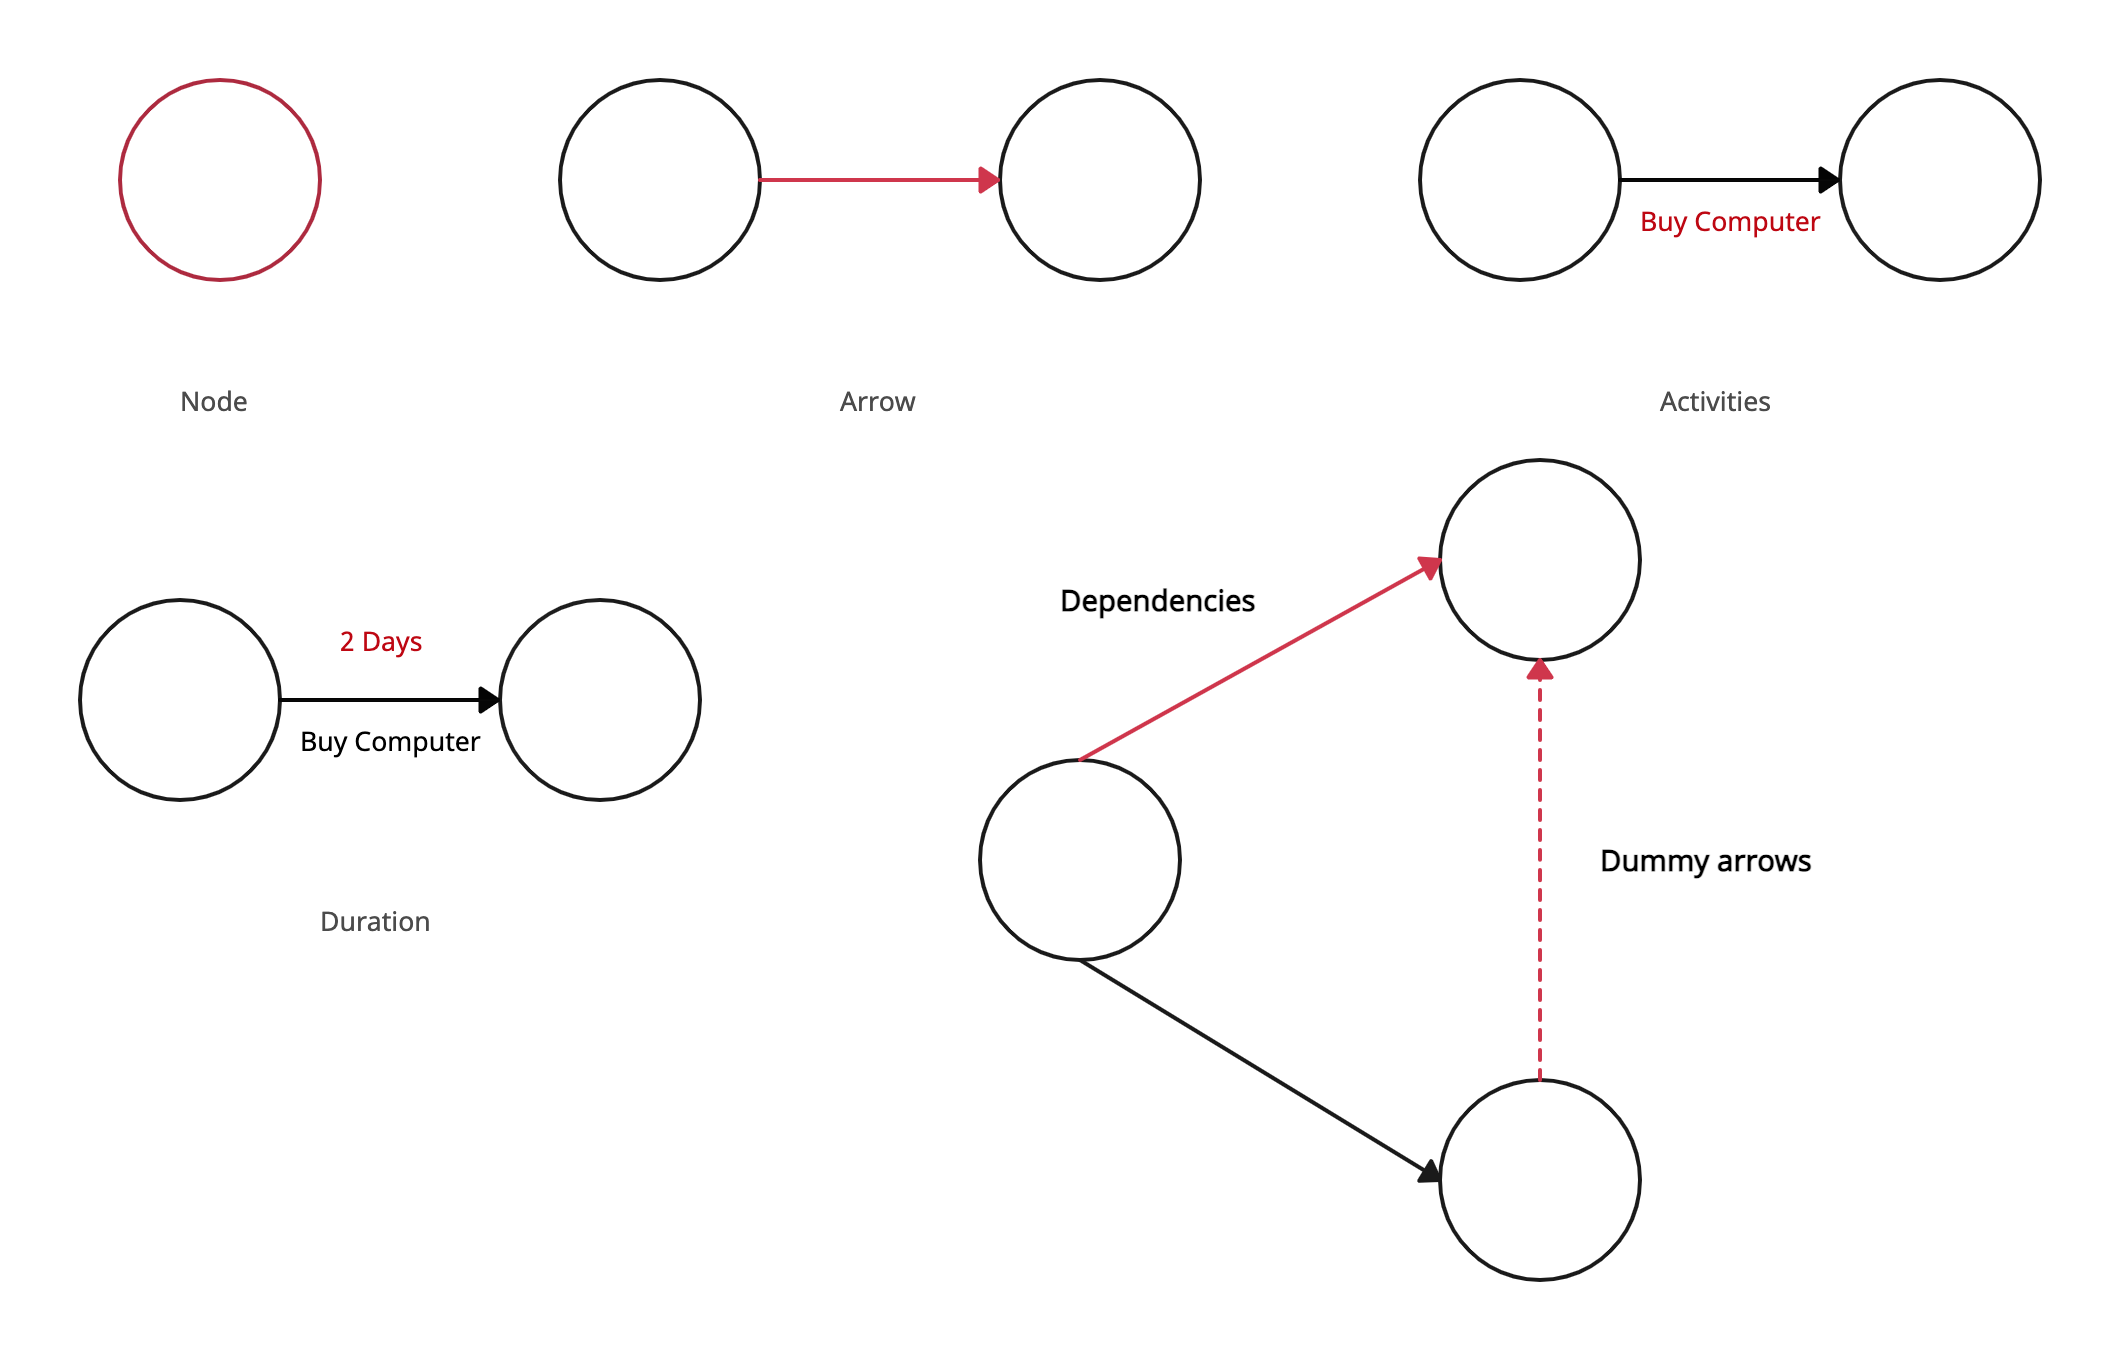
Nodes (or circles): These represent events or milestones in a project, like the starting point or the completion of a task. They mark key moments where activities begin or end.
Arrows: Each arrow shows an activity or task that needs to be done. The direction of the arrow indicates the order of work, pointing from the start node to the end node.
Activities: Activities are the actual tasks represented by the arrows. Each activity usually has a name or label that describes the work to be done.
Duration: Every activity has a time estimate showing how long it will take to complete. These durations help in calculating the overall project timeline.
Dependencies: These are the relationships between activities. They show which tasks must be finished before others can start, making it clear how the work flows.
Dummy arrows (if needed): Sometimes dotted arrows are used to show dependencies that don’t represent real tasks but are necessary to keep the sequence accurate.
The Different Types of Arrow Diagrams
Arrow diagrams can be drawn in a couple of different ways, depending on how you want to represent activities and their relationships. The two main types are:
1. Activity-on-Arrow (AOA)
In this type, each activity is shown as an arrow. The circles, or nodes, represent the start or end of these activities. The arrows connect the nodes in the order the tasks need to happen. Sometimes, dummy arrows (dotted lines) are added to show tricky dependencies without creating extra tasks.
2. Activity-on-Node (AON)
Here, the activities are shown as boxes or nodes instead of arrows. The arrows then represent the connections or dependencies between tasks. This method is often easier to read for complex projects because the focus is on the activities themselves.
Both types serve the same purpose—showing the flow of tasks and their dependencies—but the way they’re drawn makes them useful in slightly different situations. AOA is more traditional and often used in critical path analysis, while AON is popular in modern project management tools because of its clarity.
When to Use the Arrow Diagramming Method
The arrow diagramming method is most useful when you need to carefully plan and organize a project that has many steps and dependencies. It’s a great choice when:
Tasks depend on each other – If some tasks can’t start until others are finished, an arrow diagram helps you map out that sequence clearly.
You want to find the critical path – It’s perfect for identifying which tasks are most important to keep on schedule, so the whole project isn’t delayed.
The project is complex – For projects with lots of interconnected activities, the diagram makes it easier to see the big picture and avoid confusion.
You need better resource planning – By showing the order of tasks, it helps in assigning people, equipment, or materials at the right time.
You want to predict delays – The diagram makes it easier to spot possible bottlenecks and adjust the plan before problems arise.
Advantages and Disadvantages of Arrow Diagrams
| Advantages | Disadvantages |
| Helps visualize project tasks, dependencies, and flow clearly | Can become complex and difficult to read for very large projects |
| Identifies the critical path and highlights tasks that directly impact project timelines | Requires accurate time estimates for each task to be effective |
| Supports better resource allocation and scheduling | Updating the diagram frequently can be time-consuming |
| Improves team communication by providing a shared visual reference | Not as flexible for adaptive or agile workflows compared to other tools |
| Useful for spotting bottlenecks and potential delays early | May oversimplify real-world project complexities if not detailed enough |
Arrow Diagram Examples
Now that you know what is an arrow diagram, here are some templates to get started on creating yours.
Activity on Arrow Diagram
Arrow Diagram Template
PERT Chart Template
Project PERT Chart Template
PERT Chart for Project Planning
AON Diagram
References
www.sciencedirect.com. (n.d.). Arrow Diagram - an overview | ScienceDirect Topics. [online] Available at: https://www.sciencedirect.com/topics/engineering/arrow-diagram.
Kurata, Y. and Egenhofer, M.J. (2005). Structure and Semantics of Arrow Diagrams. Lecture notes in computer science, pp.232–250. doi:https://link.springer.com/chapter/10.1007/11556114_15.
FAQs About Arrow Diagramming Method
Why are arrow diagrams important?
What is an arrow diagram in project management?
What is the best tool for creating an arrow diagram?
How does the arrow diagramming method handle parallel tasks?
What’s the difference between Activity-on-Arrow (AOA) and Activity-on-Node (AON)?


