Understanding the relationships among actors within a system is fundamental to systems thinking, and actor mapping offers a powerful way to visualize these complex connections. By creating an actor map, systems thinkers can identify influential players, examine their roles and interactions, and reveal the dynamics shaping outcomes within the system. This guide will introduce the essentials of actor mapping and its core elements. It will also provide guidance on building an effective map using various templates. We’ll also explore the benefits, limitations, and common pitfalls to avoid, equipping you with the tools to deepen your understanding of systemic interactions and enhance overall system performance.
What Is Actor Mapping?
An actor map is a strategic tool widely used in systems thinking to identify and visualize key actors and their relationships within a system, particularly in the context of social causes. By creating an actor map, change-makers gain a clear view of how individuals, organizations, and groups influence one another, as well as the broader dynamics within the social system. This visual overview helps in unraveling the complexities of interactions among diverse actors, ensuring that every important perspective is considered from the outset.
Actor mapping is especially valuable in social causes, where understanding connections and influence can illuminate pathways for positive change. It helps advocates streamline communication, recognize gaps in collaboration, and reduce duplication of services, ultimately enhancing the collective impact of all involved. By revealing roles, power dynamics, and potential influence, an actor map supports effective strategy development and a more cohesive approach to tackling complex social issues.


Components of an Actor Map
An actor map does more than list individuals or organizations within a system—it provides a detailed look into the relationships, roles, and influences that drive the system’s behavior. Breaking down these components allows systems thinkers to better understand the complexities within social causes and develop strategies for effective collaboration and positive change. Here are the core components of an actor map:
1. Actors and Roles
The first step in building an actor map is identifying the key actors and understanding the unique roles they play within the system. These actors may be individuals, groups, or organizations directly or indirectly involved in a social issue. Clearly defining roles helps pinpoint each actor’s contribution to the system, revealing who is responsible for shaping key decisions, allocating resources, or driving day-to-day activities. This identification is essential for understanding the specific influence each actor has on the broader social landscape.
2. Influence
Understanding each actor’s level of influence is essential for driving social change. Some actors may hold significant sway over decisions and outcomes, while others may be more affected by those decisions than able to shape them. Mapping influence levels allows change-makers to prioritize efforts around high-impact actors while ensuring that those most affected by the system are considered. This perspective also aids in anticipating possible obstacles and managing expectations in collaborative efforts.
3. Connections
A vital aspect of actor mapping is visualizing the interactions and relationships between different actors. These connections reveal critical communication channels, dependencies, and even potential conflicts within the system. By mapping out these relationships, teams can understand information flows, identify central connectors, and anticipate how interactions might impact outcomes. Recognizing these patterns within social networks is invaluable for fostering collaboration and effective advocacy.
An actor map provides a holistic perspective on the system by exploring how roles, influence, and relationships intersect and evolve. Tools like Creately offer powerful features for creating and customizing actor maps, making it easy to visualize and adapt actor connections for specific social causes. With features for data visualization and strategic mapping, Creately supports greater transparency and enhances collaborative efforts across networks working toward positive change.
For those looking to get started, tools like Creately offer excellent stakeholder analysis examples that visually represent these components in a clear and structured manner. Creately also supports features like visual strategy mapping and data visualization, making it easier to tailor an actor map to specific project needs. It enhances transparency within the organizational structure, fostering better collaboration and efficiency across the board.
Actor Mapping vs Stakeholder Mapping vs System Mapping Comparison
Actor mapping is often confused with stakeholder mapping and broader system mapping. They overlap, but they answer different questions. Use the quick comparison below to choose the right tool, and to combine them when you need a fuller picture.
| Comparison | Actor Mapping (Actor Map) | Stakeholder Mapping | System Mapping |
|---|---|---|---|
| Primary question | Who can act in the system, and how do roles, incentives, and power shape outcomes? | Who is affected or interested, and what do they need/expect? | How does the system work—structures, flows, feedback loops, bottlenecks? |
| Best for | Understanding agency, influence, and decision-making pathways | Engagement and comms planning; expectation/risk management | Diagnosing dynamics; finding leverage points and root causes |
| What you map | Actors/roles, incentives, power, relationships, dependencies, constraints, levers | Stakeholder groups, needs/concerns, support level, salience, engagement needs | Variables, relationships, feedback loops, stocks/flows, processes, structural constraints |
| Typical output | Actor map showing key actors/roles + influence lines + motivations/constraints | Stakeholder map (often grid) + engagement/communications plan | Causal loop / stock–flow / process or value-chain system map |
| When to use | Early discovery, coalition building, change strategy, policy/service design | Consultation, rollout planning, aligning stakeholders, managing expectations/risks | Root-cause analysis, diagnosing behaviors over time, identifying leverage points |
| Key difference | Focuses on action/power/role (who can change what) | Focuses on interest/impact (who cares / who is affected) | Focuses on dynamics/structure (why outcomes emerge) |
| Common mistake | Treating it as a contact list, not a power/incentive model | Assuming “high interest” equals “high power to act” | Stopping at the diagram without identifying who can intervene |
| Pairs well with | System mapping (map dynamics → map who can shift them) | Actor mapping (engage stakeholders → identify actors who can act) | Actor mapping (find leverage points → identify actors to pull them) |
How to Create an Effective Actor Map
Creating an effective actor map involves several key steps that help capture the complex relationships and influences within a system. This process goes beyond merely listing actors—it involves careful preparation, active facilitation, and ongoing revision to ensure the map remains relevant as the system evolves. Here’s a breakdown of each step to guide you in building a meaningful and dynamic actor map.
Step 1: Preparation
Creating an effective actor map starts with thorough preparation. This stage involves identifying all key actors within the system who have an influence—direct or indirect—on the issue at hand. Key actors might include individuals, organizations, or even subsystems that contribute to or are impacted by systemic outcomes. To achieve a comprehensive view, leverage both explicit data sources, like organizational charts, and implicit knowledge from team members and community partners. This balanced approach ensures a precise representation of the system’s landscape and reduces the risk of overlooking critical actors.
Step 2: Facilitation
Facilitation is a critical stage where actor mapping comes to life through dialogue and collaboration with the identified actors. Host sessions where participants can share insights about their roles and interactions within the system. Visual collaboration platforms, such as Creately, offer tools like strategy mapping software and online whiteboards to help teams populate and refine the map in real-time. These discussions provide a deeper understanding of actor dynamics, uncovering hidden connections and potential areas for meaningful collaboration.
Step 3: Revision
The final stage of creating an actor map is revision, an ongoing process that keeps the map relevant as the system and external context evolve. Regular updates ensure the map accurately reflects the current landscape and effectively supports decision-making. Using platforms like Creately simplifies refinements, allowing easy edits to capture changes in relationships or roles over time, ensuring that the actor map remains a valuable, up-to-date tool for systems thinking and impact assessment.

Benefits and Drawbacks of the Actor Map
| Benefits of the Actor Map (what you gain and why it matters) | Drawbacks of Actor Maps (what can go wrong and what it costs) |
|---|---|
| Clearer shared understanding: Makes roles, relationships, and influence visible so teams align faster on “who matters” and “how things move.” | Scale complexity: In large systems, mapping every actor and connection can create a dense, hard-to-read map that reduces clarity. |
| Better collaboration + engagement: Surfaces who to involve, where partnerships are possible, and where coordination is weak—improving communication and alignment on shared goals. | Facilitation burden: Without strong facilitation and a clear structure, the mapping session can sprawl, producing a diagram that’s not actionable. |
| Stronger decision-making: Reveals influence pathways, dependencies, and potential friction points, helping teams anticipate obstacles before they show up in execution. | Incompleteness risk: If you miss key actors or relationships during research/workshops, the map can misrepresent the system and misguide strategy. |
| More efficient planning + resourcing: Helps reduce duplication of effort, identify overlaps in roles/responsibilities, and prioritize where to spend time, funding, and energy. | Maintenance requirement: Actor dynamics change (roles, incentives, power). If you don’t revisit the map, it quickly becomes outdated and misleading. |
| Systems-thinking leverage: Complements system mapping by connecting “how the system behaves” to “who can shift it,” making change efforts more practical and implementable. | Over-detail temptation: Trying to capture every relationship can overwhelm users; the map becomes a documentation artifact instead of a decision tool. |
Templates for Actor Mapping
Visual tools can greatly enhance the actor map creation process by organizing relationships, roles, and influence in a clear and structured way. Using the right templates—such as the Stakeholder Matrix, Venn Diagram, and others—can reveal connections, highlight influence, and clarify each actor’s role within the system. Each diagram type serves a distinct purpose, supporting strategic management of roles, responsibilities, and power dynamics to improve collaboration and drive impactful outcomes.
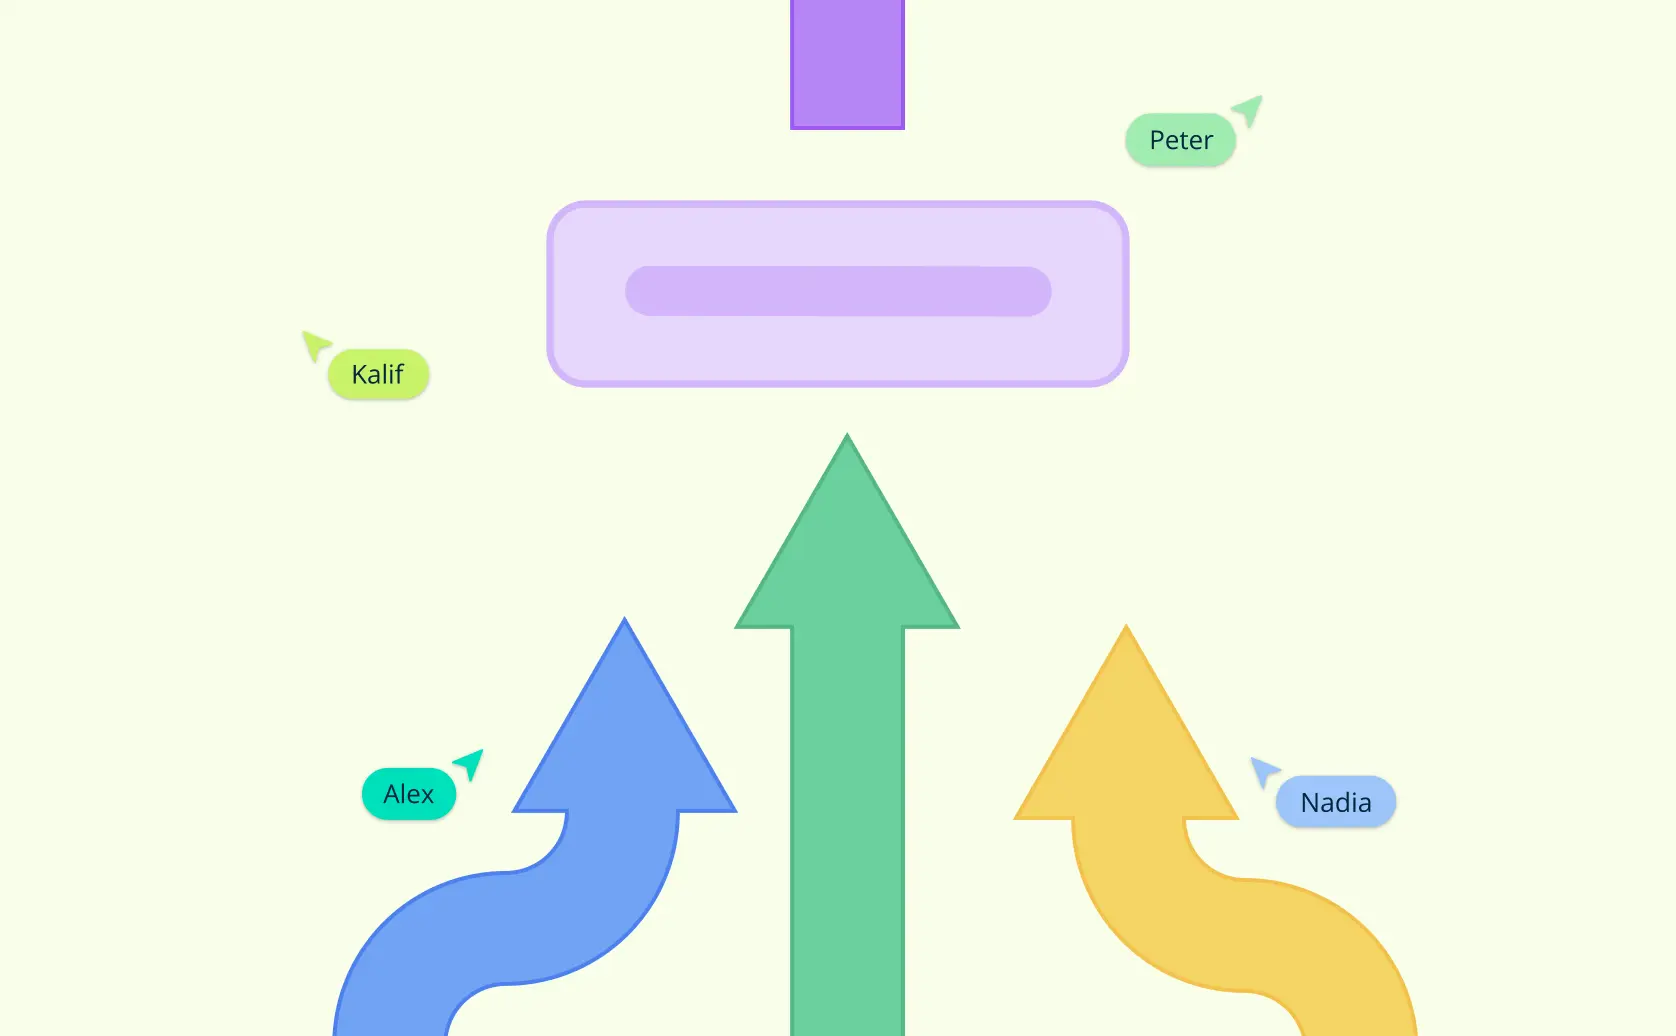
1. Stakeholder Matrix
In systems thinking, the Stakeholder Matrix (or Stakeholder Engagement Assessment Matrix) helps identify and categorize key actors based on their engagement within a social cause or initiative. This tool provides a structured way to understand how various individuals, organizations, or groups interact with and impact the system. By listing stakeholders in rows and engagement levels in columns—such as Unaware, Resistant, Neutral, Supportive, and Leading—teams can gain insight into each actor’s stance and influence, allowing for a strategic approach to fostering change.
Each engagement level highlights the role of actors within the system:
- Unaware: Actors who are not yet informed about the initiative or its potential impact on the system.
- Resistant: Those who may oppose the initiative, presenting viewpoints or actions that challenge systemic change.
- Neutral: Individuals or groups with no strong position, yet whose involvement could shape the outcome.
- Supportive: Actors in favor of the initiative and open to collaborative efforts to support the cause.
- Leading: Those who are actively involved, advocating for the initiative’s success, and driving systemic change.
Using the Stakeholder Matrix in social causes allows organizations to identify leverage points, build connections, and engage actors based on their roles and perspectives, ultimately strengthening the system’s response to change and aligning efforts toward impactful outcomes.

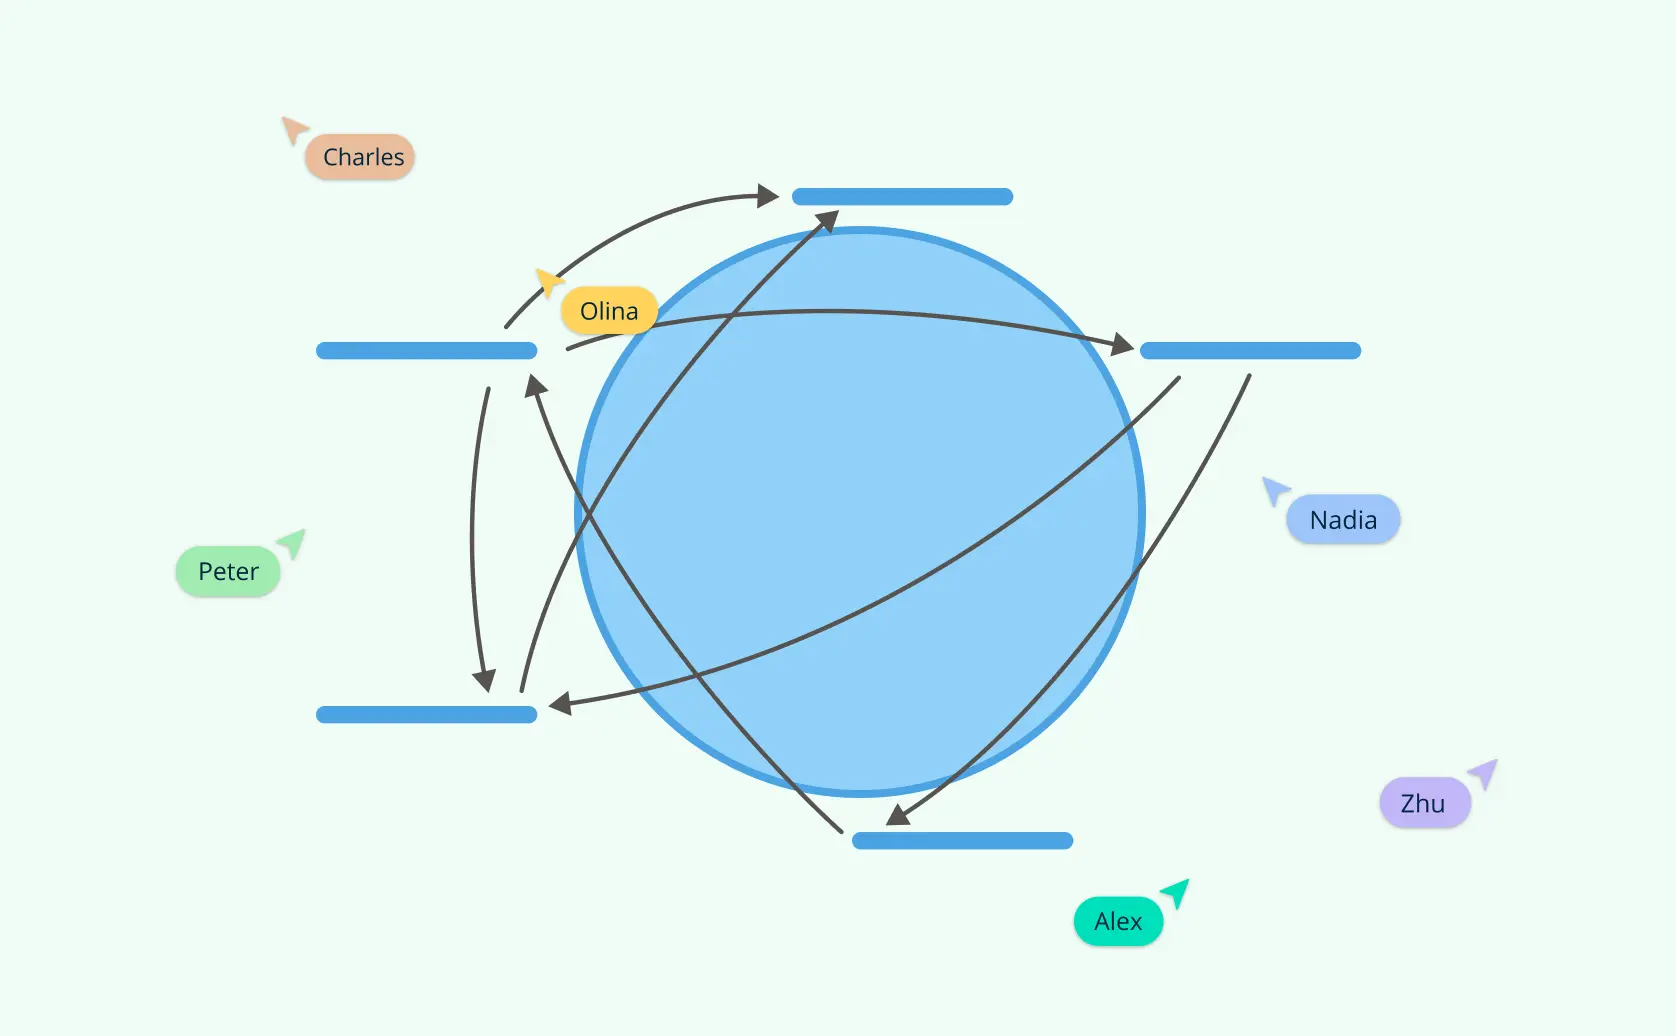
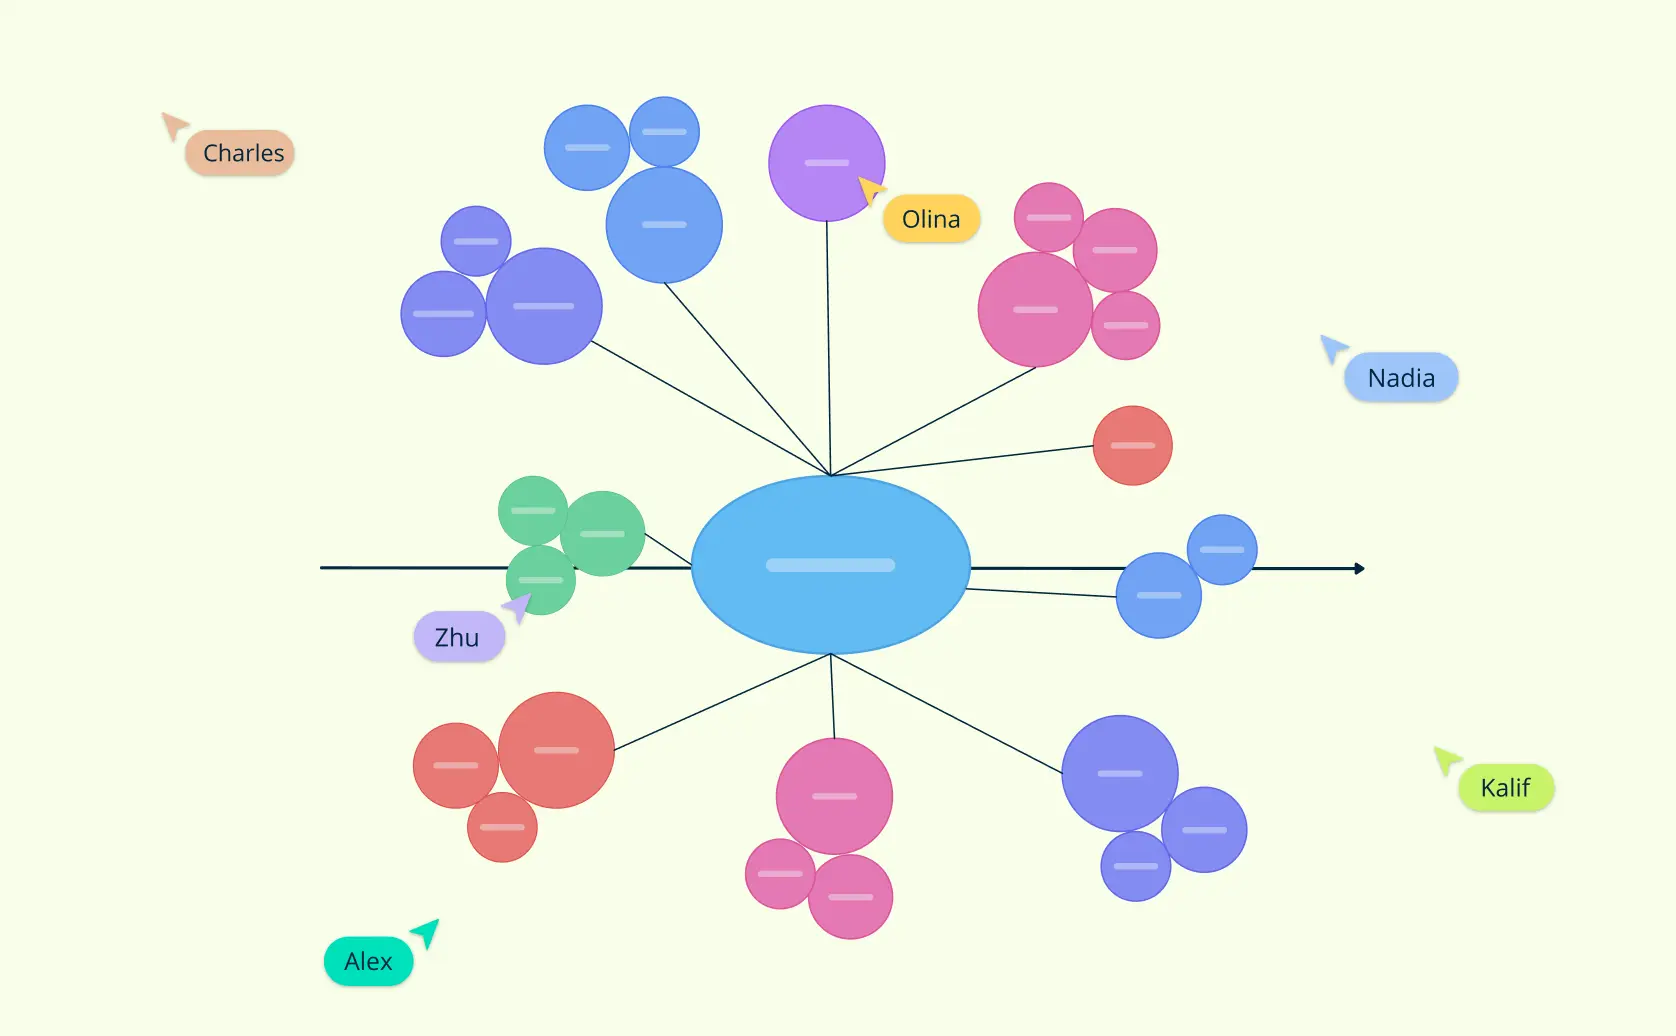
2. Social Network Diagram
A Social Network Diagram maps the relationships and interactions between various actors within a system, particularly useful in understanding the social dynamics driving change in social causes. Each actor is represented as a node, and the connecting lines, or edges, show the nature of their interactions—such as communication, influence, or collaboration.
In the context of actor mapping, Social Network Diagrams provide a powerful visualization of the stakeholder network, uncovering key influencers, communication flows, and potential bottlenecks. This insight enables teams to recognize essential connectors, strengthen collaboration, and address gaps that might hinder systemic progress. By understanding these relationships, teams can mobilize support effectively, enhancing engagement and accelerating meaningful change across the system.

3. RACI Chart (Responsibility Assignment Matrix)
The RACI Matrix, or Responsibility Assignment Matrix, defines specific roles for each task or decision within a system or project, supporting transparency and coordination—especially within social initiatives that require clear collaboration among multiple actors. In the RACI Matrix, tasks are listed in rows, while columns represent different stakeholders or groups involved in the project. For each task, a role is assigned to clarify involvement:
- R (Responsible): The person or group tasked with completing the activity.
- A (Accountable): The individual ultimately answerable for the task’s success and outcome.
- C (Consulted): Stakeholders who provide input or expertise.
- I (Informed): Parties kept up-to-date on progress and outcomes.
In actor mapping, the RACI Chart is invaluable for clarifying roles and responsibilities, ensuring everyone understands their part in the system. This structured approach minimizes overlap, avoids confusion, and enhances coordination, making it easier to mobilize efforts in social causes and align contributions towards shared goals.

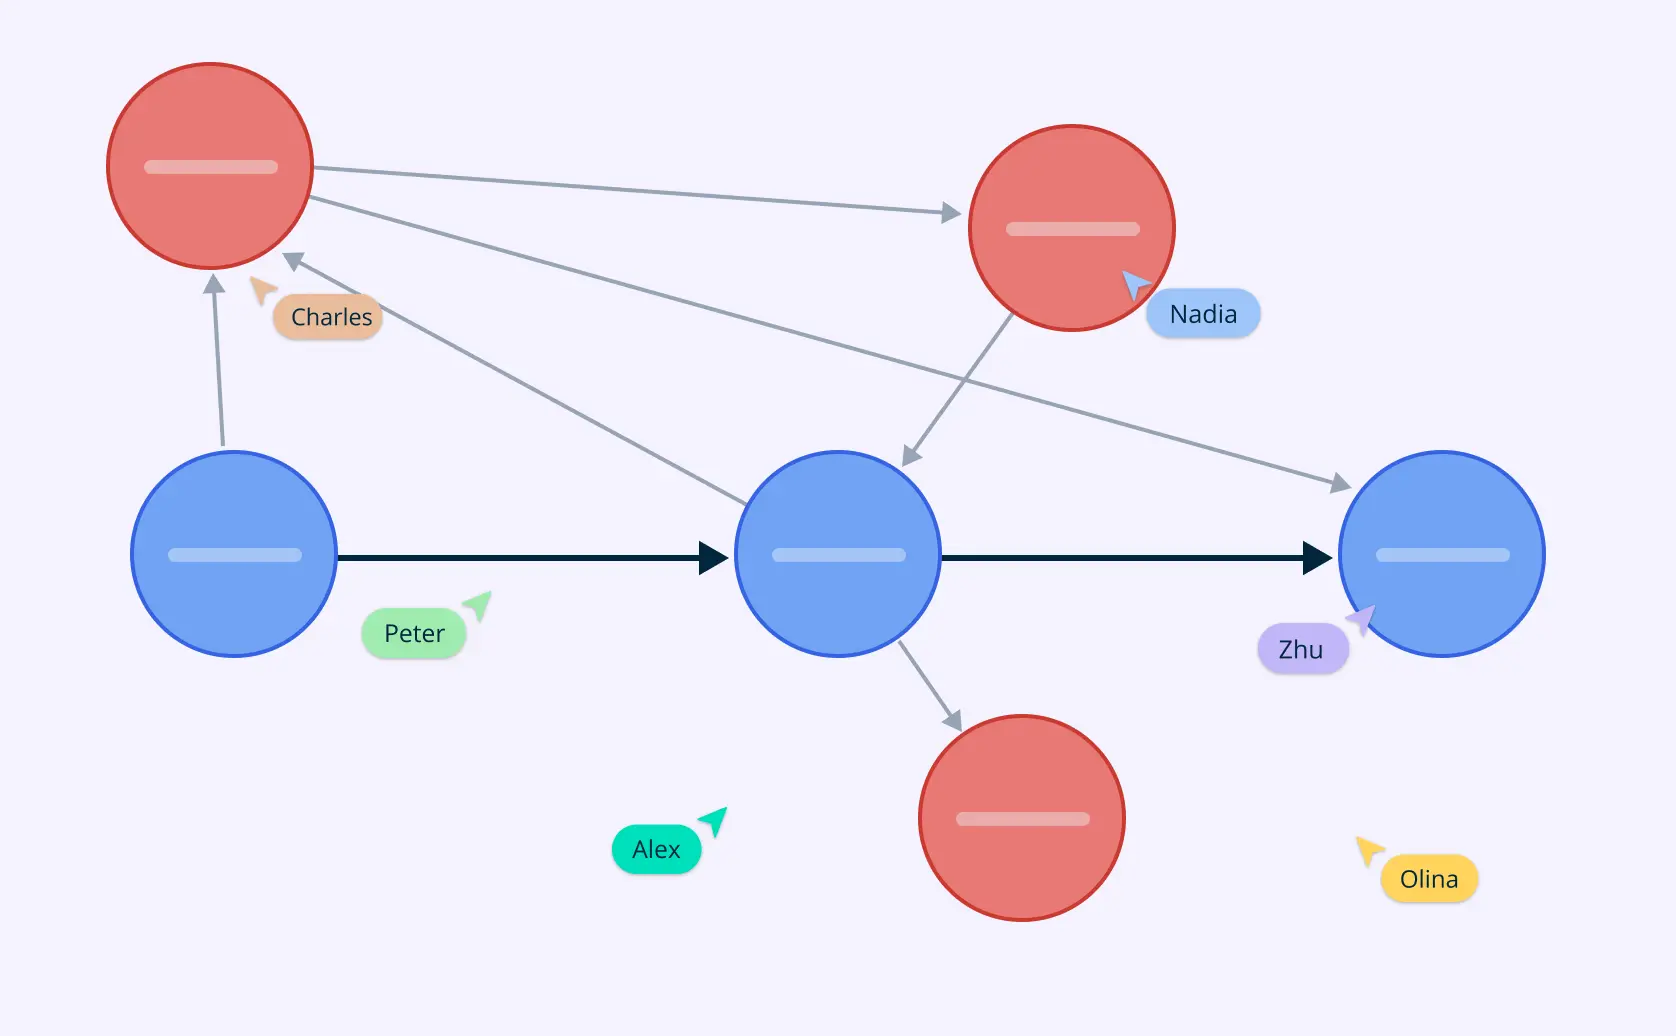
4. Power-Influence Map
A Power-Influence Map is a critical tool in systems thinking that visualizes the varying levels of influence each actor has within a social system. By positioning stakeholders based on their power and impact, this map helps clarify the dynamics that shape decision-making and resource allocation. Actors with higher power and influence are placed centrally, while those with less influence are located on the periphery.
Stakeholders are categorized into four quadrants:
- High Power, High Influence: Engage closely and actively manage these key decision-makers, as their support is vital for the success of the initiative.
- High Power, Low Influence: Keep these actors satisfied, as they can provide valuable resources or support without being directly involved in day-to-day decisions.
- Low Power, High Influence: Keep these stakeholders informed, as their opinions can sway the perceptions of others, even if they lack formal authority.
- Low Power, Low Influence: Monitor these actors with minimal effort, acknowledging their presence but recognizing their limited impact on the system.
In the context of an actor map for social causes, the Power-Influence Map allows teams to identify and prioritize engagement strategies based on each actor’s role within the broader network. By understanding power dynamics, organizations can focus their efforts on influencing the right actors, ensuring that initiatives are supported and sustained by those with the greatest capacity to effect change. This strategic alignment is crucial for fostering collaboration and driving systemic improvements in social issues.

5. Venn Diagram
A Venn Diagram is a powerful visualization tool that employs overlapping circles to illustrate the commonalities and differences among various actors or stakeholder groups within a system. Each circle or set represents a stakeholder or group, and the overlapping areas highlight shared roles, responsibilities, or interests.
In the context of actor mapping for social causes, Venn Diagrams are particularly useful for identifying potential areas of collaboration and conflict among stakeholders. By visually representing where stakeholders’ goals align or diverge, teams can better understand the dynamics at play. This insight is crucial for fostering teamwork, enhancing communication, and managing conflicts effectively.
Utilizing Venn Diagrams allows organizations to strategically engage with stakeholders, focusing on common objectives while addressing any discrepancies. This holistic view of relationships contributes to more effective collaboration, ensuring that efforts toward social change are coordinated and impactful. By clarifying shared interests, Venn Diagrams facilitate dialogue and collaboration among diverse actors, ultimately driving progress in complex social initiatives.

Helpful Resources
Use mind map online to visualize ideas and concepts for collaborative brainstorming, creative thinking, problem-solving, and so much more.
Visualize Strategies and Their Dynamics with a Stragey Map Online
Clarify complex ideas and concepts with Creately's Concept Diagram templates. Visualize and organize thoughts with professional Concept Diagrams. Simplify brainstorming and ideation with Creately's easy-to-edit Concept Diagrams.
Master the technique of using stakeholder maps effectively to visualize the influence and interests of different stakeholders
Avoiding Common Mistakes
When creating an actor map, it’s essential to recognize and address common pitfalls that can hinder its effectiveness in supporting social causes. By being mindful of these mistakes, organizations can enhance the clarity and utility of their actor maps as valuable decision-making tools.
1. Overlooking Key Stakeholders
One frequent mistake is failing to identify all relevant stakeholders. This often happens due to inadequate research or focusing only on obvious actors. Overlooking important yet less visible stakeholders—such as community groups or indirect influencers—can lead to a shallow understanding of the system. To avoid this, conduct a comprehensive stakeholder analysis that includes both primary and secondary actors, leveraging diverse data sources for a more inclusive perspective.
2. Inadequate Data Gathering
An effective actor map relies on comprehensive data. Relying solely on surface-level information can result in an incomplete picture of relationships and roles. It’s crucial to blend explicit data—like reports and structured surveys—with implicit knowledge from discussions and workshops. This combination captures the full spectrum of stakeholders’ roles, influences, and interconnections.
3. Overemphasis on Hierarchies
Focusing too much on formal hierarchies can obscure the reality of influence and power dynamics within a system. While organizational charts depict official lines of authority, they often fail to highlight informal influence. Recognize that stakeholders outside of leadership positions can possess significant power or insights. Ensure your actor map reflects these informal dynamics to provide a more accurate representation of relationships.
4. Neglecting Stakeholder Engagement Levels
Failing to account for varying levels of stakeholder engagement limits the map’s utility. Different stakeholders may have differing levels of interest and involvement in the project, ranging from passive observers to active leaders. Assess engagement levels to prioritize interactions effectively. Tools like the Stakeholder Engagement Assessment Matrix can complement your actor mapping efforts.
5. Ignoring Evolving Dynamics
An actor map is not a static document. Stakeholder roles and influences can shift due to changes in the project context or internal dynamics. Treat the actor map as a living document by scheduling regular reviews and updates to ensure it remains relevant and accurate.
6. Lack of Collaboration in Creation
Creating an actor map in isolation can lead to biases and omissions. Involve diverse team members and stakeholders in the mapping process to gain varied perspectives, ensuring a more holistic representation of the stakeholder landscape.
7. Overcomplicating the Map
While an actor map is designed to convey complex relationships, overloading them with excessive detail can lead to confusion. Focus on the most relevant actors and key relationships, ensuring the map remains clear and actionable for decision-makers.
FAQs about the Actor Map
How does an actor map work?
What are the benefits of using an actor map?
When should you use an actor map in social initiatives?
Can an actor map help with conflict resolution in social causes?
Resources:
—. A Framework for Mapping Actor Roles and Their Innovation Potential in Digital Ecosystems. Vol. 125, 1 July 2023, pp. 102783–102783, www.doi.org/10.1016/j.technovation.2023.102783.
—. System Mapping: A Guide to Developing Actor Maps.
Sova, Chase A., et al. “Multi-Level Stakeholder Influence Mapping: Visualizing Power Relations across Actor Levels in Nepal’s Agricultural Climate Change Adaptation Regime.” Systemic Practice and Action Research, vol. 28, no. 4, 17 Oct. 2014, pp. 383–409, www.doi.org/10.1007/s11213-014-9335-y.