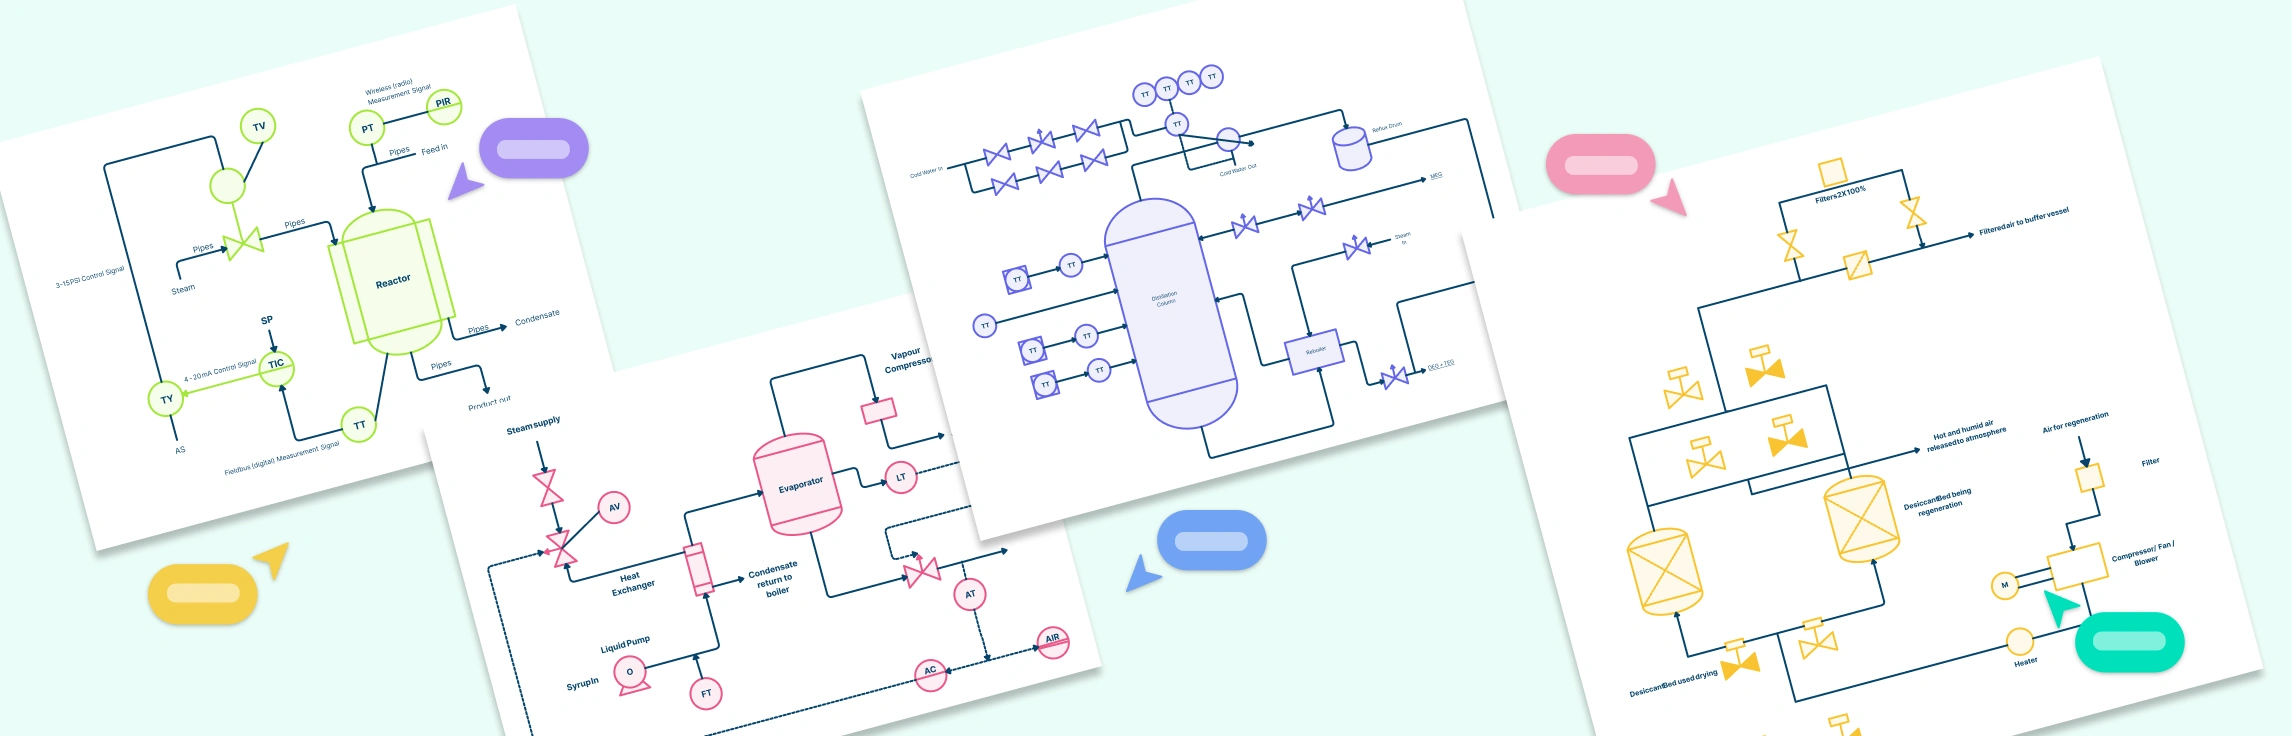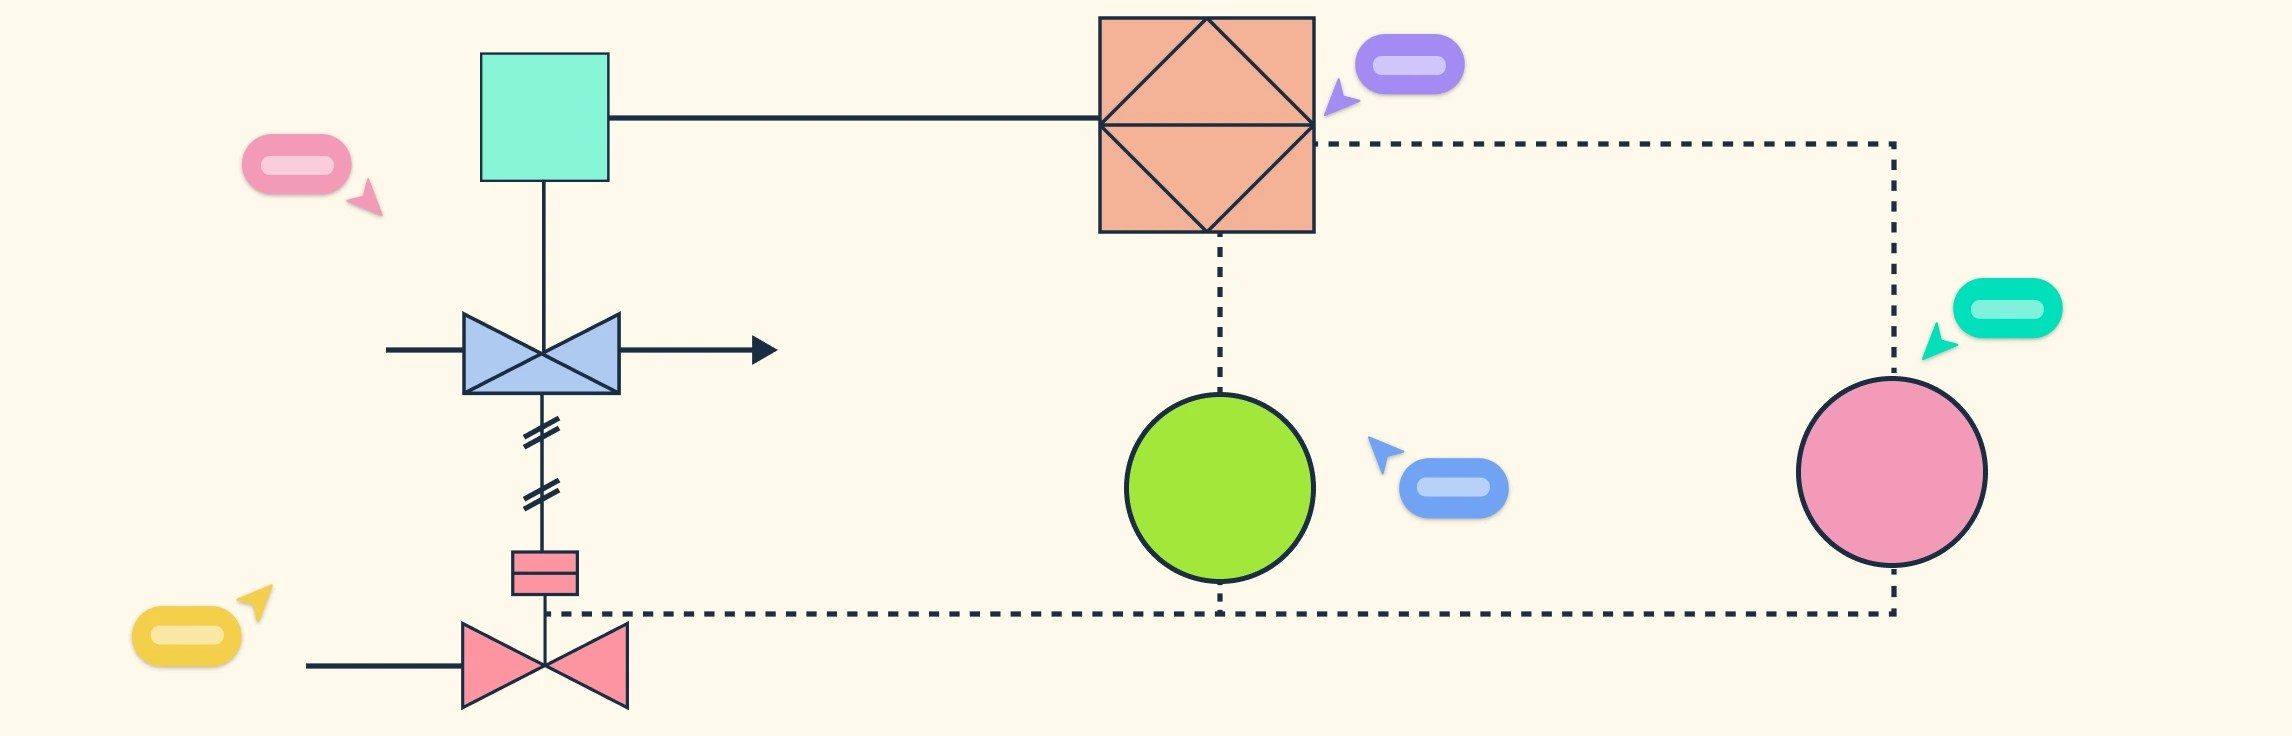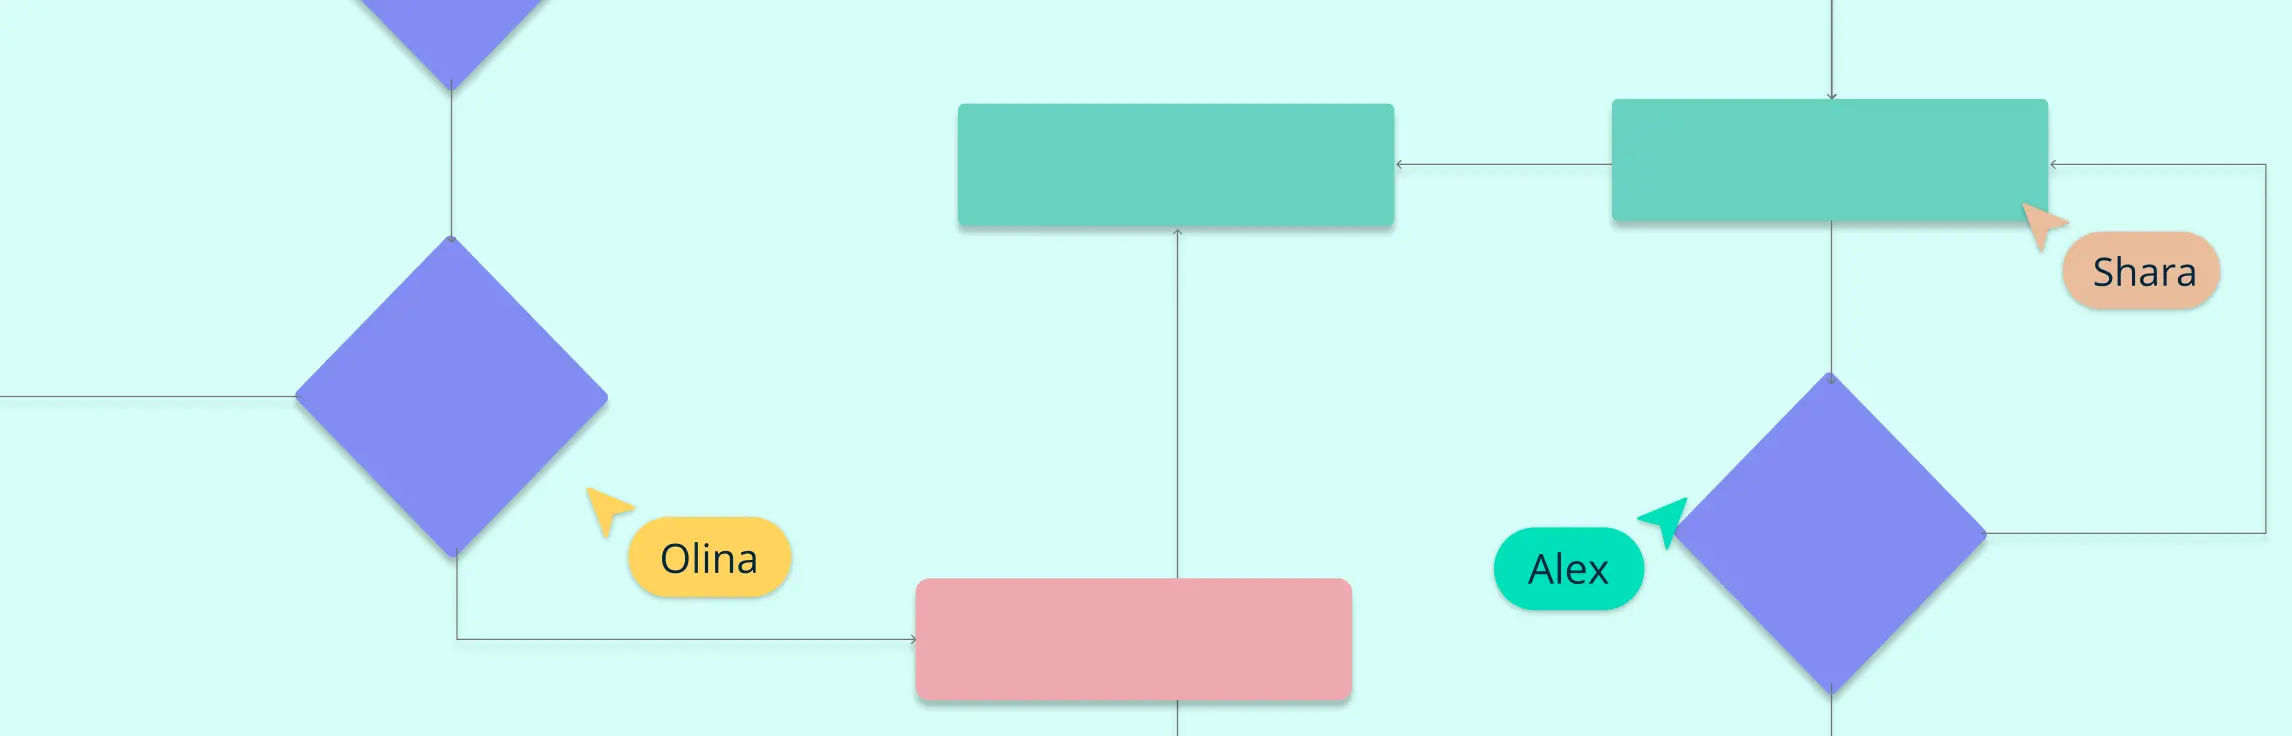
A system flowchart is a simple but powerful way to visualize how a process works. It breaks down complex systems into easy-to-follow steps using standard symbols and logical connections. Whether you’re designing a business workflow, developing software, or improving efficiency in an organization, a system flowchart helps you see the bigger picture.
In this guide, you’ll learn what a system flowchart is, how to create one, common symbols used, and best practices. You’ll also discover where system flowcharts are most useful and how they can help different industries work smarter. By the end, you’ll have a clear understanding of how to create and use system flowcharts effectively.
What Is a System Flowchart?
A system flowchart is a visual representation of how data moves through a system, showing the steps, decisions, and outcomes involved in a process. It helps to break down complex systems into clear, easy-to-follow diagrams, making it easier to understand, analyze, and improve them.
Think of a system flowchart as a roadmap that shows how information flows from one point to another—whether in a business, a computer system, or a manufacturing process. System flowchart is one of the widely known types of flowcharts that is used to illustrate the connections between different parts of a system, including inputs (such as user actions or data entry), processes (where the system does something with the data), and outputs (such as a report, an approval, or a completed action).
Unlike general flowcharts that focus on basic step-by-step tasks, system flowcharts go deeper, often showing:
- How data is processed and stored (e.g., files, databases)
- How different components interact (e.g., user inputs, software operations, external devices)
- The logical flow of information within an entire system
System Flowchart Symbols
System flowcharts use specific symbols to represent different steps in a process. These symbols help break down complex systems into an easy-to-understand visual format. Here are the most commonly used ones:
- Start and end symbol (Oval) – Represents the beginning or end of a system process.
- Process symbol (Rectangle) – Shows an action or step where something happens in the system.
- Input/output symbol (Parallelogram) – Represents data entering or leaving the system, such as user input or displayed results.
- Decision symbol (Diamond) – Indicates a decision point where the process splits based on Yes/No or True/False conditions.
- Connector symbol (Circle or Arrow) – Connects different parts of the system flowchart to maintain a clear and organized flow.
How to Create a System Flowchart
Creating a system flowchart might seem technical, but it’s simply about mapping out how a system works in a clear, visual way. Follow these steps to build one:
Step 1. Define the system process
Start by asking: What process do you want to map? It could be anything from how a company processes orders to how a banking system handles transactions. Clearly defining the process will help you decide what details to include in your system flowchart.
For example, if you’re mapping an online payment system, the process could be:
- A customer enters payment details
- The system verifies the information
- The payment is processed
- A confirmation email is sent
Step 2. Identify inputs and outputs
Inputs are what goes into the system, while outputs are the results produced. Think of them as the starting and ending points of the flowchart.
For an online payment system:
- Inputs: Payment details, customer information
- Outputs: Payment confirmation, receipt email
Clearly identifying these elements helps ensure your system flowchart accurately reflects how data moves through the system.
Step 3. Choose appropriate symbols
System flowcharts use specific symbols to represent different steps. Some key ones include:
- Oval – Start or end of a process
- Rectangle – A process or action step
- Diamond – A decision point (Yes/No, Approved/Rejected)
- Parallelogram – Inputs and outputs (e.g., user input, report generated)
Choosing the right symbols keeps your system flowchart clear and easy to follow.
Step 4. Connect components logically
Now, start linking everything together using arrows to show the flow of information. The connections should be logical and follow the natural order of steps in the process.
For instance, in an order processing system, the arrows might flow like this:
- Customer places an order (input)
- System checks inventory (decision)
- If in stock → Process payment
- If out of stock → Notify customer
- Order is confirmed (output)
Each step should flow naturally to the next without confusion.
Step 5. Review and refine the flowchart
Once your flowchart is complete, take a step back and review it:
- Is the process easy to follow?
- Are the symbols used correctly?
- Are there any missing or unnecessary steps?
Ask someone unfamiliar with the system to look at it. If they can understand it easily, your system flowchart is on the right track!
System Flowchart Templates
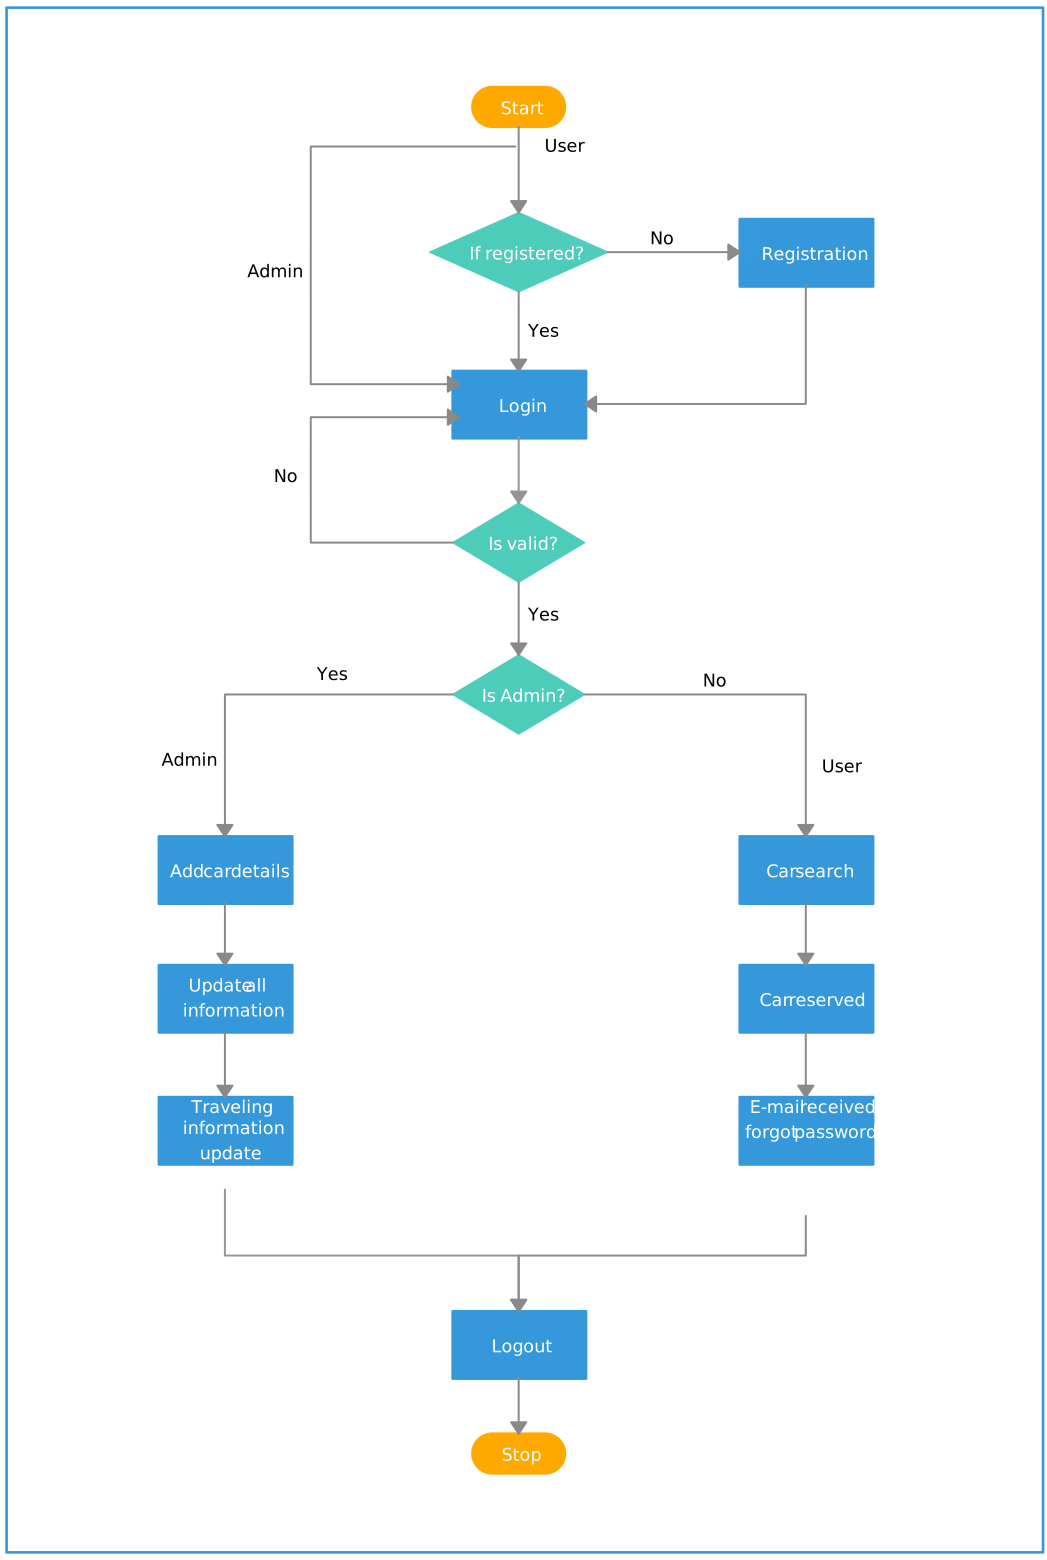
Here are system flowchart templates you can use to easily create clear and consistent flowcharts for your processes. These ready-made layouts with standard symbols help visualize workflows and system interactions efficiently.
Car Rental System Flowchart

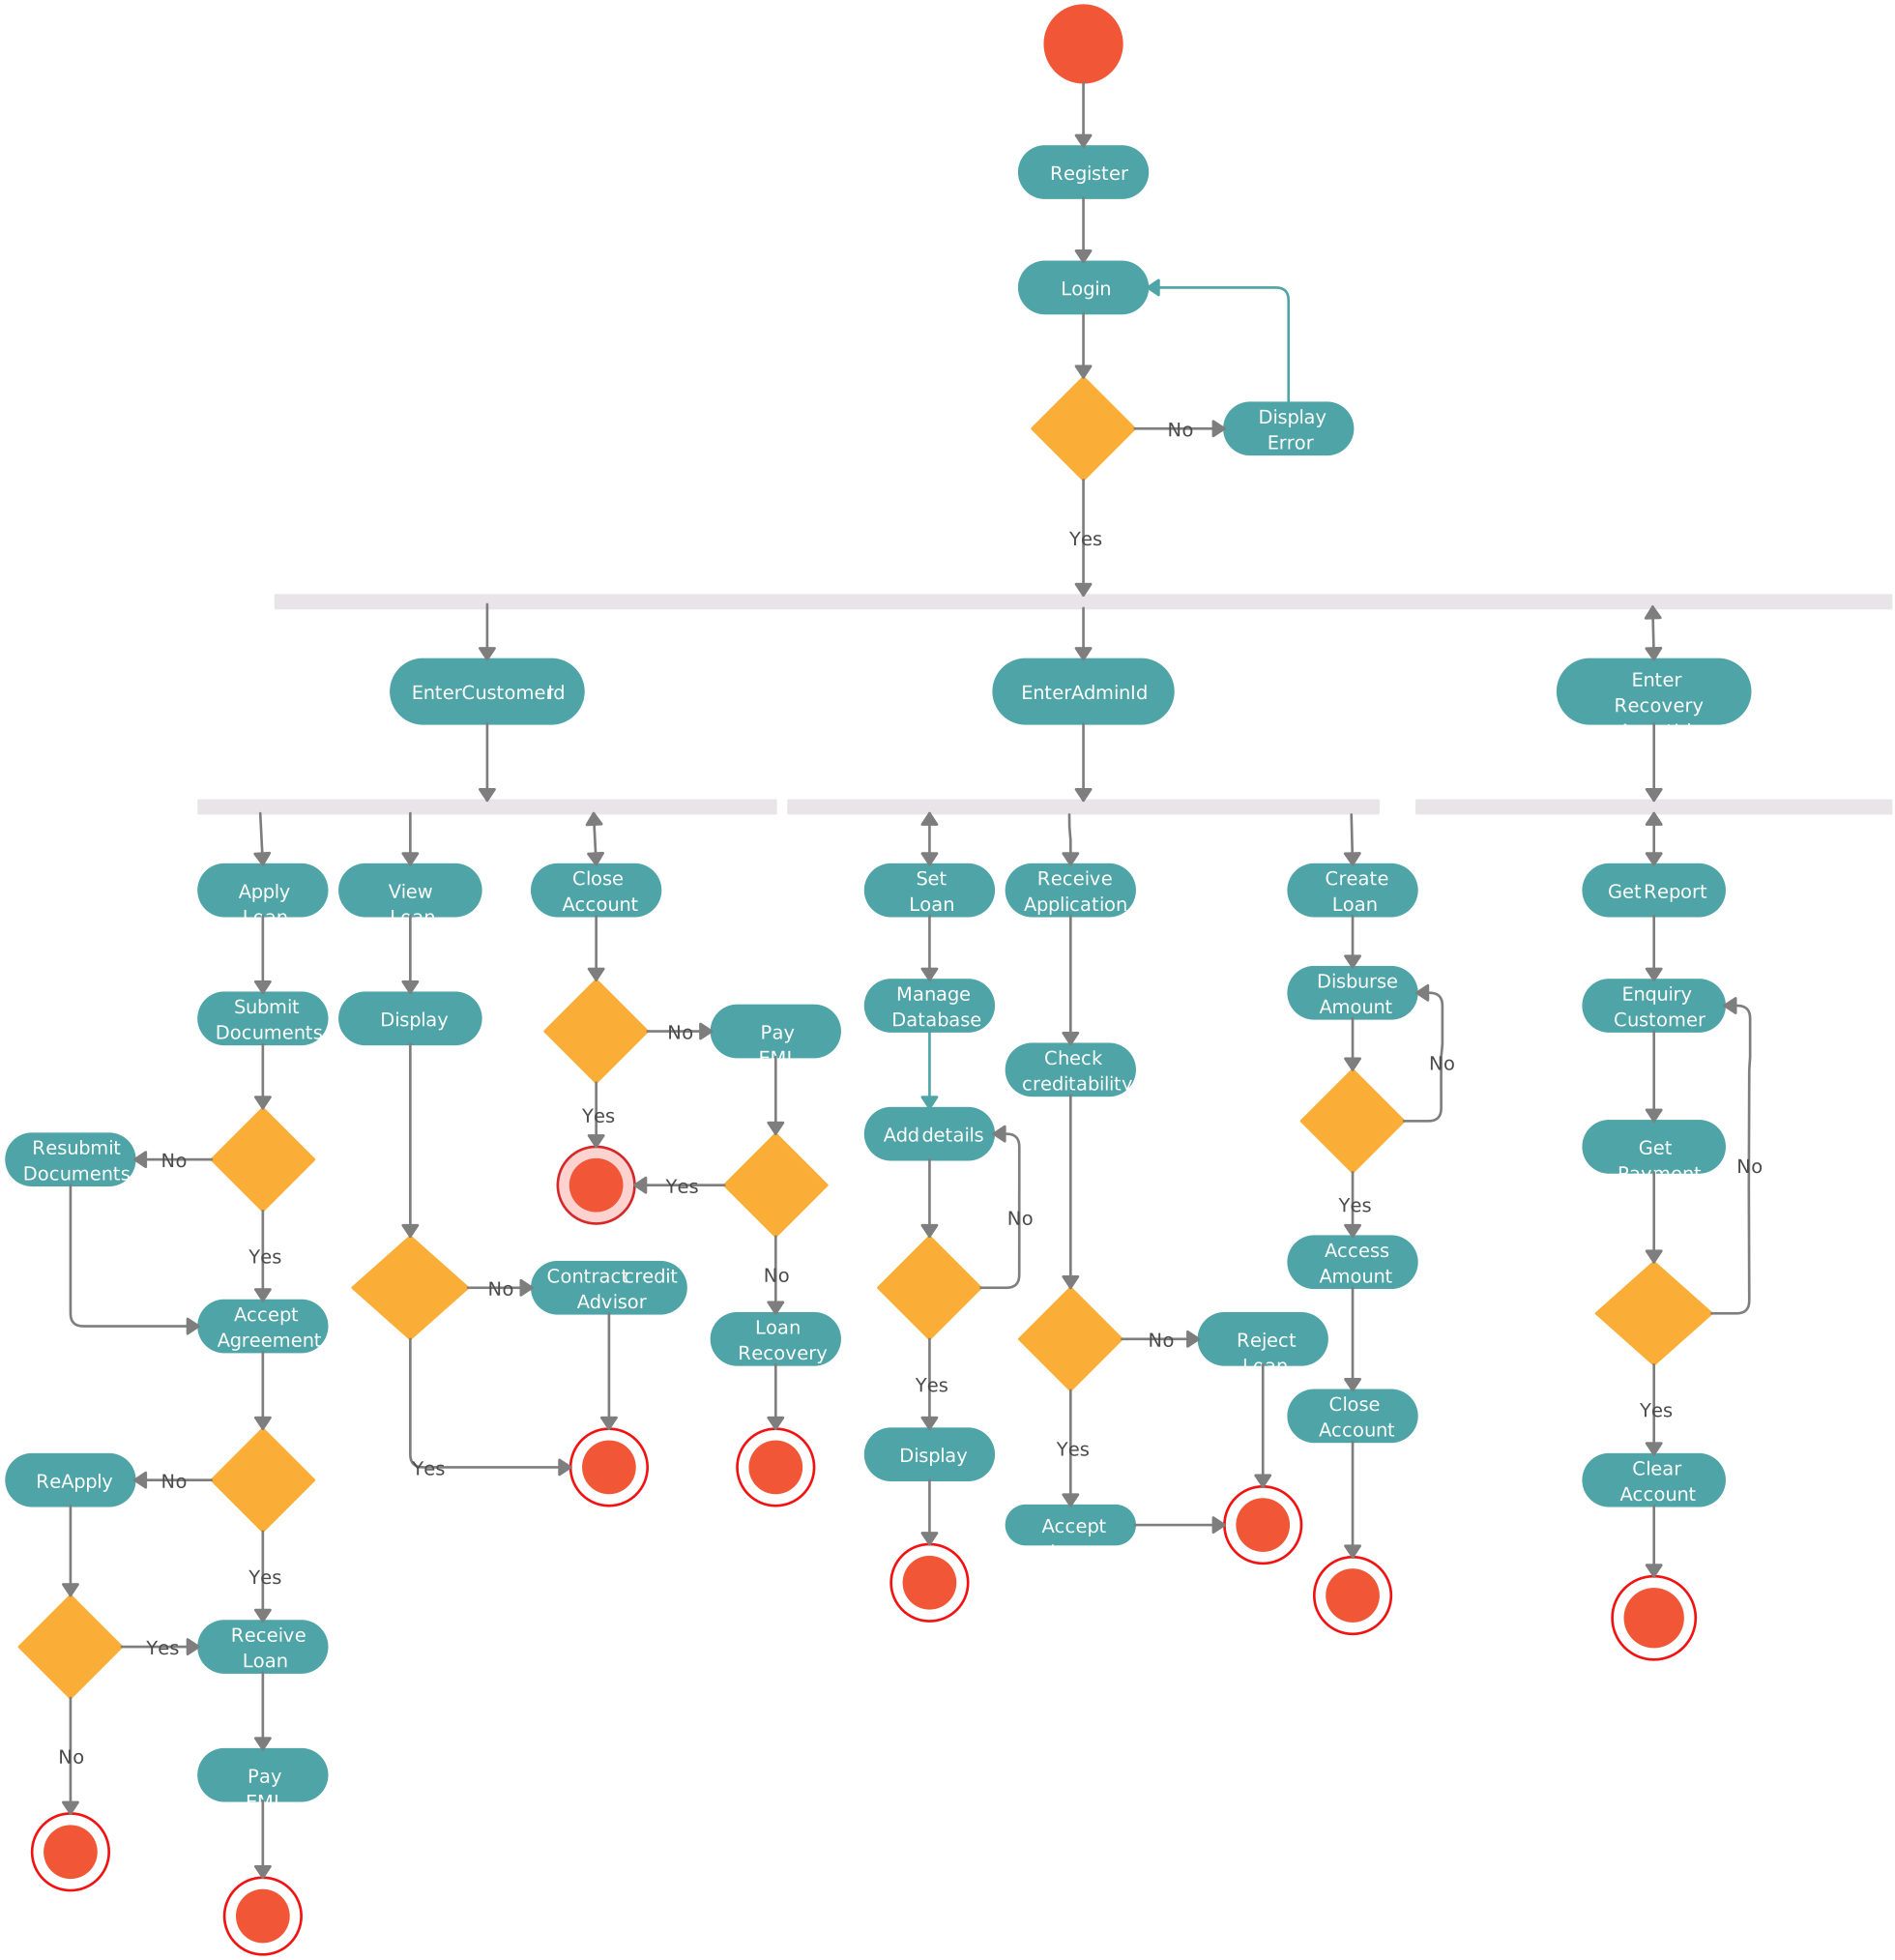
Loan Management System Flowchart
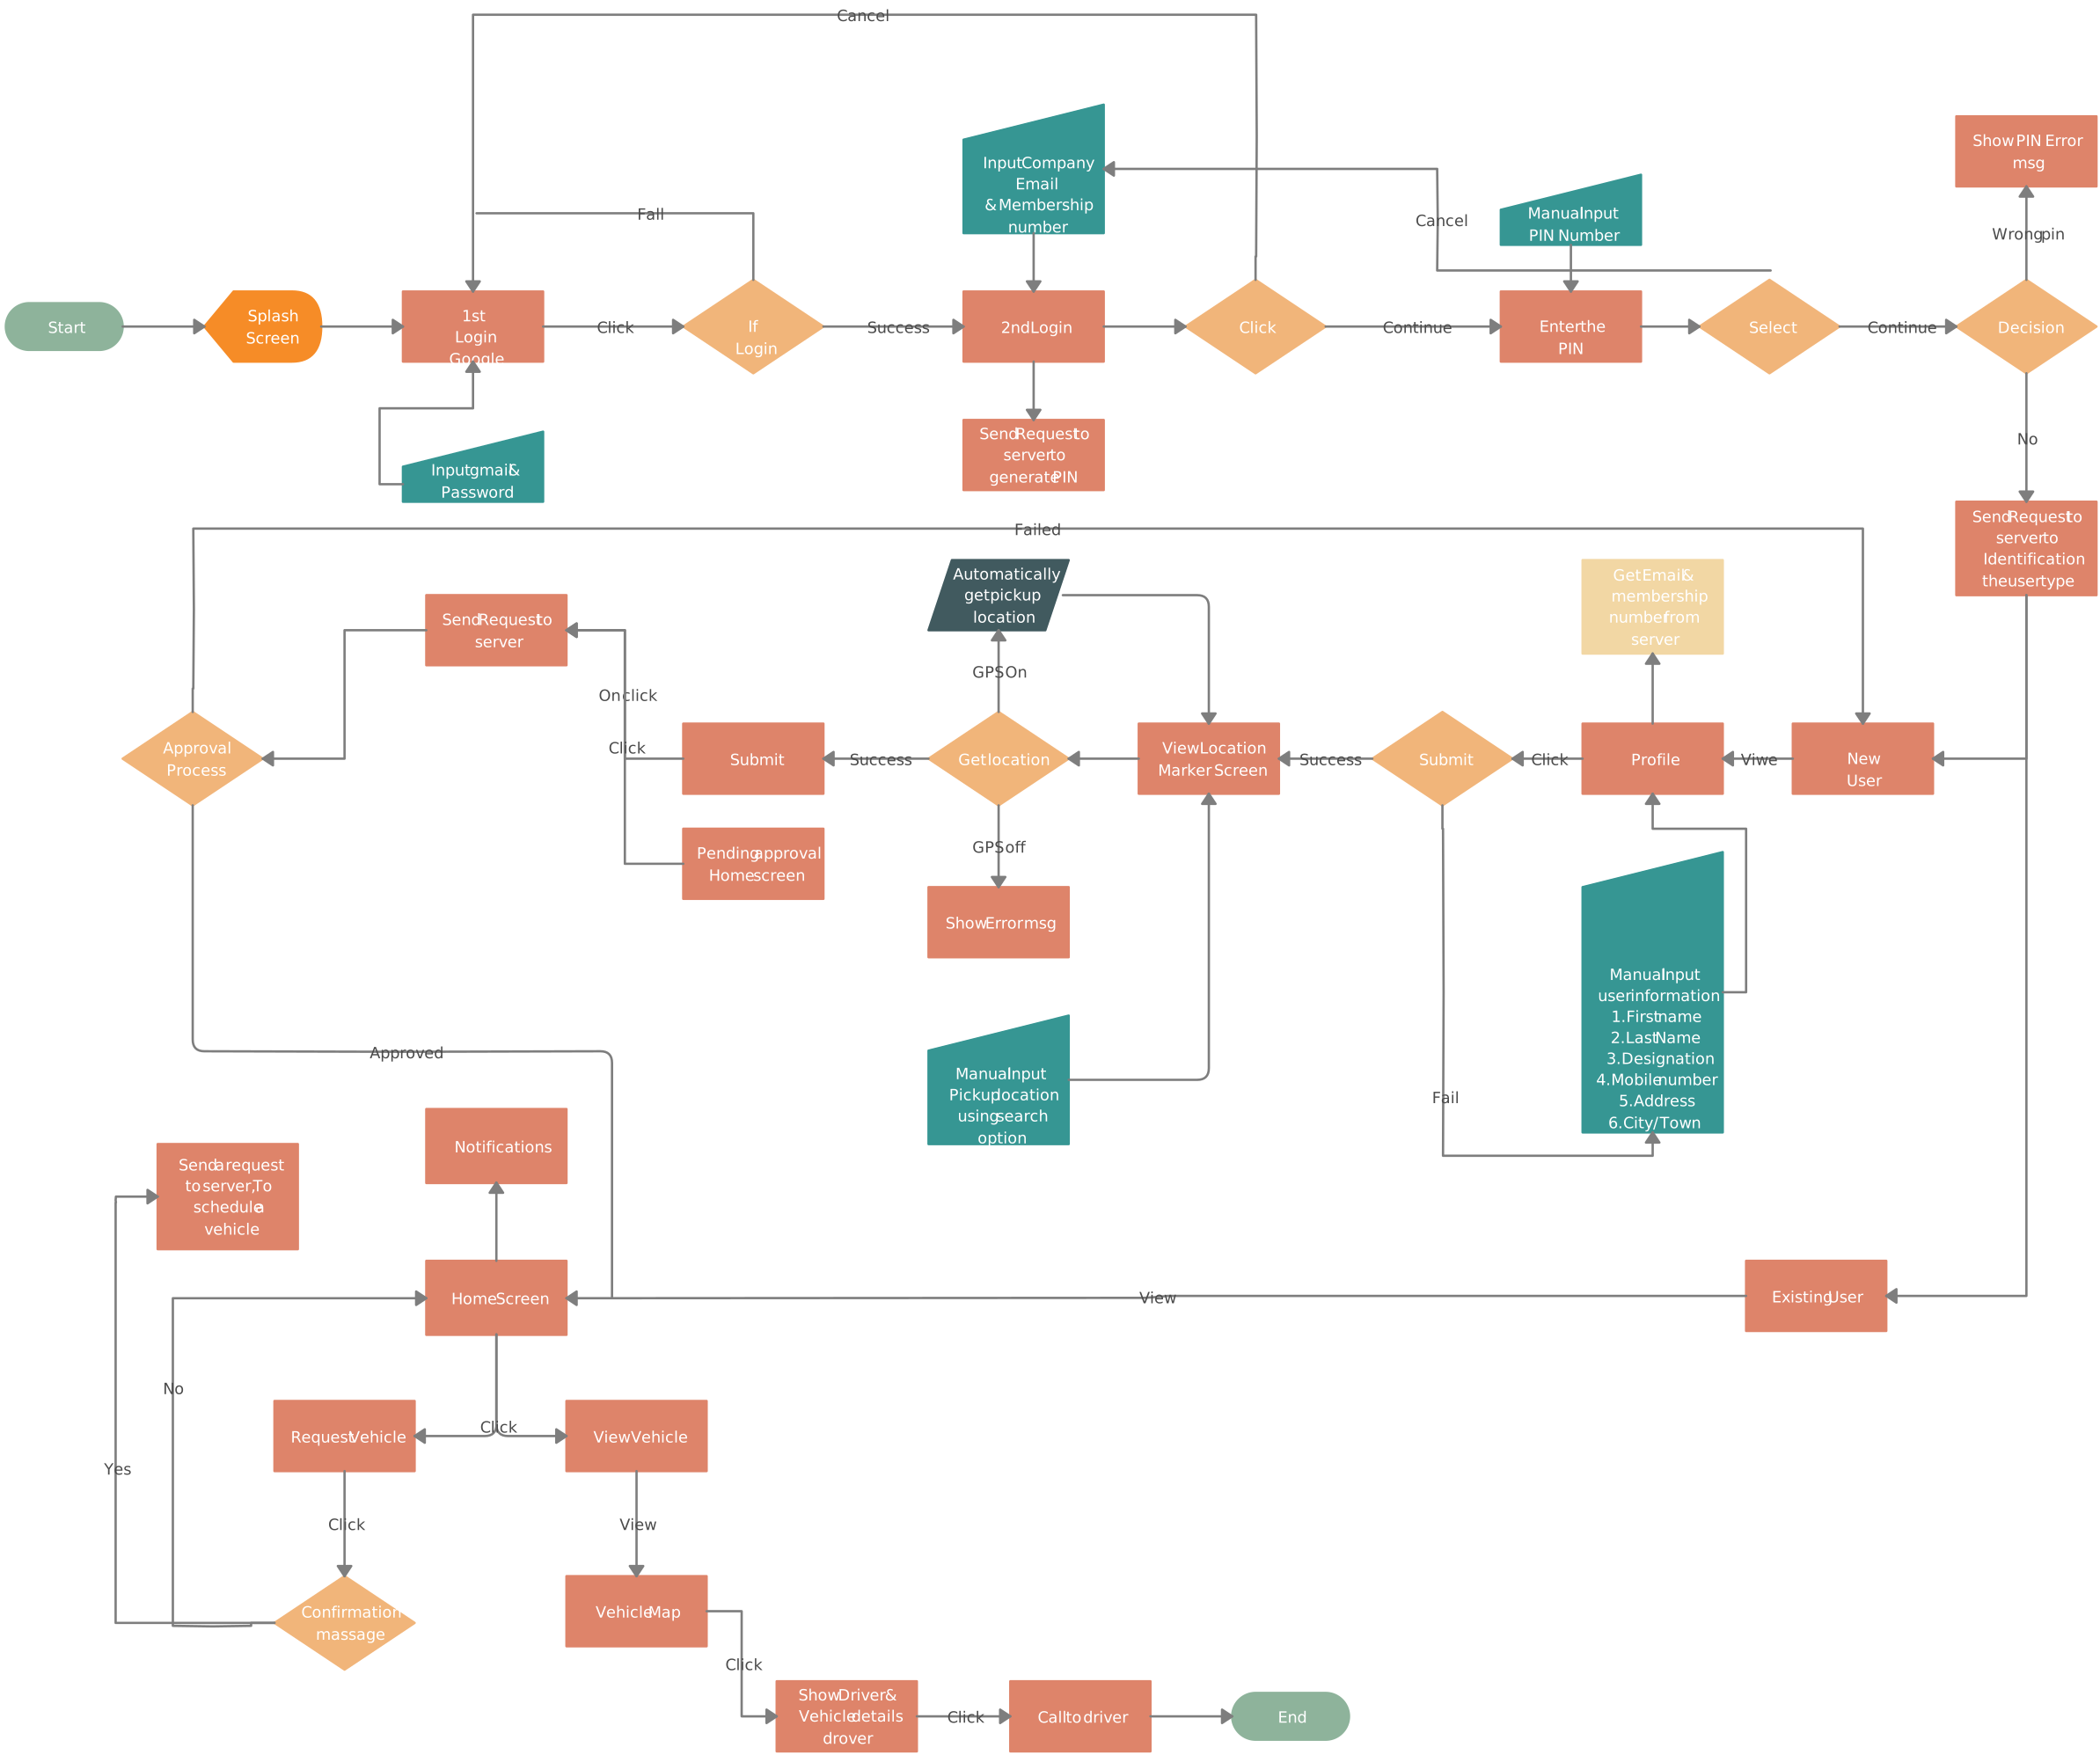
Transport Management System Flowchart
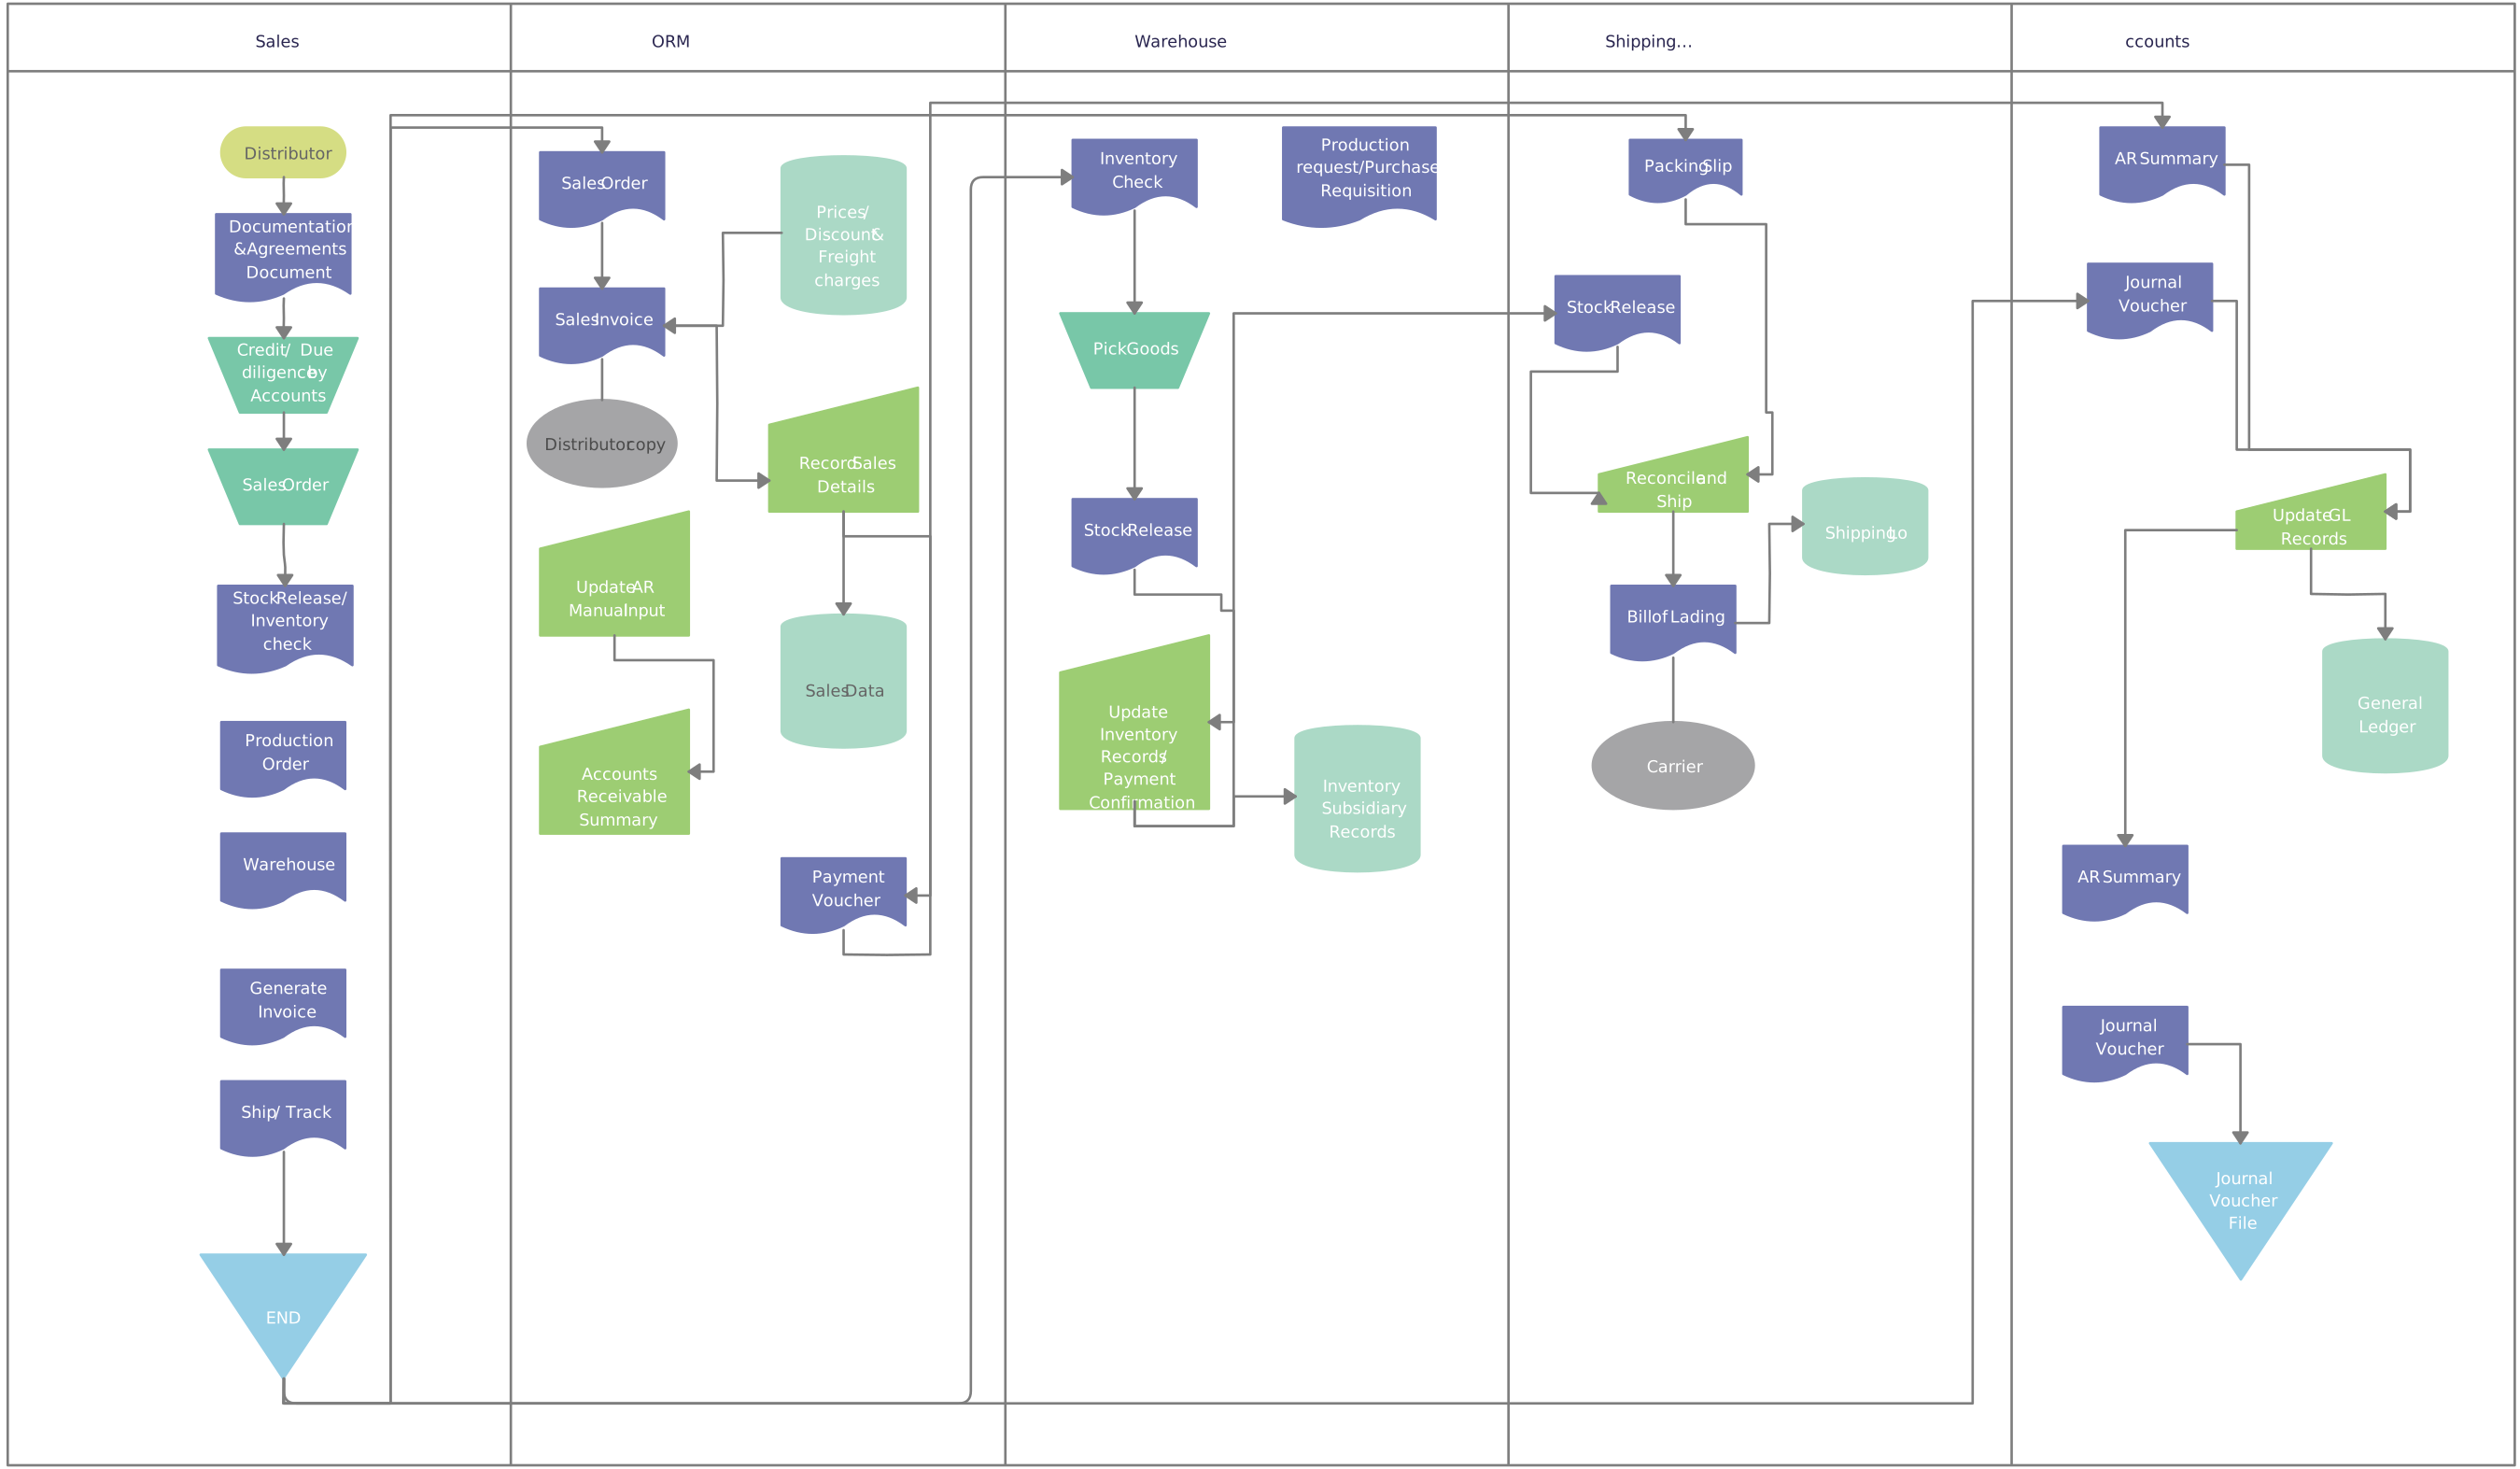
Distributor Sales Order System Flowchart
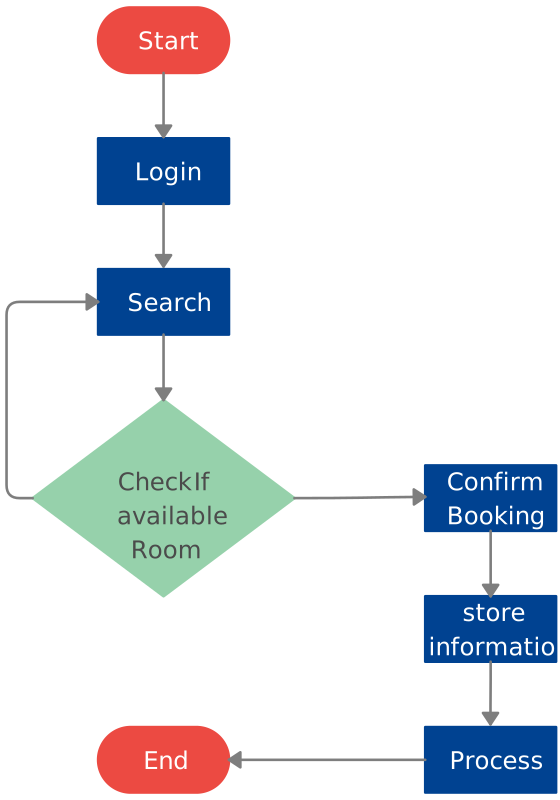
Hotel Reservation System
When to Use System Flowcharts
A system flowchart is useful whenever you need to understand, explain, or improve how a process works. It helps break down complex systems into simple, visual steps. Here are some key situations where a system flowchart is the best tool to use:
1. Designing or improving a process
If you’re creating a new system or updating an existing one, a system flowchart helps you map out the steps and find ways to make it more efficient.
Example: A business improving its online checkout process can use a system flowchart to see where customers might drop off and make changes to simplify the experience.
2. Troubleshooting and fixing issues
When a system isn’t working correctly, a system flowchart can help pinpoint the problem by showing where data flows smoothly and where it gets stuck.
Example: If an ATM isn’t processing withdrawals properly, a system flowchart can help track where the issue occurs—whether in user authentication, account balance checks, or transaction approvals.
3. Explaining how a system works
System flowcharts make it easier to train employees, teach students, or present ideas to teams by providing a clear, step-by-step visual of how a system operates.
Example: A teacher explaining how online banking transactions work can use a system flowchart to show students how money moves from one account to another.
4. Automating tasks and workflows
Before automating a business or software process, you need to understand how each step connects. A system flowchart helps identify repetitive tasks that can be automated.
Example: A company handling customer support can use a flowchart to map out how inquiries are processed and decide where chatbots can handle simple questions automatically.
5. Ensuring compliance and accuracy
Many industries require strict documentation of processes for legal or regulatory reasons. System flowcharts help businesses ensure they follow rules and avoid mistakes.
Example: A healthcare provider can use a system flowchart to track patient data handling, ensuring compliance with privacy laws like HIPAA.
Who Can Use System Flowcharts
System flowcharts are useful for anyone who wants to understand, improve, or explain how a process works. Whether you’re in business, technology, or education, a flowchart can help you see the big picture and make smarter decisions.
1. Business professionals
Managers, analysts, and team leaders use system flowcharts to improve operations, identify inefficiencies, and train employees. By mapping workflows, businesses can optimize processes such as order management, customer service, and financial transactions.
2. IT and software developers
System architects, programmers, and IT teams use flowcharts to design software systems, map data flow, and troubleshoot issues. They help in understanding how different components interact, ensuring smooth system functionality and debugging errors efficiently.
3. Educators and students
Teachers, students, and researchers use system flowcharts to simplify complex concepts, explain processes visually, and organize research. They are particularly useful in subjects like computer science, business studies, and engineering.
4. Healthcare professionals
Hospital administrators, medical staff, and compliance officers use system flowcharts to improve patient care workflows, streamline administrative tasks, and ensure regulatory compliance. They help in visualizing processes such as patient admissions, treatment plans, and medical billing.
5. Financial and accounting teams
Accountants, auditors, and financial analysts use system flowcharts to track financial transactions, ensure compliance with regulations, and prevent fraud. They help in mapping payroll processing, invoice approvals, and tax filing workflows.
6. Manufacturing and supply chain managers
Production managers, logistics teams, and quality control specialists use system flowcharts to optimize supply chain operations, improve production efficiency, and reduce bottlenecks. They assist in visualizing processes such as inventory management, product assembly, and distribution.
Best Practices for Creating System Flowcharts
Follow these best practices to create system flowcharts that are clear, professional, and effective in explaining complex processes.
1. Keep it clear and simple
A system flowchart should be easy to read and understand. Use straightforward language and avoid unnecessary complexity. Each step should clearly show what happens without confusion. If a process is too detailed, break it into smaller flowcharts.
2. Use standard symbols
Flowcharts follow a set of common symbols, such as ovals for start and end points, rectangles for processes, diamonds for decisions, and arrows to show direction. Sticking to these standard symbols makes your flowchart easy for anyone to follow.
3. Ensure logical flow and consistency
The process should move in a logical sequence, from start to finish. Use arrows to show the direction of flow clearly, ensuring that each step connects smoothly to the next. If decisions are involved, make sure the Yes/No or True/False paths lead to the correct next steps.
4. Review for accuracy
Before finalizing your flowchart, check it for mistakes. Ensure that all steps are included, the connections make sense, and there are no missing or extra steps. It’s helpful to have someone else review it to see if they can understand the process easily.
Benefits of System Flowcharts
System flowcharts are powerful tools for simplifying processes, improving efficiency, and ensuring clear communication across various industries. Here are the key benefits of system flowcharts.
1. Makes complex processes easy to understand
System flowcharts break down complicated systems into simple, visual steps. They help anyone, even without technical knowledge, see how a process works from start to finish.
2. Improves efficiency and problem-solving
By mapping out a process, it’s easier to spot inefficiencies, errors, or unnecessary steps. This helps businesses and teams streamline operations, reduce waste, and fix problems faster.
3. Helps with better decision-making
A clear flowchart allows teams to see different pathways and outcomes. Whether designing a new system or improving an existing one, it helps make informed decisions based on logic and structure.
4. Enhances communication and teamwork
Flowcharts serve as a common reference for teams, making it easier to explain processes, delegate tasks, and ensure everyone understands their role in a system. They are especially helpful in training new employees.
5. Ensures accuracy and consistency
By visually documenting a process, flowcharts help organizations maintain consistency in workflows. This is crucial for industries that follow strict guidelines, such as finance, healthcare, and manufacturing.
6. Supports automation and system development
In software development and IT, system flowcharts help programmers and engineers design, troubleshoot, and automate workflows, ensuring smooth system operations.
System Flowchart vs Data Flow Diagram
A system flowchart focuses on showing the sequence of steps in a process. It maps out how a system works, highlighting actions, decisions, and the flow of tasks. It’s great for visualizing how a process is carried out step-by-step within a system.
A data flow diagram (DFD), on the other hand, focuses specifically on how data moves within a system. It shows how information enters, is processed, and flows between different parts of the system. DFDs are ideal for understanding how data is handled rather than the tasks being performed.
In short, a system flowchart is about the steps in a process, while a data flow diagram is about how data flows through the system. Both diagrams can complement each other, with system flowcharts providing a process overview and DFDs showing data movement in detail.
System Flowchart vs Program Flowchart
A system flowchart shows the overall process of a system, including all its components and how they interact. It maps out tasks, decisions, inputs, and outputs, providing a high-level view of how the system operates as a whole. It’s used to visualize and improve processes in systems like businesses or organizations.
A program flowchart, on the other hand, is specifically for programming and software development. It focuses on the sequence of operations within a program or algorithm, showing how the program executes step by step. It’s useful for developers to understand the logic of the program, like loops, conditions, and data processing.
In short, a system flowchart represents a complete system’s workflow, while a program flowchart is more focused on how a program or software executes its tasks.
How to Create Your System Flowchart with Creately
Creately offers several features that make it ideal for creating system flowcharts, especially for mapping out processes and workflows:
1. Drag-and-drop interface
Creately’s intuitive drag-and-drop functionality allows you to easily add and organize shapes and symbols for your system flowchart. With a wide selection of pre-built shapes for processes, decision points, and connectors, you can create a structured and clear diagram effortlessly.
2. Pre-built templates and symbols
Creately offers a variety of pre-designed flowchart templates and an extensive library of industry-standard flowchart symbols. These templates save time and provide a solid starting point for your system flowchart, which you can fully customize to match your specific processes.
3. Real-time collaboration
With real-time collaboration, multiple team members can work on the same system flowchart simultaneously. This allows for immediate feedback, quick adjustments, and smoother teamwork, improving communication and efficiency in the flowchart creation process.
4. Customizable shapes and styles
Creately allows you to tailor the shapes, symbols, and styles to suit your needs:
- Color Customization: Differentiate parts of the process using colors.
- Text Formatting: Add clear labels, descriptions, and annotations to explain each part of the process.
- Adjust Line Styles: Modify line thickness, shape, and color to emphasize key areas.
5. Export and sharing options
Once your system flowchart is complete, Creately makes it easy to share and export it. You can generate shareable links for others or export the flowchart in various formats (PDF, PNG, JPEG, SVG) to include in reports, presentations, or documentation.
6. AI assistance with Creately VIZ
Creately VIZ, an AI-powered tool, helps streamline the flowchart creation process by offering automatic suggestions and optimizations. It can convert text-based descriptions into visual diagrams, highlight inefficiencies, and suggest improvements for a more efficient and effective system flowchart.
7. Swimlane customization (optional for complex systems)
If your system flowchart involves multiple departments or teams, Creately allows you to add swimlanes for a more detailed view of responsibilities and process flow. You can create horizontal or vertical lanes, adjust their size, and label them according to roles or departments.
Conclusion: What Is a System Flowchart
System flowcharts are valuable tools for understanding, improving, and communicating processes in any field. They make complex workflows easier to follow, help identify inefficiencies, and support better decision-making. By using standard symbols and ensuring logical flow, you can create flowcharts that are clear, accurate, and useful for a variety of purposes.
Whether you’re a business professional, IT specialist, educator, or healthcare worker, system flowcharts can simplify your work and improve efficiency. With the right approach, they become more than just diagrams—they turn into a roadmap for smarter, more effective systems.