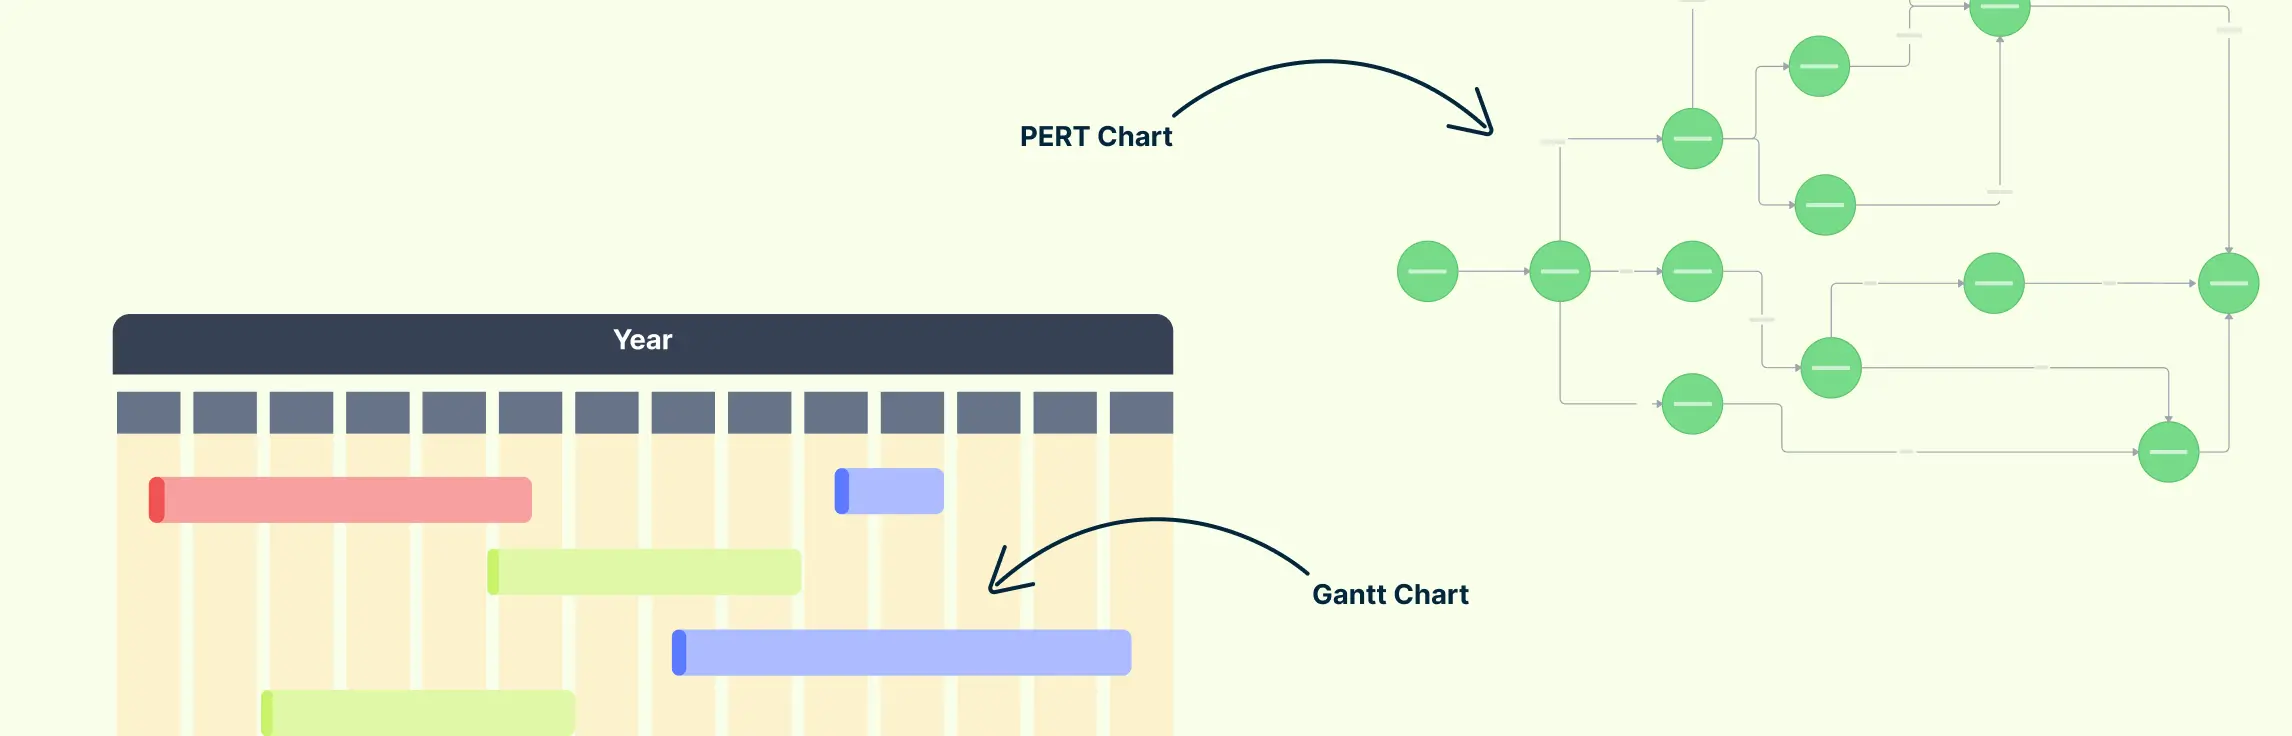
Overview of Project Management Charts
In project management, PERT Chart vs Gantt Chart emerges as a key comparison for determining the most effective approach to task scheduling and resource allocation. Both tools are indispensable for visual collaboration and offer unique perspectives on project execution. However, their methodologies and applications vary significantly, making the PERT Chart vs Gantt Chart debate crucial for project managers.
Gantt Chart: Simplifying Timelines
The Gantt chart, named after Henry Gantt, presents tasks as a series of horizontal bars plotted against a timeline. This format visually tracks the start and finish dates of each project task, making it ideal for managing resources, scheduling, and maintaining transparency throughout the project’s lifecycle. When considering PERT Chart vs Gantt Chart, the Gantt chart is particularly effective for straightforward project timelines and progress monitoring. Using tools like the Gantt Chart Maker, you can enhance your planning and execution processes, driving efficiency and impactful results.


PERT Chart: Mapping Dependencies
In contrast, the PERT chart—short for Program Evaluation and Review Technique—specializes in visualizing task sequences and dependencies through a network diagram. It is particularly useful for analyzing the critical path of complex projects, ensuring potential bottlenecks are identified and managed effectively. In the PERT Chart vs Gantt Chart discussion, the PERT chart stands out for projects with intricate dependencies requiring detailed analysis. With tools like the PERT Chart Maker, you can streamline complex project planning, ensuring efficient workflows and successful outcomes.
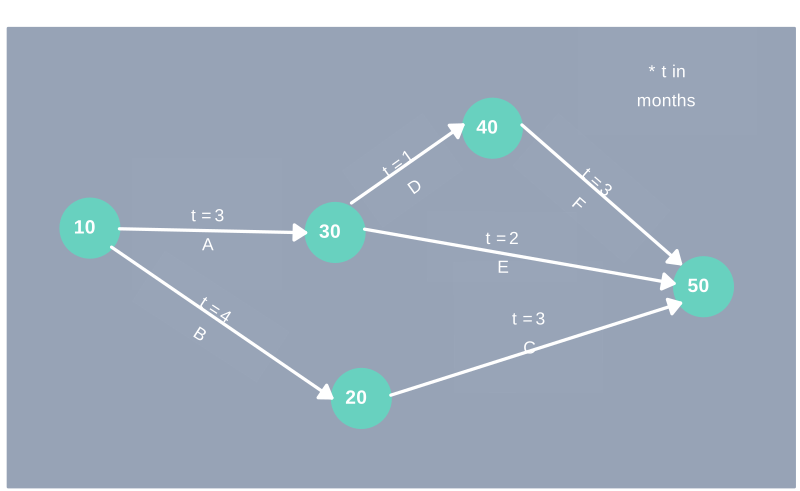
With Creately’s advanced project planning solutions, the PERT Chart vs Gantt Chart debate becomes less about choosing one tool and more about using both efficiently. Creately allows seamless collaboration, enabling teams to leverage the benefits of both Gantt and PERT charts for strategic planning, risk assessment, and enhanced project visualization.
Detailed Comparison: PERT Chart vs Gantt Chart
Understanding the dynamics of project management tools begins with exploring the PERT Chart vs Gantt Chart comparison. These visual aids play crucial roles in planning and executing projects, offering distinct features and strengths. Choosing between them depends on the specific requirements of your project.
Comparison Table: PERT Chart vs Gantt Chart
| Feature | Gantt chart | PERT chart |
|---|---|---|
| Visual representation | Task bars on a timeline | Network of tasks and dependencies |
| Main focus | Scheduled dates, milestones, and progress | Task sequence, duration estimates, and critical path |
| Uncertainty | Shows the current schedule; revise it when estimates change | Uses optimistic, most likely, and pessimistic estimates to account for uncertain durations |
| Dependencies | Can show predecessor links, though a dense schedule can be hard to trace | Makes parallel and dependent paths prominent |
| Best use | Communicating and tracking the project schedule | Planning complex task relationships and testing the expected finish time |
| Limitation | Dates can suggest more certainty than the estimates warrant | Less direct for showing calendar dates and day-to-day status |
PERT Chart vs Gantt Chart: Key Features and Use Cases
Gantt Chart: Simplicity and Timeline Clarity
The Gantt chart is a linear visual schedule that displays tasks as horizontal bars on a timeline. It provides a clear overview of task durations, start and finish dates, and resource allocation. This simplicity makes it an excellent choice for smaller or ongoing projects.
Advantages of Gantt Charts:
Ease of Use: Gantt charts are easy to interpret and adapt, making them ideal for tracking a project’s progress.
Time Tracking: Perfect for identifying schedule discrepancies early and adjusting timelines accordingly.
Transparency: Facilitates collaboration by offering all stakeholders a clear project view.

PERT Chart: Precision in Task Dependencies
The PERT chart (Program Evaluation and Review Technique) uses a network of nodes and arrows to represent task sequences and dependencies. It is particularly beneficial during the planning stages of large-scale, complex projects.
Advantages of PERT Charts:
Critical Path Analysis: Identifies the sequence of tasks that determines the project’s minimum completion time.
Comprehensive Planning: Maps dependencies with precision, reducing risks of bottlenecks.
Strategic Insight: Provides a detailed understanding of task relationships and project complexity.

Helpful Resources
Create timelines for any event; track and analyze your team’s projects and tasks from start to finish with Creately’s Gantt chart maker.
Easily schedule, organize, and map project tasks and keep track of dependencies in a single collaborative, visual platform with Creately’s PERT chart maker.
Visualize, analyze, and improve organizational processes on a single, connected workspace.
Choosing Between PERT Chart vs Gantt Chart: When to Use Each
Effective project management often requires selecting the right tools to match the complexity and goals of your project. Both PERT and Gantt charts offer unique advantages, but they cater to different needs in the planning and execution phases. Here’s a deeper look at when to choose each:
Use Gantt Charts When:
- You need a clear and adaptable timeline for visualizing project progress and tracking milestones.
- You need to show planned dates, milestones, and ownership to the people doing the work.
- You want to provide a quick overview of the project’s timeline for stakeholders.
- Real-time updates and adjustments are necessary to accommodate changes in priorities or delays.
- You want to track work that overlaps or depends on other tasks.
Gantt charts excel in their simplicity, making them a go-to choice for project managers who need a user-friendly interface for planning and tracking project stages. They are particularly effective for task scheduling and resource allocation, giving teams a clear picture of deadlines and deliverables.
Use PERT Charts When:
Your project involves complex dependencies and requires mapping the relationships between tasks.
You need to conduct a critical path analysis to determine the optimal timeline for project completion.
You want to focus on the sequence and duration of tasks rather than their exact deadlines.
The project is large-scale or highly detailed, with multiple interrelated activities that impact overall progress.
Estimating project timelines based on probabilistic scenarios (optimistic, pessimistic, and most likely) is essential.
PERT charts are ideal for projects where understanding task dependencies and their impact on overall timelines is crucial. By emphasizing the sequence and interconnectivity of activities, PERT charts help identify potential bottlenecks and opportunities for efficiency.
Applications of Gantt Charts
When analyzing the PERT Chart vs Gantt Chart debate, Gantt charts stand out as essential tools for effective project management. They excel in providing a clear timeline and efficient tracking of tasks, making them ideal for scenarios where time management and progress monitoring are critical. Their visual representation through horizontal bar charts allows project managers to plot tasks along a timeline for better clarity and organization.

Key Scenarios Where Gantt Charts Excel
1. Projects That Need a Shared Schedule
Gantt charts suit projects of any size when teams need to see tasks, dates, and milestones together. They can also show dependencies, while the timeline keeps planned dates easy to read.
2. Tight Deadlines
For projects with strict time constraints, Gantt charts provide a significant advantage. They offer a clear visualization of timelines, enabling project managers to quickly identify bottlenecks and adjust resources as needed. When a date changes, the chart makes the revised schedule visible to everyone reviewing it.
3. Determining Task Progress
Gantt charts effectively display task progress by filling bars to indicate the percentage of completion. This visual progress tracking is a standout feature in the PERT Chart vs Gantt Chart comparison, as Gantt charts offer a more user-friendly and intuitive way to monitor ongoing tasks.
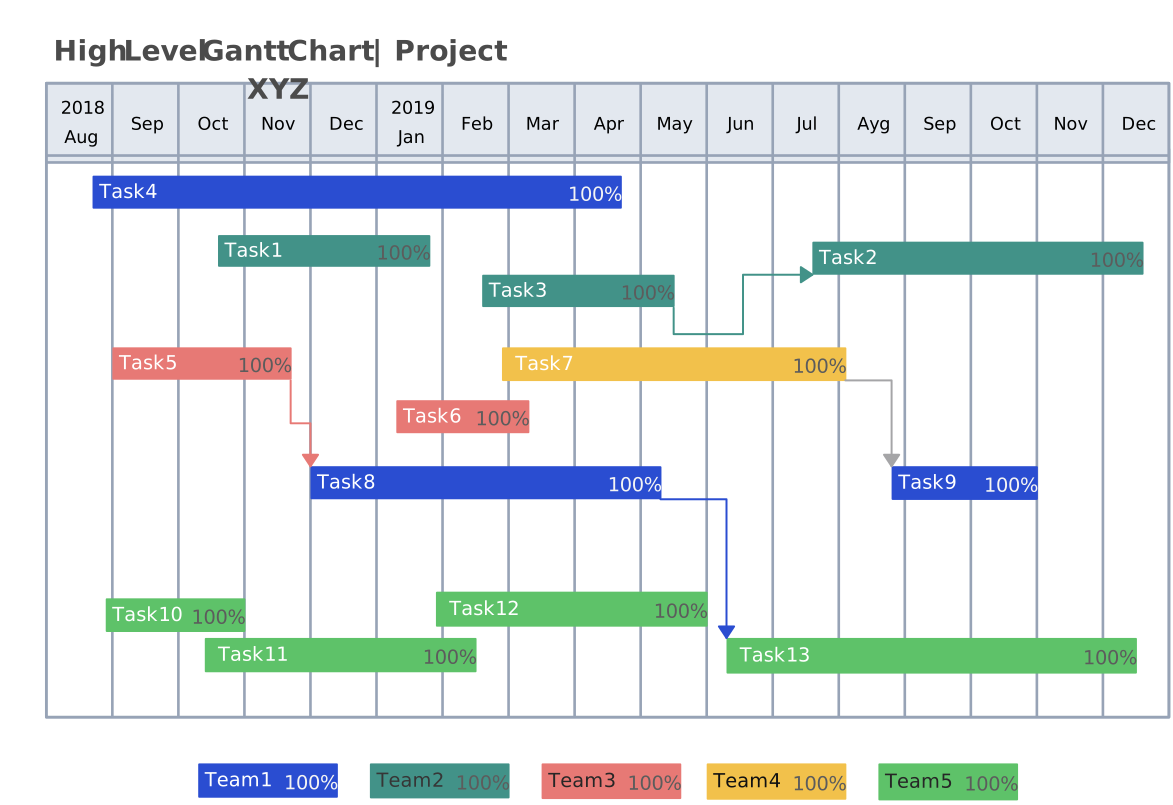
For those interested in exploring Gantt charts further, the Gantt Chart for High Level Project Planning and the Timeline Maker offer excellent resources for getting started. By utilizing the enhanced visualization offered by Gantt charts, project managers can achieve improved time management and transparency, ensuring that all project stakeholders are aware of timelines and deadlines. This makes Gantt charts indispensable for efficient project execution and success.
Applications of PERT Charts
When comparing PERT Chart vs Gantt Chart, PERT charts emerge as indispensable tools for managing complex projects laden with interdependencies. Particularly suited for scenarios with uncertain elements, PERT charts meticulously highlight task dependencies and critical paths, ensuring every milestone is visible from the outset.
One of the standout strengths of PERT charts in the PERT Chart vs Gantt Chart discussion is their ability to define and schedule intricate task sequences. They are the preferred choice during the initial planning phases, helping project managers map out workflows and calculate the minimal time required for project completion using the critical path method.

Key Scenarios Where PERT Charts Excel
1. Managing Complex Dependencies
In projects with overlapping tasks and interdependent activities, PERT charts excel at visualizing task relationships through detailed network diagrams. Compared to Gantt charts, which prioritize timelines, PERT charts focus more on task sequencing and dependencies, making them ideal for industries like construction, aerospace, and IT.
2. Handling Concurrent Tasks
In the PERT Chart vs Gantt Chart debate, PERT charts shine in projects where multiple tasks can be executed concurrently, but their sequence directly impacts overall success. The ability to map out dependencies helps anticipate potential risks and adjust schedules proactively, while a Gantt chart places those tasks on the calendar.
3. Initial Project Planning
PERT charts are particularly powerful during the planning phase, where project managers need to analyze all possible task sequences and identify the critical path. While Gantt charts are better suited for tracking progress, PERT charts are the go-to choice for setting up a comprehensive project roadmap.

To fully utilize PERT charts, mandatory tasks and their sequences must be identified from the start, allowing teams to allocate resources efficiently and prioritize actions effectively. Additionally, the use of PERT charts and real-time adjustments to project plans can significantly reduce bottlenecks and streamline processes. For project authorities seeking to navigate complicated timelines while mitigating uncertainties, understanding PERT chart examples can enhance decision-making and facilitate successful project outcomes efficiently.
Benefits of Using Both Charts Together
Incorporating PERT Chart vs Gantt Chart into your project management toolkit creates a powerful synergy that optimizes planning and execution processes. By combining the strengths of both charts, project managers can build a comprehensive framework that boosts efficiency and enhances overall project success.
Optimized Project Planning with PERT
- In the PERT Chart vs Gantt Chart comparison, PERT charts excel in the initial project stages by identifying task dependencies and determining the critical path. This critical analysis provides a detailed roadmap, highlighting tasks that must be prioritized to avoid potential delays. PERT’s network-based structure ensures that even complex dependencies are mapped out with clarity, offering an unparalleled level of strategic insight.
Enhanced Tracking and Control with Gantt
- As projects transition from planning to execution, Gantt charts shine by offering a linear, timeline-based visualization. In the PERT Chart vs Gantt Chart debate, Gantt charts are unrivaled for real-time tracking, allowing project managers to monitor task durations, start and end dates, and overall progress. Their straightforward format ensures that teams stay on schedule, with deadlines clearly communicated and actionable.
Elevated Communication and Resource Management
- One of the key advantages of using PERT Chart vs Gantt Chart together lies in their ability to enhance communication and resource allocation. Gantt charts provide transparency in task assignments and resource tracking, ensuring all team members are aligned. Meanwhile, PERT charts enable project managers to foresee dependencies, making it easier to allocate resources to tasks that have the most impact on the critical path.
Example: Plan a Product Launch in Both Views
Suppose a team must design a landing page, complete legal review, build the page, and publish it. Design and legal review can start together. The build follows design, and publishing waits for both the build and legal review.
| Task | Optimistic | Most likely | Pessimistic | Depends on |
|---|---|---|---|---|
| Design page | 1 day | 2 days | 3 days | None |
| Legal review | 2 days | 3 days | 4 days | None |
| Build page | 4 days | 5 days | 6 days | Design page |
| Publish | 1 day | 1 day | 1 day | Build page and legal review |
In the PERT chart, draw the two paths that meet before publishing. Using the standard PERT weighted estimate (optimistic + 4 × most likely + pessimistic, divided by 6), the expected task durations are 2, 3, 5, and 1 days. Design → build → publish is the critical path at eight working days. That is an estimate, not a guaranteed finish date.
In the Gantt chart, schedule design for days 1–2, legal review for days 1–3, build for days 3–7, and publishing for day 8. The bars show the overlap and planned dates. Update the schedule if an estimate changes, then review whether the critical path has changed. Creately’s PERT chart template and Gantt chart template provide editable starting points.
Challenges of Pert Chart vs Gantt Chart
Gantt Charts:
Complexity in Large Projects: They can become cluttered and hard to manage as task numbers increase, especially with multiple dependencies.
Dense Dependencies: Gantt charts can show predecessor links, but many crossing links can make a large schedule difficult to read.
Schedule Maintenance: When dates or estimates change, the schedule needs to be reviewed and updated.
Resource Tracking Issues: Overlapping resource allocation across tasks is harder to manage.
PERT Charts:
Complex to Create: Detailed planning for tasks, dependencies, and durations can be time-consuming.
Difficult for Non-Technical Users: The network of nodes and arrows can be hard to interpret for non-experts.
Less Calendar Clarity: They include task durations, but do not show scheduled dates as directly as Gantt charts.
Setup Effort: Mapping every dependency may take more effort than a small project needs.
In summary, Gantt charts are better for timeline visualization and progress tracking, while PERT charts excel at managing task dependencies and critical paths. Combining both can offer a comprehensive project management approach.
How to Set Up a Gantt Chart in Creately
Creating a Gantt chart in Creately is simple and efficient. Follow these steps to set up your own visual project timeline:
- List Your Tasks and Subtasks: Start by listing all tasks and subtasks in the chart’s vertical axis.
- Identify Task Connections: Determine which tasks are dependent on others, and identify those connections.
- Create a Timeline: Set up the timeline along the horizontal axis to display the project’s overall duration.
- Place Tasks: Arrange tasks according to their dependencies and overlap, using horizontal bars to represent planned start and end dates.
- Assign Tasks: Assign tasks to team members directly within the Gantt chart for clarity and tracking.
- Track Progress: Update progress as the project moves forward, adjusting task bars to reflect completion.
Creately offers a range of customizable templates for Gantt charts, allowing you to easily set up, track, and collaborate on your project’s timeline in real-time. You can seamlessly share your chart with team members for instant collaboration and feedback.
How to Set Up a PERT Chart in Creately
Creately makes it easy to create and collaborate on PERT charts to visualize project dependencies and timelines. Here’s how:
List Phases, Milestones, and Tasks: Begin by listing the main phases, milestones, and tasks of your project as nodes.
Identify Task Dependencies: Determine which tasks are dependent on others and note those connections.
Connect Tasks Using Arrows: Use directional arrows to represent the dependencies, indicating the sequence of tasks.
Determine Completion Times: Include each task’s earliest start, finish times, and planned duration to ensure accurate scheduling.
Map the PERT Chart: Create and visualize your PERT chart using Creately’s intuitive diagramming tools, which are designed for quick mapping.
Critical Path Analysis: Identify the critical path using the PERT chart, allowing you to assess the longest sequence of dependent tasks affecting your project’s overall timeline.
With Creately, you can design your PERT chart easily using pre-built templates and real-time collaboration features. Share and update the chart with your team to keep everyone aligned and on track.
How Creately Enhances Business Processes with Gantt and PERT Charts
In today’s fast-paced business environment, effective project management is crucial across various industries. While Gantt and PERT charts are most commonly used in project management and software development, their applications extend far beyond. Creately helps teams optimize their planning and execution in diverse fields such as event management, construction, healthcare, and manufacturing/production planning.
Creately provides editable templates for both charts and lets teams keep a PERT chart and Gantt chart together in a shared workspace, with a reference between the two views. Team members can review task dependencies, dates, and changes together using comments and real-time collaboration. Treat the link as a workspace reference rather than assuming synchronized task data: when an estimate or dependency changes, check and update both charts.
Collaboration Features
Live Updates: Keep your team synchronized with living documents that update automatically as changes are made. Everyone stays on the same page, whether you’re working on a construction schedule or planning a healthcare initiative.
Version History: Easily track revisions and revert to previous versions, ensuring important changes are never lost, and keeping your project timeline intact.
Presentation Mode: Creately’s presentation mode enables you to share project progress seamlessly, making it easier to explain status updates in meetings, with clients, or during stakeholder reviews.
Sharing in Multiple Formats: Export your work in various formats—PDFs, images, and more—to ensure that your project progress is shared in the format that best suits your stakeholders.
Visual Project Management
Creately provides integrated tools to manage project timelines, resources, and dependencies with ease. Whether it’s a Gantt chart for tracking time or a PERT chart for mapping task dependencies, Creately offers everything you need to stay organized and on target.
Real-time Collaboration: Collaborate with team members in real-time, ensuring everyone is aligned with project goals and progress. Whether you’re managing a healthcare rollout or planning a production schedule, Creately lets your team edit, comment, and discuss project details simultaneously, improving communication and efficiency.
Enhanced Planning: Creately’s data visualization tools enhance project insights and decision-making. Whether you’re mapping out the complex dependencies of a construction project or visualizing the timeline of a medical campaign, Creately provides the clarity you need for better planning and execution.
Streamlined Execution: Transition seamlessly between planning and execution. With Creately, you can visualize workflows and project structures, ensuring smooth handoffs and precise execution. This ability is invaluable whether you’re overseeing a product manufacturing process or planning a corporate event.
Adaptable for Any Industry
While commonly associated with project management, the use of Gantt and PERT charts extends across various fields. Creately’s platform supports these applications across different industries, helping project managers and teams stay organized and efficient. Here’s how Creately supports various sectors:
Event Management: Gantt charts are perfect for planning and tracking event schedules, resource allocation, and task assignments. PERT charts help visualize the dependencies between event tasks, ensuring that no detail is overlooked.
Construction: In construction, Gantt charts are ideal for monitoring project timelines, resource management, and task dependencies. PERT charts allow you to analyze complex construction processes, identify critical paths, and optimize scheduling.
Healthcare Management: For healthcare management, Gantt and PERT charts help coordinate patient care programs, medical procedures, and clinical trials. Visualizing task dependencies ensures timely decision-making, resource allocation, and scheduling.
Manufacturing/Production Planning: Creately helps manufacturers plan production schedules, track workflows, and visualize resource allocation with Gantt charts. PERT charts support the analysis of production dependencies, helping optimize the production process and minimize delays.
Conclusion
This guide explored the distinctions and applications of PERT Chart vs Gantt Chart, emphasizing their unique roles in project management. Gantt charts, with their timeline-based approach, are excellent for tracking time-specific tasks, enhancing transparency, and managing resource allocation. They offer a clear, linear visualization of progress. On the other hand, PERT charts shine in the planning phase by focusing on task dependencies and critical paths, making them essential for large-scale or complex projects.
Use a PERT chart when uncertain task durations and dependencies determine the plan. Use a Gantt chart when the team needs to see dates, overlap, and progress. For complex work, start with the dependency map, then carry the same tasks and estimates into the schedule; revisit both when the plan changes. The editable PERT chart and Gantt chart templates above can help you build those views.
Resources:
Evdokimov, I.V., Tsarev, R.Y., Yamskikh, T.N. and Pupkov, A.N. (2018). Using PERT and Gantt Charts for Planning Software Projects on the Basis of Distributed Digital Ecosystems. Journal of Physics: Conference Series, [online] 1074(1), p.012127. doi: www.doi.org/10.1088/1742-6596/1074/1/012127.