What are Cross Functional Flowcharts?
A basic flowchart shows how micro processes are sequentially linked together in an operation. They are basically one dimensional, just showing the processes without going into much detail about the attributes of the particular process. This is where cross functional flowcharts come in. By expanding the limitations of the conventional flowcharts to a multidimensional range, cross functional flowcharts can increase the depth of detail. This allows the reader to not only examine the processes, but also the attributes related to the specific processes, along with the categories they belong to.
There are several types of cross functional flowcharts, such as the matrix, deployment and opportunity flowchart. Let us have a look at a few examples that show how cross functional flowcharts can aid in defining a process.
How Can Cross Functional Flowcharts Help Solve Problems
Cross-functional flowcharts can help solve a variety of issues within an organization. They provide a visual representation of processes, workflows, and responsibilities across different departments or roles.
Organizations can promote accountability, streamline procedures, and ensure compliance by employing cross-functional flowcharts. It’s crucial to keep in mind that while flowcharts are useful tools, they should be accompanied by effective communication and collaboration among teams to fully address and resolve the identified issues.
Here are a few specific issues and how cross-functional flowcharts can help solve them.
Communication breakdowns
A cross-functional flowchart can help to clarify the information flow and identify points of interaction when there are frequent misunderstandings or delays in communication between teams or departments. It can also help to identify bottlenecks, redundant steps, or areas where handoffs are not happening smoothly. By visualizing the communication process, teams can identify the root causes of breakdowns and implement solutions such as improved communication protocols or the use of collaborative tools.
Inefficient processes
Complex processes involving multiple teams can often become inefficient and time-consuming. Cross-functional flowcharts can help identify inefficiencies by visualizing the sequence of activities performed by different teams. Teams can collaboratively analyze the flowchart and identify unnecessary steps, duplicated efforts, or areas of potential improvement. By streamlining the process and eliminating waste, organizations can improve productivity and reduce costs.
Lack of accountability
When responsibilities are unclear, it can lead to a lack of accountability and ownership over tasks. A cross-functional flowchart can clearly outline the roles and responsibilities of each team or individual involved in a process. By visually representing who is responsible for each step, organizations can foster a culture of accountability and ensure that tasks are completed by the appropriate parties.
Compliance and regulatory issues
Cross-functional flowcharts can be particularly useful in industries with complex regulatory requirements. By mapping out the various steps and responsibilities required for compliance, organizations can identify potential gaps or areas of non-compliance. This allows them to implement corrective actions and ensure adherence to regulations.
Deployment Flowcharts
Deployment flowcharts basically outline the individual processes and subdivide them into various groups as the process flows sequentially. The very first deployment flowcharts were used to describe assembly lines processes, such as the manufacture of a car. These are the most commonly used cross functional flowchart type.
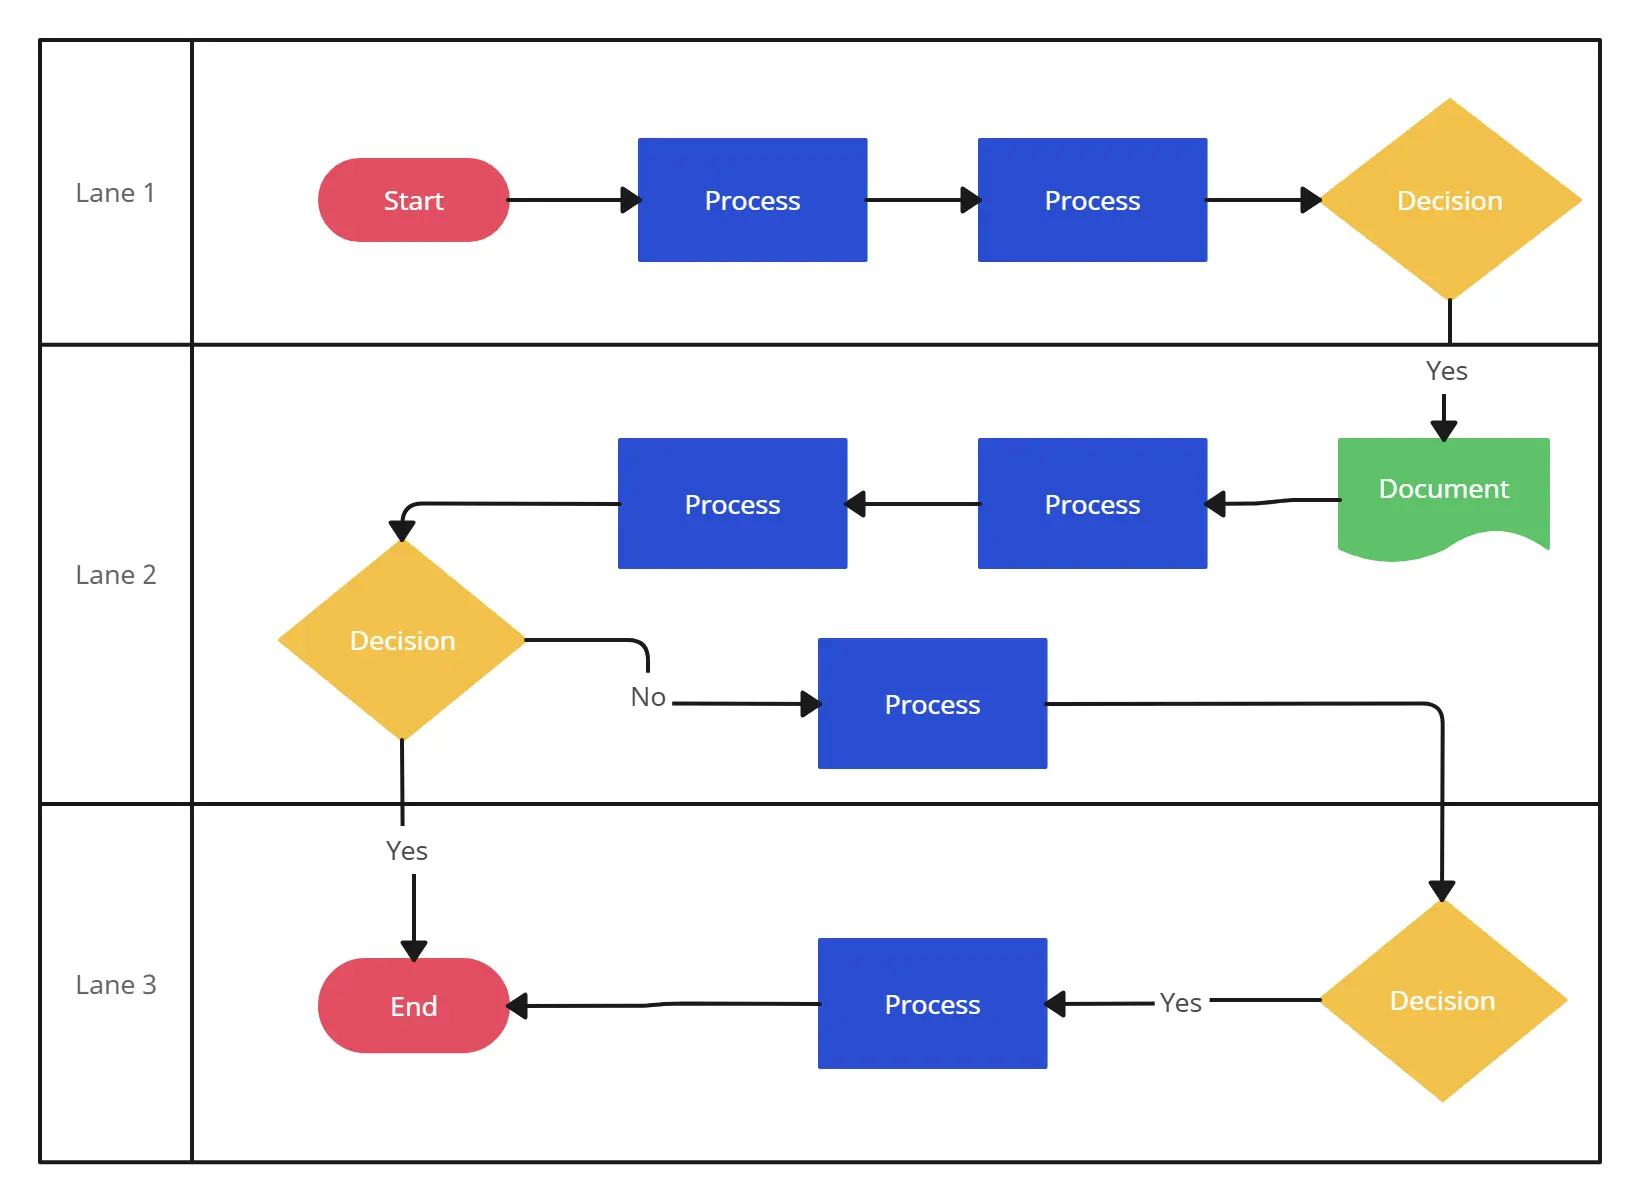
By classifying these processes, it is easier to examine the various ownership attributes of these processes, along with recognizing the correct classification. This helps to identify key elements in the process and makes it easier to check for errors, if any.
Our flowchart software makes it super easy to draw deployment flowcharts using the swim lanes object. To learn more check out using swim lanes for mapping processes.
Opportunity Flowcharts
The second most common type of flowcharts used in business analysis is the Opportunity flowcharts, which differentiate between Value added and non-value added services. This helps companies reduce overhead and unnecessary costs, by cutting out non-essential services that might bring loss to the company and increase in production costs.
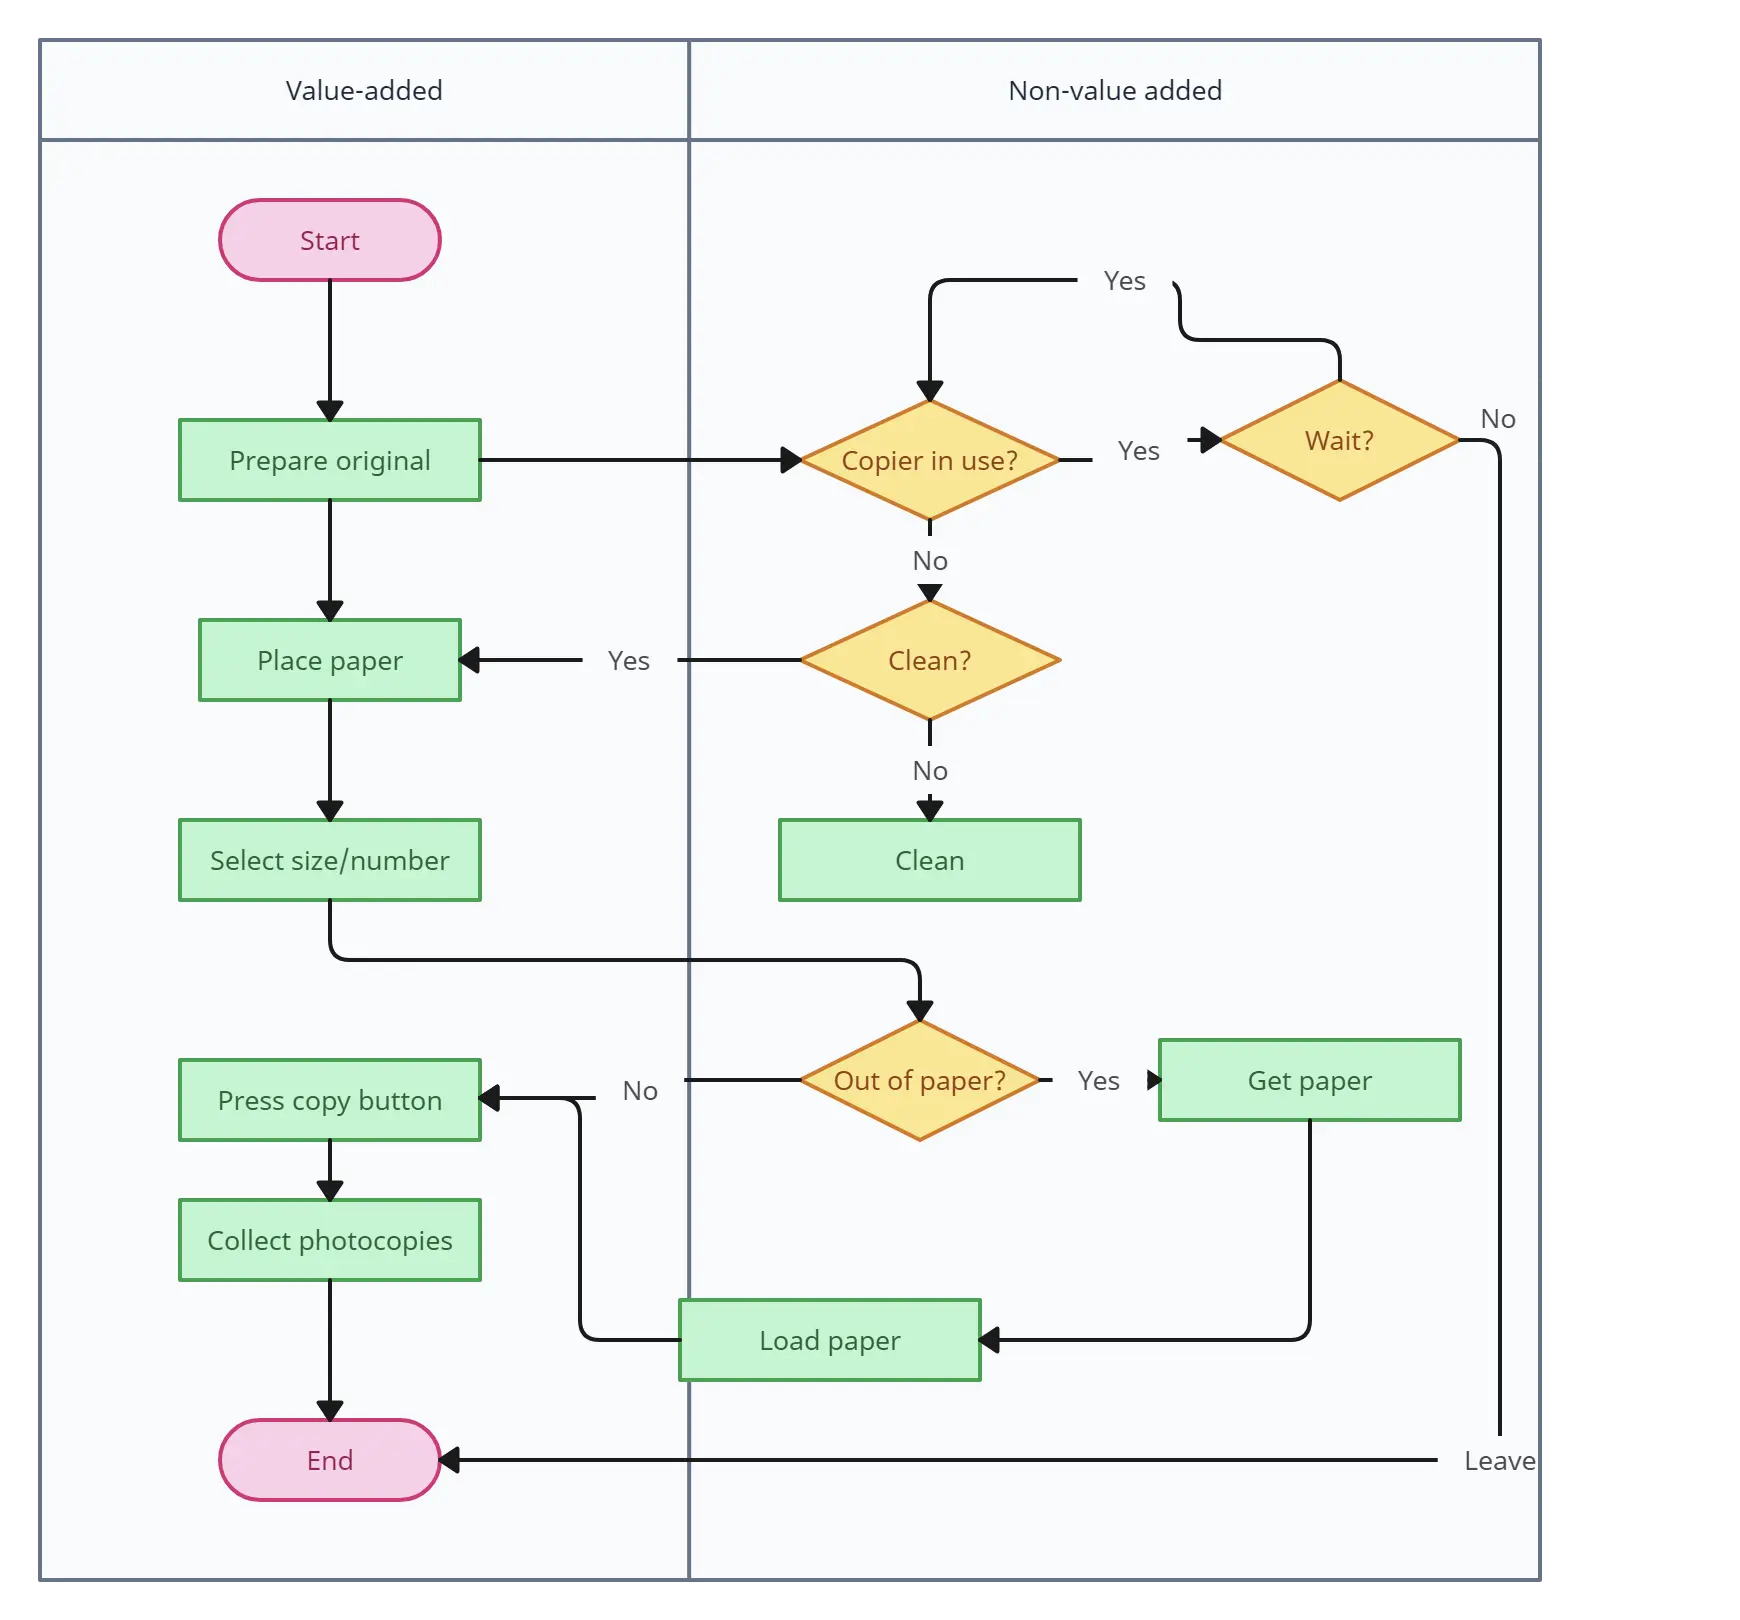
Opportunity flowchart are used to differ between value added services and non valued added services
For example, a company might need to reach a particular level of quality assurance in order to put their product on the market. However, they might go the extra mile and try to improve upon the quality of the product even further than the minimal requirement. This would be classified as a value added service, and can be cut if the company runs into loss.
However, we need to keep in mind that most opportunity flowcharts are looked at from a customer’s perspective, classifying value added and non value added processes accordingly.
Matrix Flowcharts
As compared to the former two types of flowcharts, Matrix flowcharts are relatively much more complex to construct and read, as they involve more than two attributes being assigned to a process.
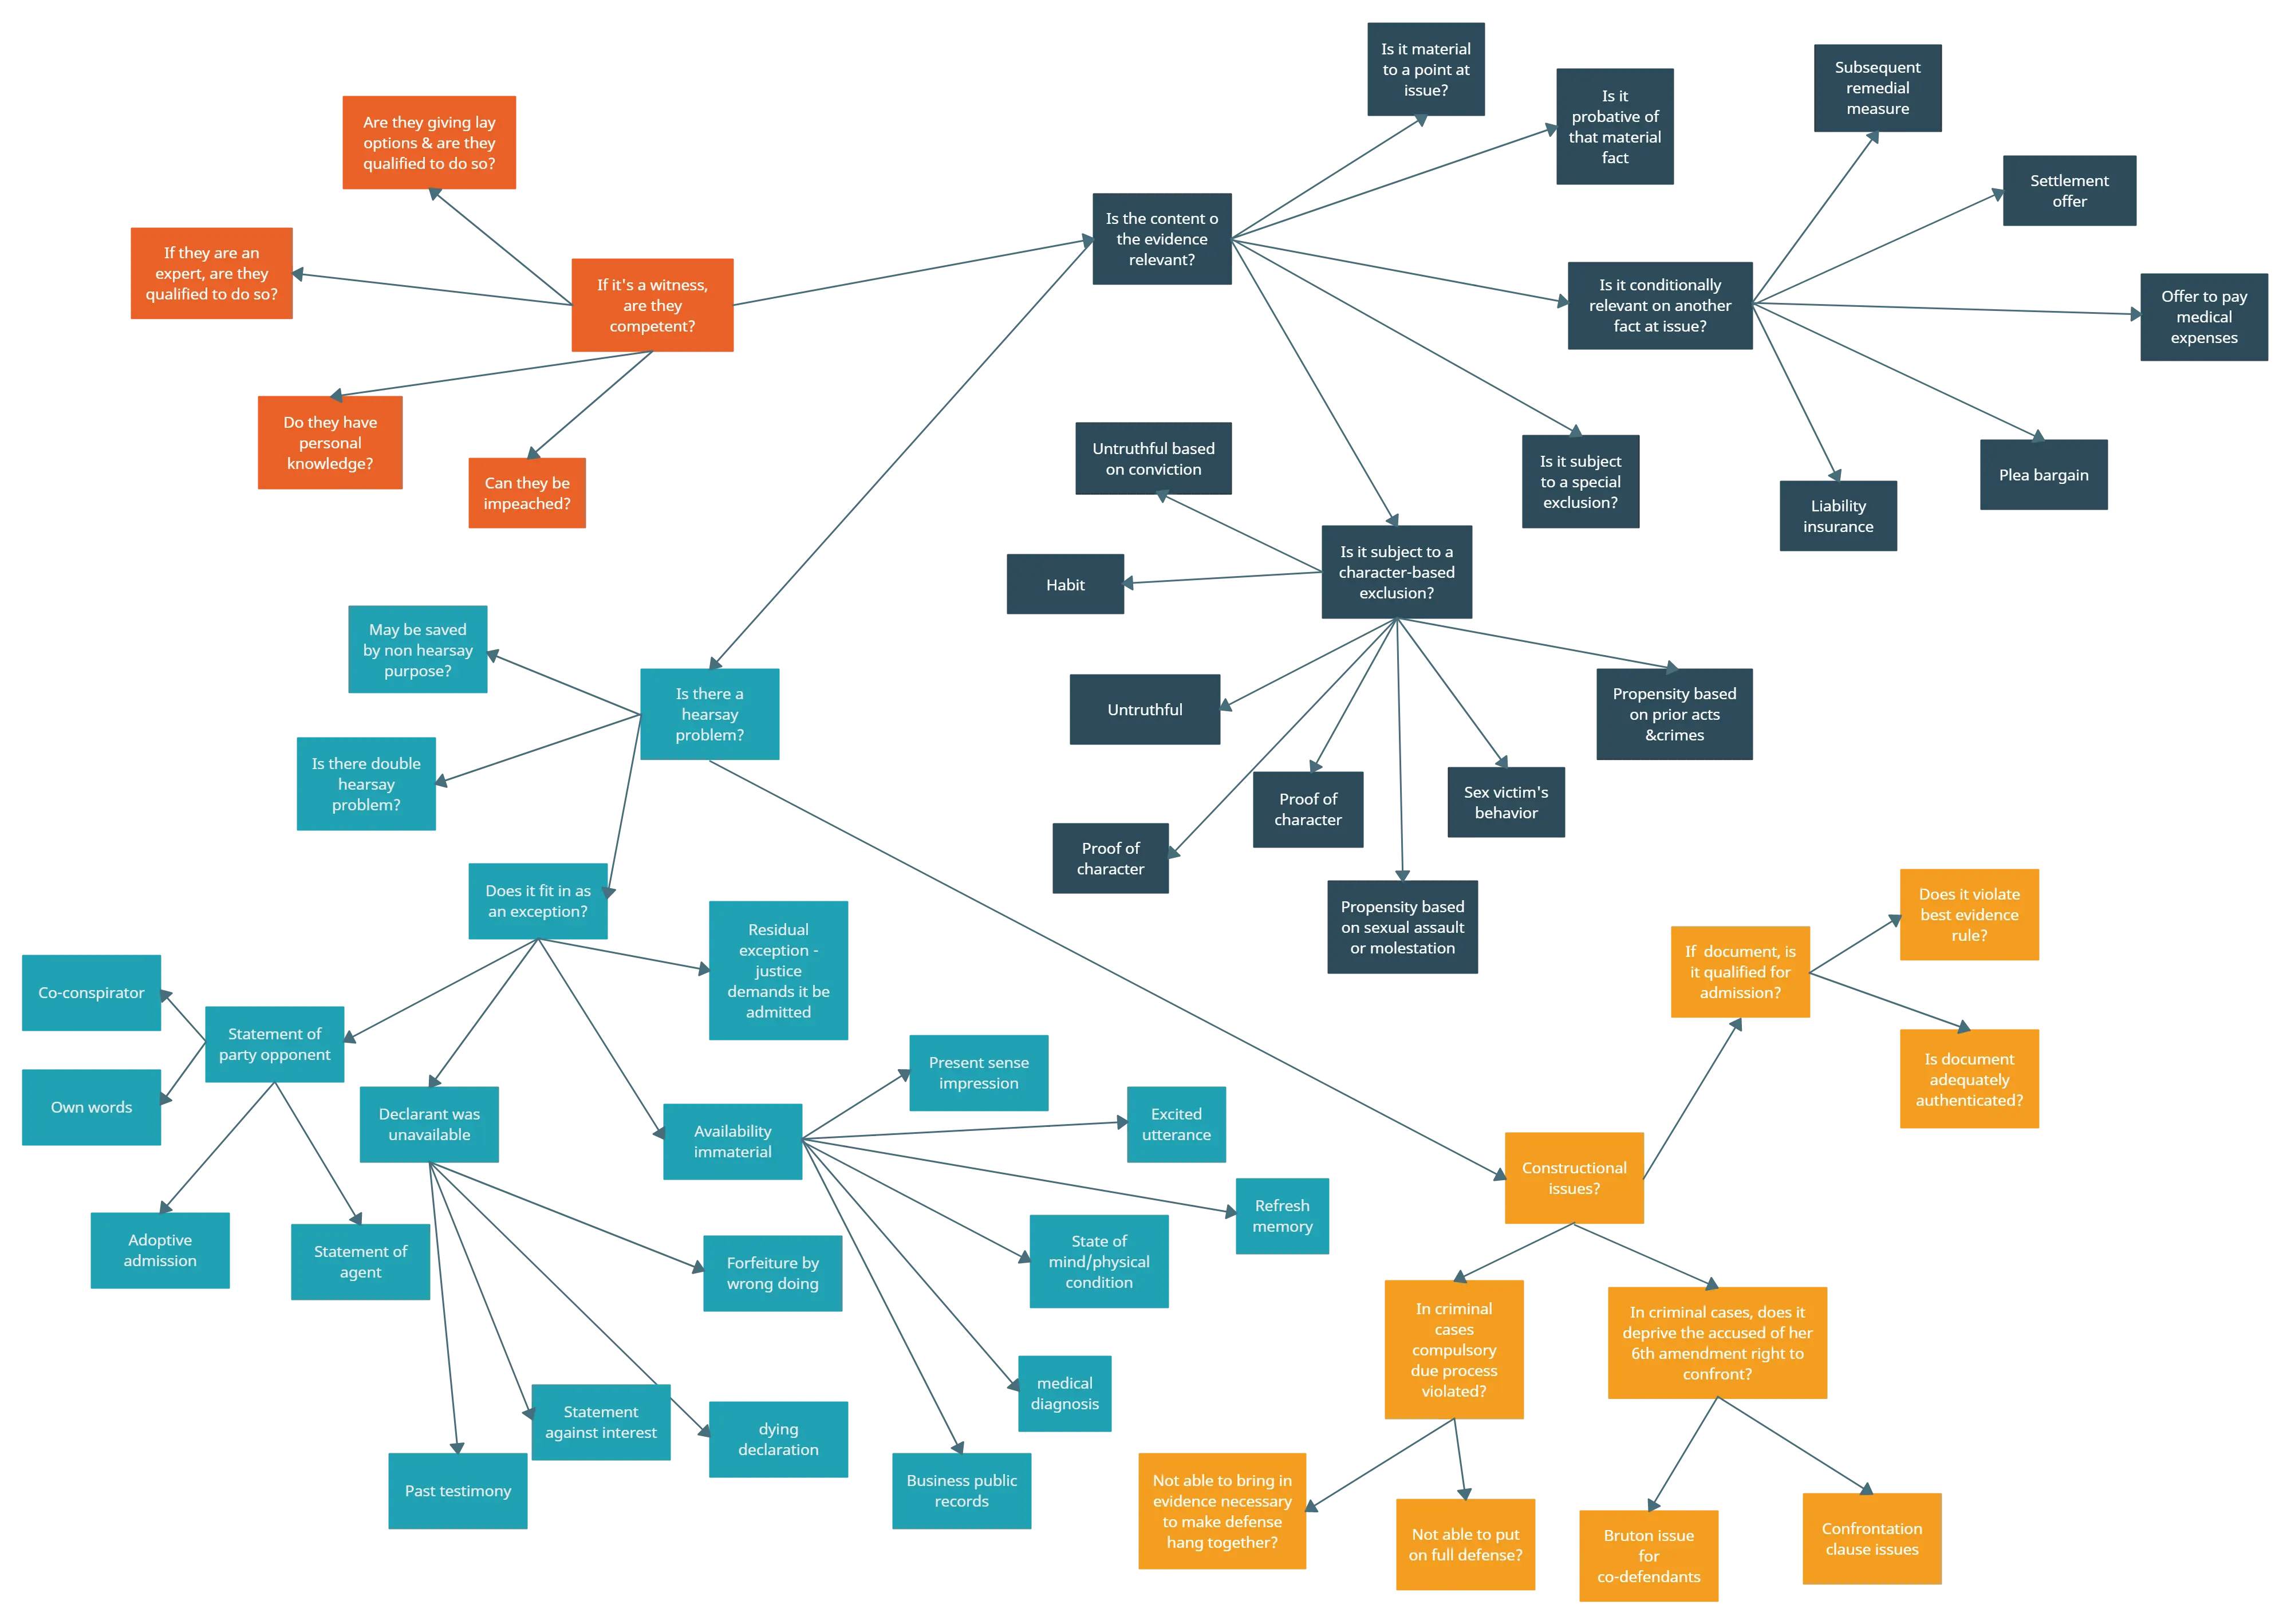
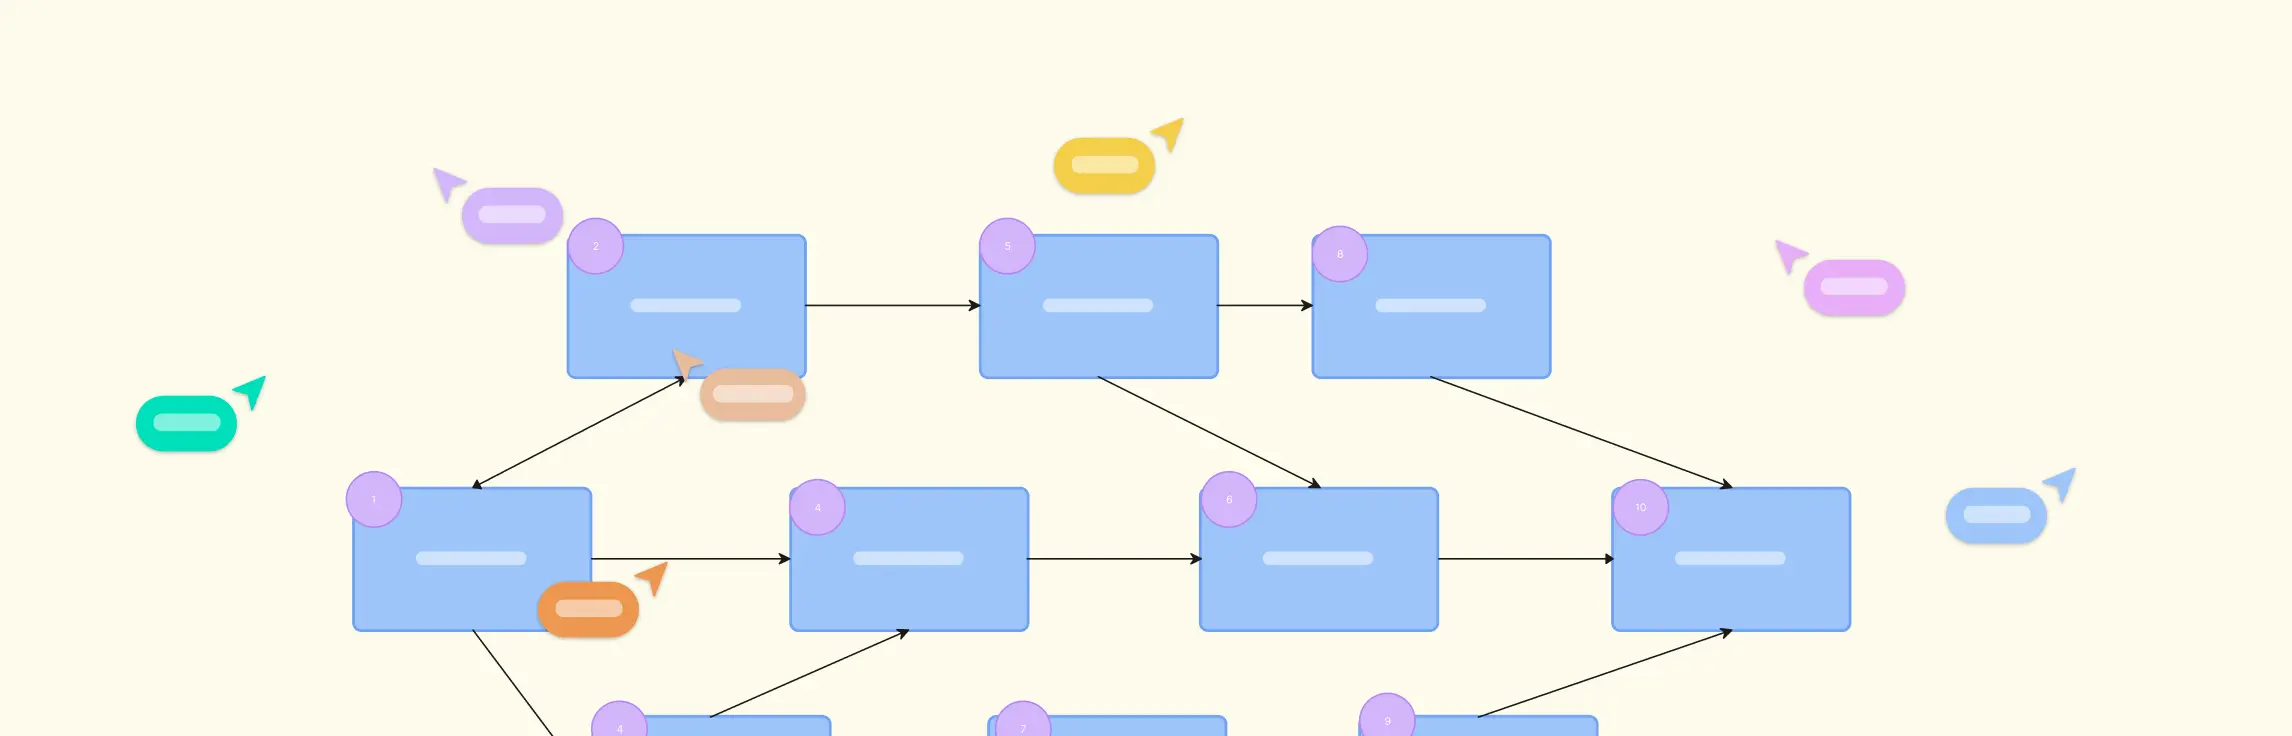
Matrix flowcharts are used to describe complex processes
An example of a matrix flowchart is given above. As you can see, there are multiple attributes assigned to a single process, and the processes are subdivided into more than one classification. While matrix flowcharts do help in increasing detail, they have certain disadvantages to them, which is why they are not as popular. For one, they are much more complex and harder to read, and these multiple attributes can easily be replaced by color coding the processes and labeling them. Two, they take up more space, due to the inclusion of minute sub-processes.
However, for describing complex processes which involve multiple attributes and stakeholders being assigned to a single process, matrix flowcharts do their job fairly well.
These are the three most common types of cross functional flowcharts. Notice that all of them have one thing in common; they are multidimensional. This is what differentiates cross functional flowcharts from classic flowcharts, and makes them useful in describing a multitude of processes.
FAQs About Cross Functional Flowcharts
How do I create a cross-functional flowchart step-by-step?
How can I effectively use cross-functional flowcharts to solve issues?
Are there any best practices or tips for creating clear and effective cross-functional flowcharts?
- Use consistent symbols and shapes to ensure clarity and consistency. Use arrows to indicate the flow of the process.
- Label the flowchart elements to avoid confusion.
- Keep it simple and focus on capturing the essential steps and interactions.
- Use color coding to make it easier to understand at a glance.
- Add annotations or notes to provide additional context or explanations.
What are the key elements of a cross-functional flowchart?
- Swimlanes
- Process steps
- Decision points
- Connectors
- Responsibilities
- Annotations and notes
- Legend or key