If you ever wondered how money habits and financial stress passes through generations, this comprehensive financial genogram (also called money genogram) guide is for you. It shows you how to create a financial genogram with helpful examples, templates, and tips. Perfect for estate planning, working with advisor or simply understand your financial root.
What Is a Financial Genogram
A financial genogram is a visual tool that shows how money flows within a family. It maps out family relationships but also adds details about financial support, conflicts, habits, and responsibilities between family members. Financial genograms help understand patterns of wealth accumulation, spending habits, debt, financial anxiety or success across generations.
Think of it like a family diagram with an extra layer focused on finances. Instead of just seeing who is related to whom, you can see things like:
- Who supports whom financially
- Where financial stress or conflict exists
- How money habits have been passed down over generations
- Who’s responsible for debts or assets
- Patterns of inheritance or financial dependency
This kind of map can help individuals and families understand the role money plays in their relationships. It’s especially useful for:
- Financial planners trying to create personalized plans
- Therapists working with clients on financial stress or family dynamics
- Estate planners figuring out how assets move between generations
- Individuals who want a better understanding of their family’s financial culture
By putting these patterns on paper, a financial genogram makes it easier to talk openly about money—something many families struggle with. It’s not about judgment—it’s about awareness and planning.
Key Elements of a Financial Genogram
A financial genogram blends family relationships with financial information, so it includes more than just names and connections. It helps tell the story of how money moves and influences relationships within a family. Here are the key parts that make up a financial genogram:
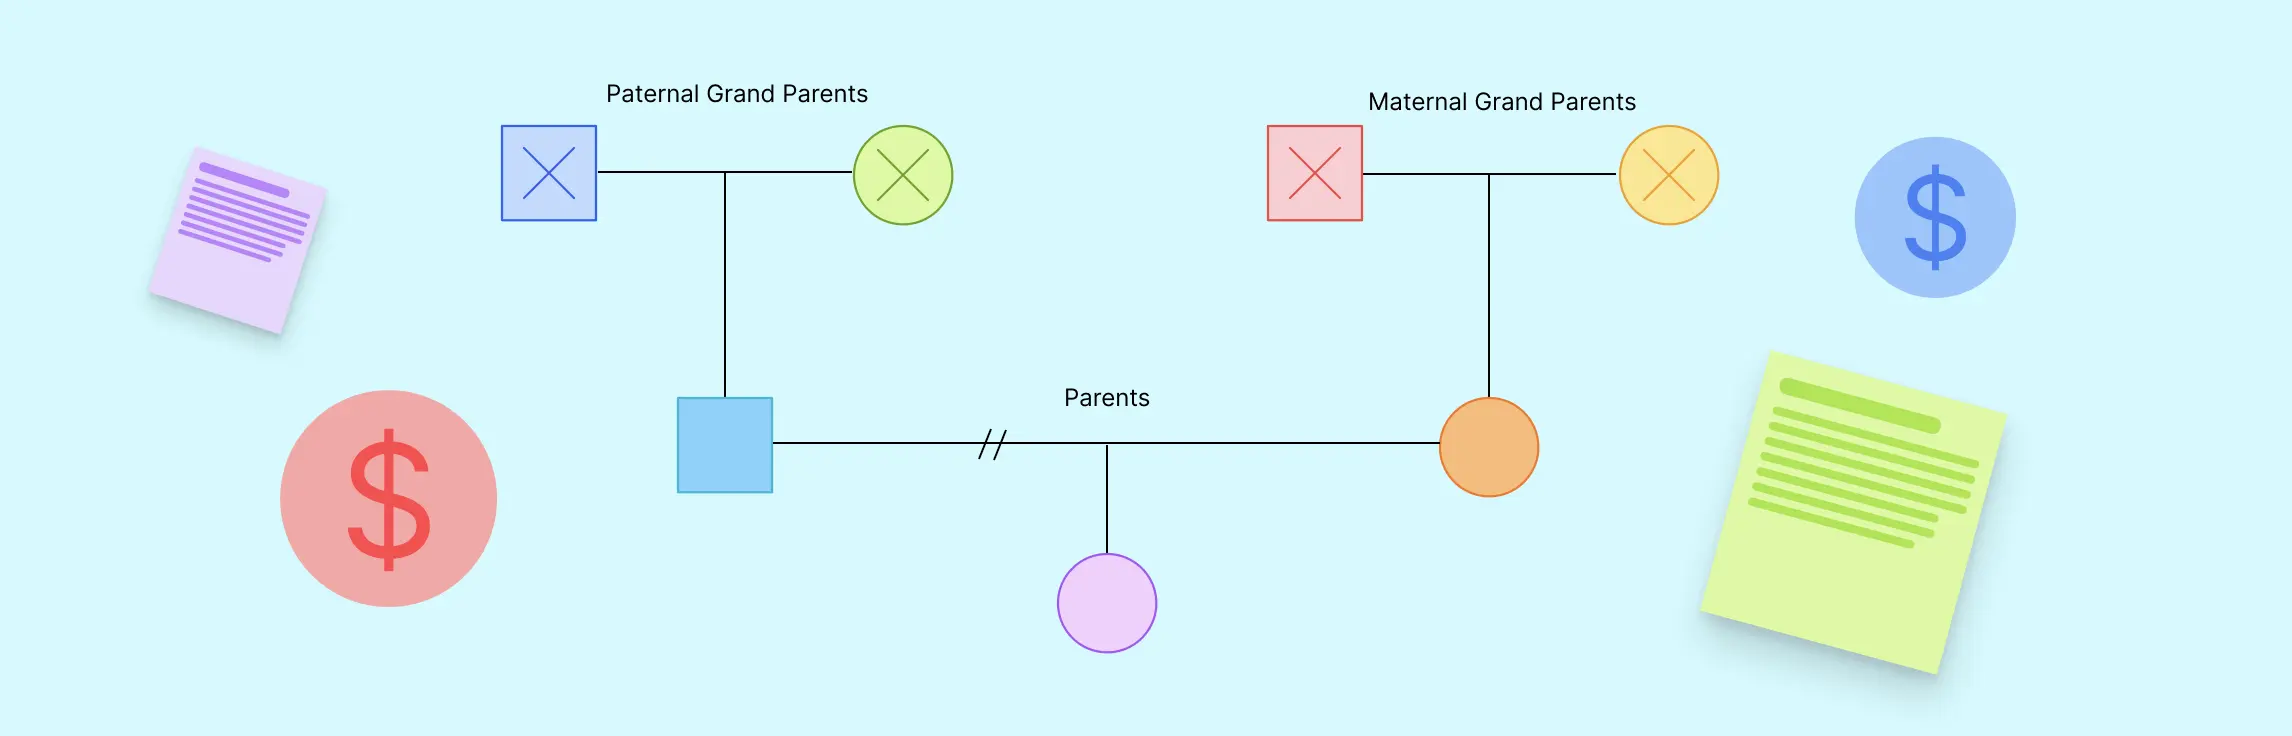
1. Family structure
At the heart of a financial genogram is a map of your family—just like a family tree. This shows who is related to whom and how. It includes:
- Parents, children, grandparents, and siblings
- Marriages, divorces, and step-relationships
- Living or deceased status
This part lays the foundation for understanding who is involved in the financial picture.
2. Financial connections
These are the lines or arrows that show how money flows between people. For example:
- One person financially supports another (like parents paying for college or an adult child helping an elderly parent)
- There’s shared financial responsibility (like a joint mortgage or co-signed loan)
- Someone is financially dependent on someone else
- A person provides emotional or financial caregiving
These lines help show who is giving, receiving, or sharing money—and how those ties affect relationships.
3. Money habits and behaviors
You can add symbols or notes to show each person’s approach to money. For example:
- Good at saving or struggles with spending
- Carries high debt or manages money carefully
- Avoids financial conversations or feels anxiety about money
- Generous or controlling with finances
These patterns can reveal how financial habits are passed down or cause tension.
4. Financial stress or conflict
Sometimes money creates friction. A financial genogram can show areas of:
- Financial disagreements between family members
- Unequal distribution of inheritance or resources
- Resentment about support or lack of support
Recognizing these tensions can help families work through them or seek guidance.
5. Assets, debts, and inheritance
Some genograms include symbols for:
- Major assets (like homes or businesses)
- Debts or financial burdens
- Plans for inheritance or past estate transfers
This gives a fuller picture of a family’s financial health and history.
6. Important financial events
You can also note life events that impacted finances, such as:
- Bankruptcy
- Winning or losing a large sum of money
- Sudden job loss or career change
- Divorce settlements or inheritances
These events can shape a family’s financial story across generations.
How to Create a Financial Genogram
Creating a financial genogram might sound complicated, but it’s really just about telling your family’s money story in a visual way. You don’t need to include every single detail—just the relationships and financial patterns that matter most.
Step 1. Define the purpose
Before you begin, get clear on why you’re making the genogram.
Are you trying to:
- Understand how money affects your family relationships?
- Prepare for estate or inheritance planning?
- Help a client manage caregiving responsibilities?
- Explore financial stress in therapy?
Knowing your purpose helps you decide what kind of information to include and how deep to go.
Step 2. Gather family and financial information
Start by collecting details about your family structure and money-related connections. This can include:
- Names, ages, and relationships (parents, siblings, grandparents, etc.)
- Marriages, divorces, and blended family dynamics
- Who provides or receives financial support
- Big financial events (like job loss, inheritance, or debt)
- Individual money habits or behaviors (e.g., saver, spender, anxious about money)
It’s okay if you don’t have every detail. Focus on what you do know and what’s most relevant to your goal. Additionally you can use genogram questions when you interview family members to gather more details.
Step 3. Choose a format or tool
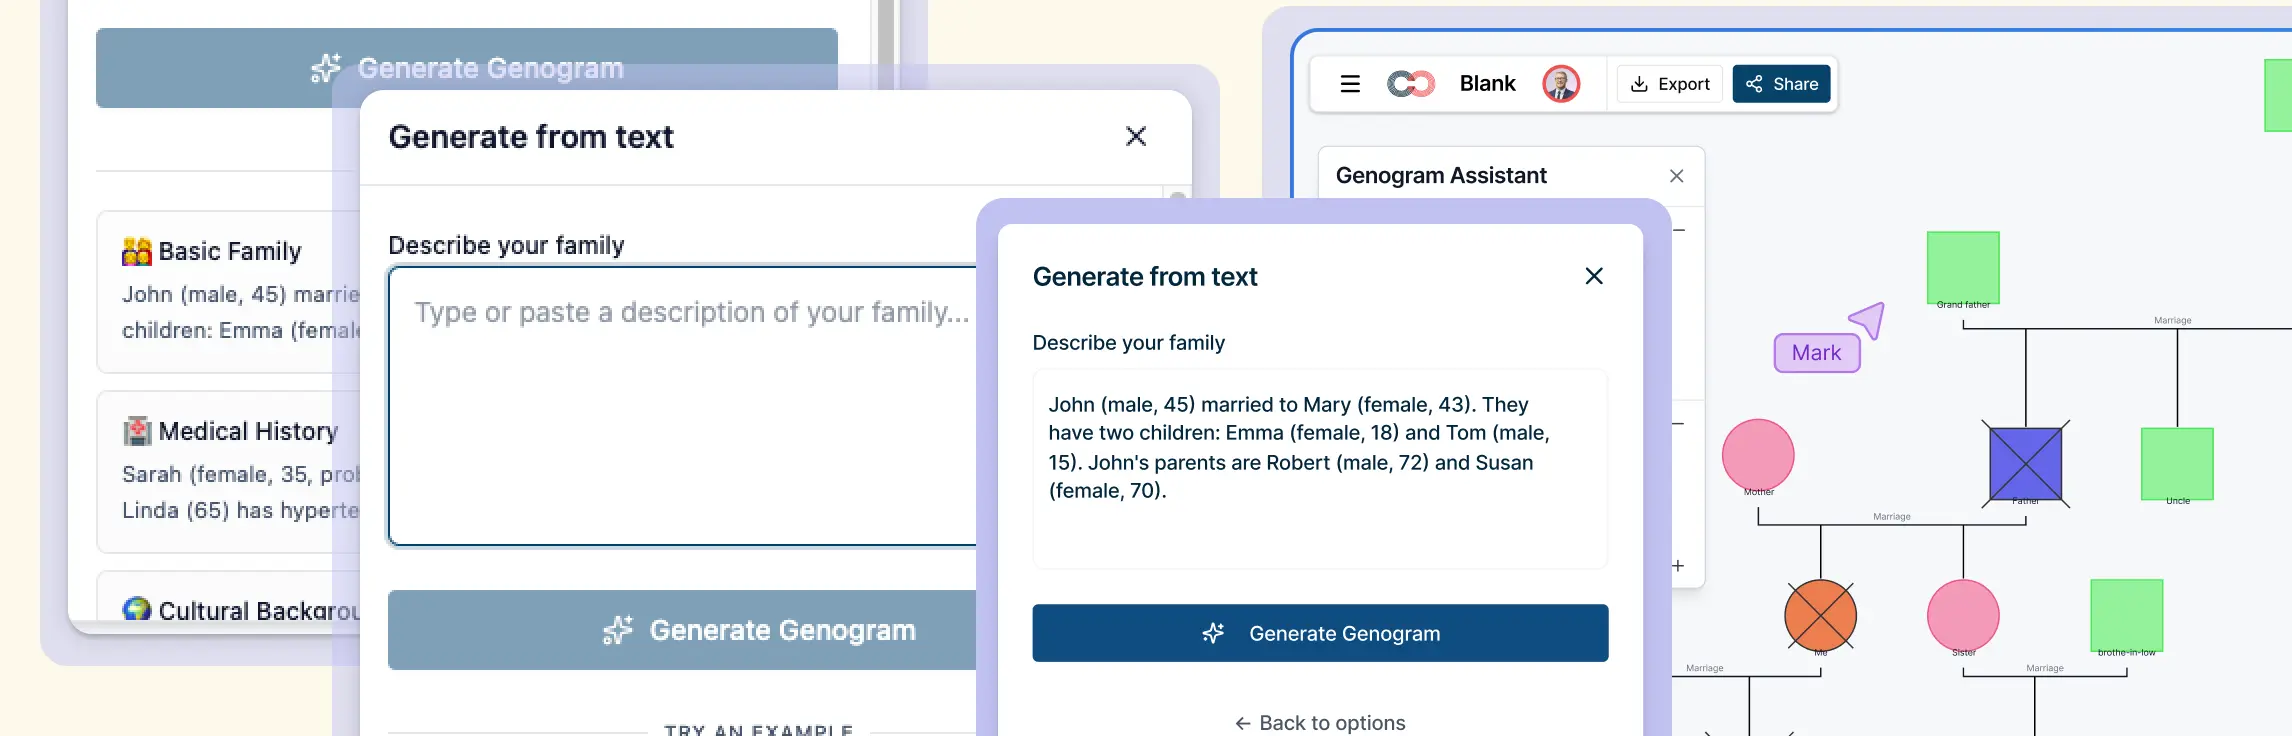
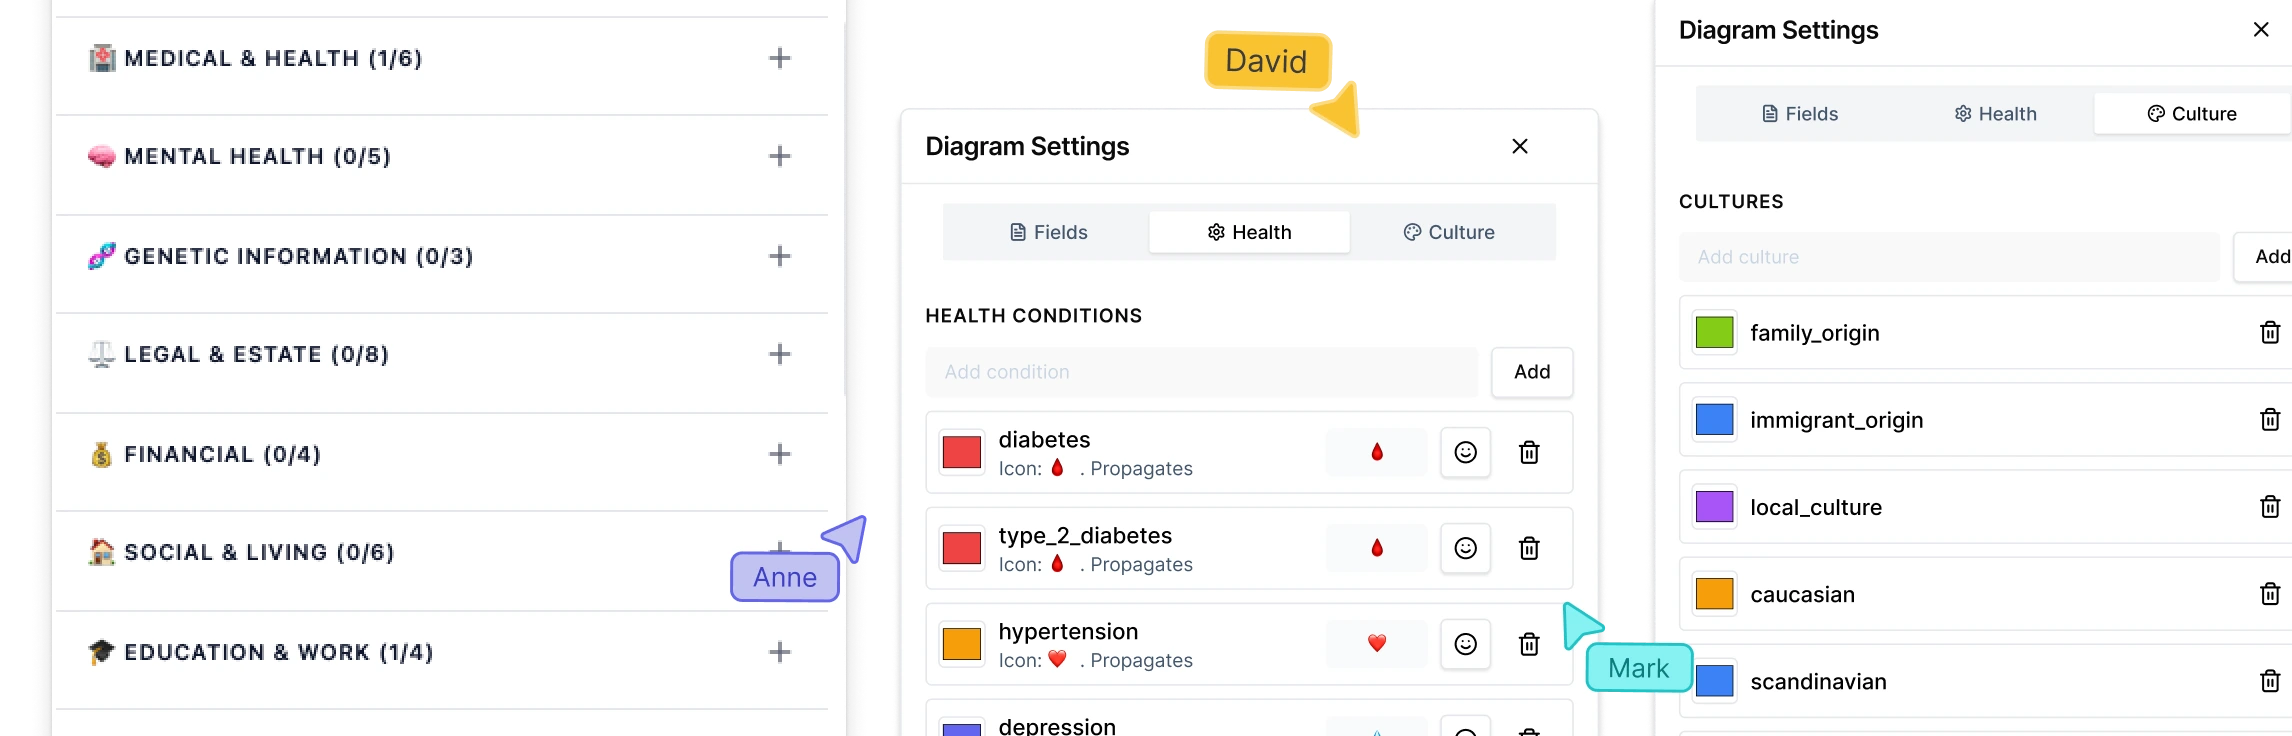
You can create a financial genogram by hand on paper, but using a free genogram maker can make it much easier to organize and update.
Creately is a user-friendly diagramming tool that’s perfect for this. It offers ready-made genogram templates and built-in shapes to map out relationships and financial ties. You can drag and drop elements, add notes, and even collaborate with others if you’re working with a planner or therapist.
Using a digital format also helps keep your genogram clear, neat, and easy to update over time.
Step 4. Map relationships and financial ties
Now start building your genogram:
Use genogram symbols (like squares and circles) to represent people
Draw lines to show relationships (marriage, siblings, parent-child)
Add arrows or symbols to show financial connections:
- Who supports whom
- Shared finances or debts
- Dependency or financial caregiving
Use colors or labels to show things like financial stress, inheritance, or money habits
Keep it simple and focused. You can always add more detail later.
Step 5. Interpret the diagram
Once your genogram is complete, take a step back and look for patterns or insights:
- Are certain people financially supporting many others?
- Are money habits passed down from one generation to the next?
- Are there signs of stress or conflict tied to finances?
- Is financial responsibility shared fairly—or not?
If you’re working with a financial planner, counselor, or therapist, this diagram can lead to deeper conversations and better planning.
Financial Genogram Examples
To help you get started, we’ve outlined 10 financial genogram examples that can be customized to suit your needs. Each template serves a different purpose, from mapping out financial support roles to tracking inheritance patterns.
1. Basic financial support genogram
Shows a simple family structure with one or two key financial support lines, such as parents supporting adult children or vice versa.
Use for: Identifying dependency or financial caregiving roles.


2. Multi-generational financial habits genogram
Includes three or more generations and highlights patterns like saving, debt, risk-taking, or avoidance of financial talk.
Use for: Understanding how financial behaviors are passed down.

3. Blended family financial connections
Maps out step-parents, ex-partners, and shared children, showing who supports whom financially and where financial boundaries may blur.
Use for: Planning or counseling in complex family setups.

4. High-conflict financial genogram
Highlights strained financial relationships, disputes over inheritance, financial control, or unresolved debt issues between family members.
Use for: Therapy or mediation settings.

5. Estate planning genogram
Includes current family relationships and future asset distribution plans, with visual cues showing who is set to inherit what.
Use for: Estate and legacy planning.

6. Business-owning family genogram
Shows ownership, roles, and income flow from a family business, including salary, shares, or profit-sharing among relatives.
Use for: Business succession or conflict resolution.

7. Sandwich generation genogram
Visualizes someone financially supporting both aging parents and dependent children, often highlighting stress points or resource limits.
Use for: Financial planning and emotional support mapping.

8. Debt and burden-focused genogram
Tracks debt responsibility, co-signed loans, or family members who have taken on debt to support others.
Use for: Credit or financial recovery planning.

Why Use a Financial Genogram?
A financial genogram gives a clear picture of how finances connect people in a family—across generations. Whether you’re planning for the future or trying to solve a current issue, a financial genogram can offer real insights. Here’s why it’s worth using:
1. It helps you see financial patterns across generations
Money habits—like saving, overspending, or avoiding financial talk—are often passed down. A financial genogram can show how these patterns started and where they continue. This can help individuals break harmful cycles or strengthen positive ones.
2. It shows where financial support and stress exist
The diagram makes it easy to see who depends on whom financially, who provides support, and where pressure might be building. For example, it may show an adult child supporting both parents and their own kids, highlighting potential financial strain.
3. It helps with open conversations about money
Families often avoid talking about finances, especially when it’s uncomfortable. A financial genogram offers a way to start those conversations more objectively, with a visual map that focuses on understanding—not blaming.
4. It supports better financial planning
Financial advisors and planners use genograms to create more accurate and personalized plans. Understanding family roles and money ties helps them give better advice around budgeting, retirement, inheritance, or caregiving responsibilities.
5. It’s useful in therapy and counseling
Therapists—especially those working with families or couples—can use financial genograms to explore how money affects relationships. It helps uncover hidden stressors, power imbalances, or unspoken expectations that impact emotional well-being.
6. It helps with estate and inheritance planning
If you’re trying to plan for the future—like who will inherit what, or how to avoid conflict later—a financial genogram can clarify the relationships and highlight any potential challenges.
7. It brings clarity to complex family finances
In blended families, families with shared businesses, or those managing debt and assets across multiple generations, financial genograms can make things clearer and easier to manage.
References
Holden, C.L. and Jeanfreau, M. (2023). The Self-Reflective Financial Therapist: Creating a Financial Genogram. Journal of financial therapy, 14(2). doi:https://doi.org/10.4148/1944-9771.1339.
Joseph, B., Dickenson, S., McCall, A. and Roga, E. (2022). Exploring the Therapeutic Effectiveness of Genograms in Family Therapy: A Literature Review. The Family Journal, 31(1), pp.21–30. doi:https://doi.org/10.1177/10664807221104133.
FAQs About Financial Genograms
What is the difference between a traditional genogram and a financial genogram?
Do I need to include every family member in the financial genogram?
Can I use a financial genogram for financial therapy?
Can a financial genogram help with retirement or long-term planning?
How do I start creating a financial genogram?