Continuous improvement tools help teams understand processes, investigate problems, test changes, and measure whether those changes work. This guide covers 18 practical methods, frameworks, and visual tools—from PDCA and Lean to fishbone diagrams and control charts—and explains when and how to use each one.
No single tool fits every improvement problem. Use process-mapping tools to understand a workflow, cause-analysis tools to investigate why a problem occurs, and data-analysis tools to evaluate performance. Choose according to the question you need to answer, the evidence available, and the scale of the change.
What Are Continuous Improvement Tools?
Continuous improvement tools are methods, frameworks, and visual techniques that help organizations understand processes, identify causes, prioritize opportunities, test changes, and monitor results. Many support incremental improvement, while structured methods such as PDCA and DMAIC can also guide larger changes. The ASQ quality tools directory groups tools by uses such as cause analysis, process analysis, data analysis, and decision-making. For the underlying principles, see our guide to continuous improvement.
Key aspects of continuous improvement tools
- Identify problems – They help you spot areas where things aren’t working well, whether that’s wasted time, resources, or recurring mistakes.
- Find root causes – Many tools focus on digging deeper to find the real cause of problems so that you’re solving the right issues instead of just fixing symptoms.
- Streamline processes – By mapping out workflows and removing unnecessary steps, these tools make processes faster and more efficient.
- Encourage teamwork – Continuous improvement often involves getting input from everyone in the organization, from the frontline workers to managers, creating a culture where everyone is looking for ways to improve.
- Measure progress – Data-oriented tools help teams compare results with a baseline and determine whether a change produced the intended effect.
18 Continuous Improvement Tools for Streamlined Processes
The following 18 continuous improvement tools address different stages of the improvement cycle. Some help visualize work, some diagnose causes, and others support implementation or measurement.
1. PDCA (Plan-Do-Check-Act)
The PDCA cycle is a four-step model for planning a change, testing it, evaluating the evidence, and acting on what was learned. PDCA is also called the Deming Cycle or Shewhart Cycle. Because the cycle repeats, teams can standardize a successful change or revise the plan when results do not meet the target.


How to use it
- Plan: Identify the problem or area for improvement, set clear goals, and create a step-by-step plan to test possible solutions.
- Do: Implement the plan on a small scale. Collect data and observe the results.
- Check: Review the data to see if the solution worked. Compare results to your goals and analyze what worked or didn’t.
- Act: If successful, apply the solution across the board. If not, return to the planning stage and try a new approach.
Why it helps
PDCA is a repeating cycle. Even when a test meets its target, teams can continue monitoring the process and look for another improvement opportunity. The method can help teams:
- Manage risk: Testing a change on a suitable scale can limit the effect of an unsuccessful idea.
- Encourage learning: Reviewing successful and unsuccessful tests builds evidence for future decisions.
- Support adaptation: Teams can repeat the cycle as operating conditions change.
2. Kanban
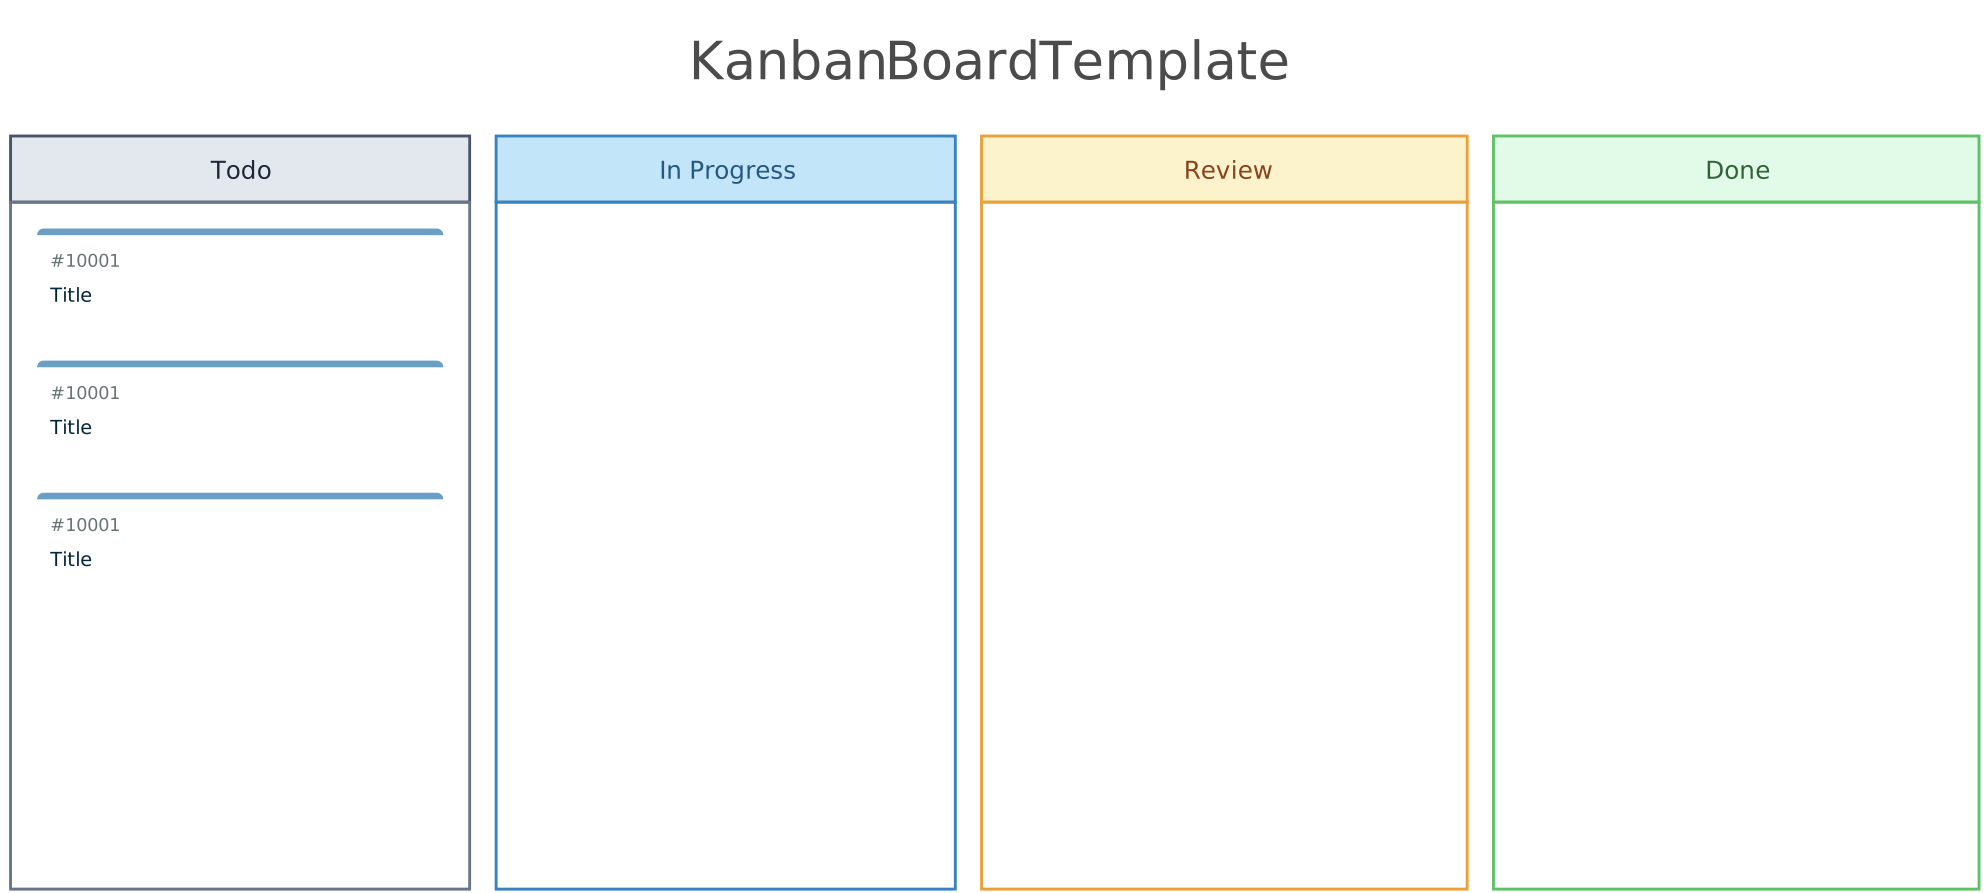
A Kanban board is a visual management tool that shows work items as they move through workflow stages. Kanban uses work-in-progress (WIP) limits to expose congestion and encourage teams to finish work before starting more. The board makes flow and blocked work easier to discuss, but teams still need to investigate and address the causes of delays.
How to use it
- Create a board: Create a Kanban board (physical or digital) and divide it into columns that represent different stages of work, such as “To Do,” “In Progress,” and “Done.”
- Add tasks: Write each task on a card with a clear title or description and place it in the appropriate column based on its current status.
- Limit WIP: Set a limit on how many tasks can be in each column at one time to prevent bottlenecks and ensure a steady workflow.
- Move tasks: As work progresses, move cards from one column to the next. For example, move a task to “In Progress” when it starts and to “Done” when it’s completed. This gives a clear view of progress and helps identify any delays.
Why it helps
- Clarity: The visual nature of Kanban makes it easy for everyone to see the status of tasks at a glance.
- Focus: By limiting WIP, teams can concentrate on completing tasks rather than getting overwhelmed by too many projects at once.
- Flexibility: Kanban allows teams to adapt to changes quickly, adding or adjusting tasks as priorities shift.
- Shared visibility: Teams can discuss work from a common view of its current status.
3. 5S System
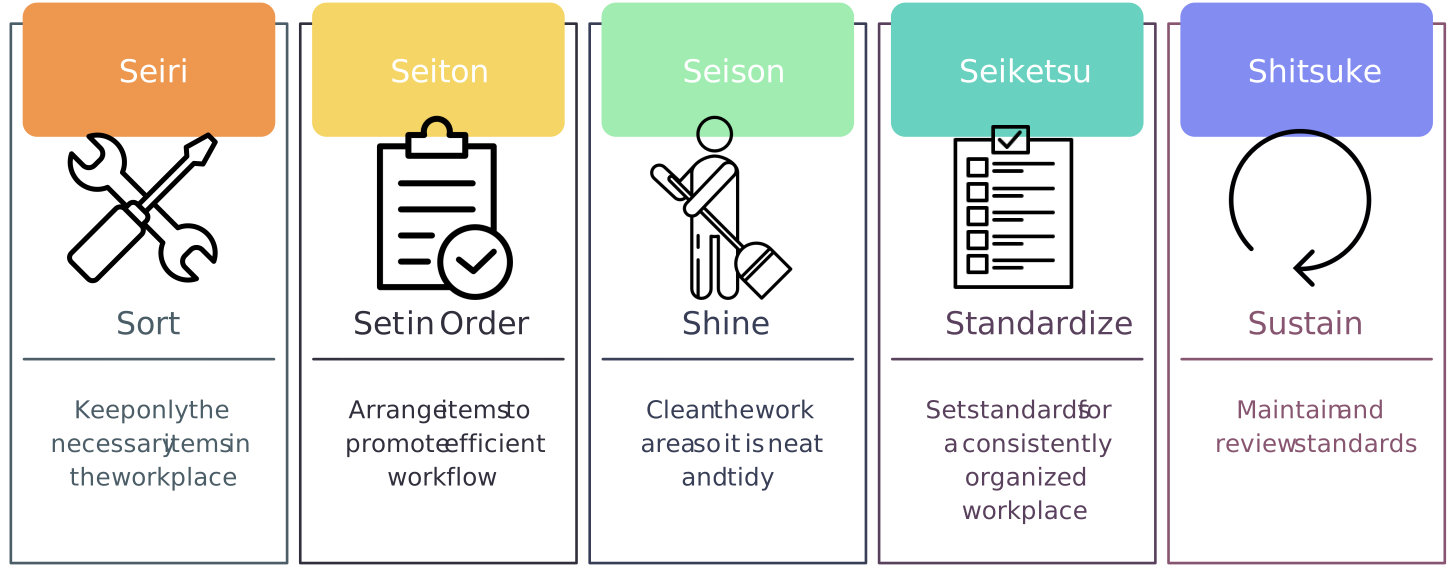
5S methodology is a continuous improvement tool that is used in workplace organization to improve efficiency and maintain cleanliness. It’s based on five key principles, known as the 5 S’s: Sort, Set in order, Shine, Standardize, and Sustain. By following these principles, teams can create a more organized, safe, and productive work environment.
How to use it
- Sort: Remove unnecessary items from the workspace. Identify essential items and discard or relocate anything that isn’t needed. This decluttering reduces distractions and helps focus on important tasks.
- Set in order: Organize the remaining items for easy access. Use labels and designated storage areas to keep tools and materials in their proper place, allowing team members to find what they need quickly.
- Shine: Regularly clean and maintain the workspace to keep it tidy and safe. This includes cleaning surfaces, tools, and equipment, helping to prevent accidents and equipment issues.
- Standardize: Develop routines and guidelines for maintaining organization and cleanliness. Create checklists or visual controls to ensure consistency and establish clear expectations for the team.
- Sustain: Encourage team members to make 5S a daily practice. Continuously look for ways to improve and regularly review the workspace to maintain efficiency, making 5S a habit rather than a one-time effort.
Why it helps
- Improved efficiency: A well-organized workspace allows team members to find tools and materials quickly.
- Enhanced safety: Regular cleaning and organization reduce hazards and accidents.
- Increased productivity: Less time spent searching for items means more time focused on work.
- More usable workspace: A clean, organized environment can make tools and materials easier to access.
- Consistency in processes: Standardized practices help maintain order and efficiency over time.
4. Gemba Walks
A Gemba Walk is an essential practice where managers or leaders go to the actual place where work is happening, known as the “Gemba.” The term “Gemba” comes from Japanese and means “the real place.” This practice allows leaders to observe operations firsthand, understand the challenges employees face, and identify areas for improvement. By stepping away from their desks and into the work environment, leaders gain valuable insights that can lead to better decision-making and more effective solutions.

How to use it
- Visit the Gemba: Go to the location where the work is being done, whether it’s the shop floor, office, or another area.
- Observe: Watch how work is performed without interrupting the employees. Take notes on what’s working well and what areas could be improved. You can use a Gemba walk checklist here.
- Ask questions: Engage with employees by asking about the challenges they face. Listen carefully to their insights, but avoid giving immediate solutions to encourage open dialogue.
- Reflect and act: After the walk, analyze your observations and discuss potential improvements with the team. Collaborate to develop actionable plans based on the findings.
Why it helps
- Improved understanding: Leaders gain firsthand knowledge of daily operations and challenges.
- Enhanced communication: Building relationships with employees fosters trust and collaboration.
- Employee input: Involving staff brings firsthand operational knowledge into improvement discussions.
- Identifying waste: Observing processes helps pinpoint inefficiencies and areas for streamlining.
5. 5 Whys
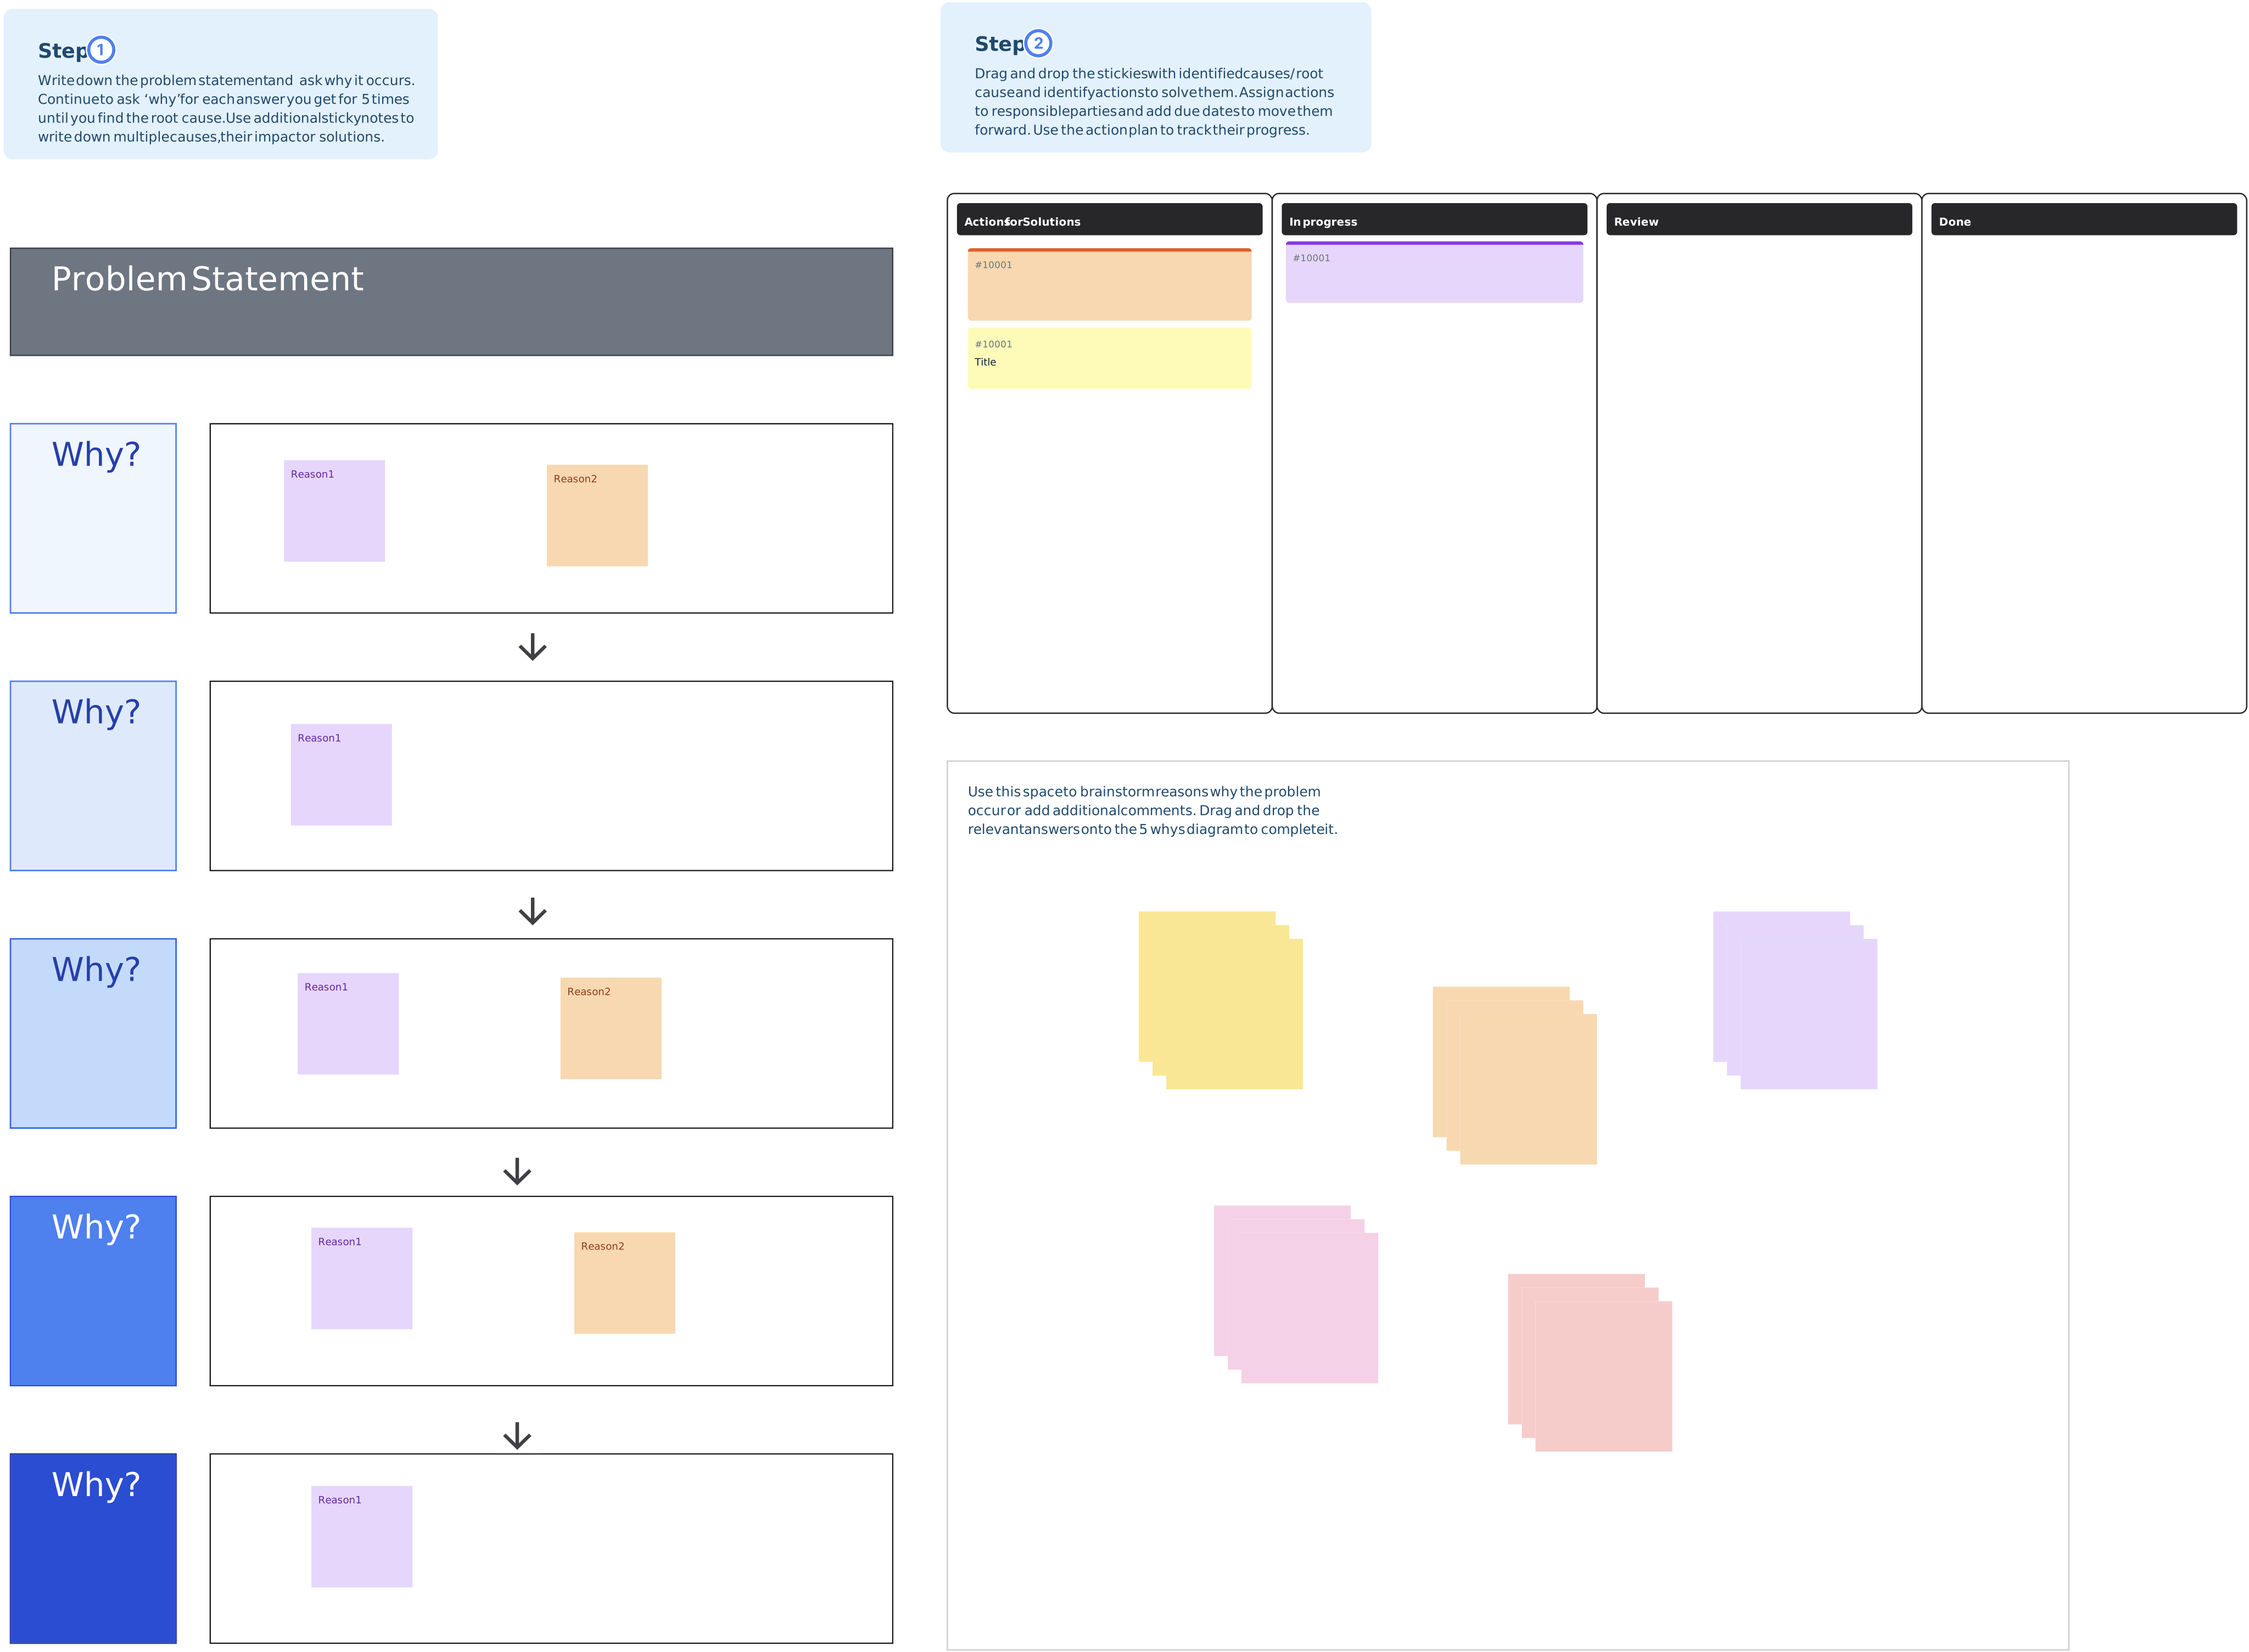
The 5 Whys is a straightforward and effective continuous improvement tool used for root cause analysis. Its purpose is to identify the underlying reasons for a problem by repeatedly asking the question “Why?” This method helps teams dig deeper into issues rather than just addressing the symptoms. By getting to the root cause, organizations can implement solutions that prevent problems from recurring, leading to more effective and lasting improvements.
How to use it
- State the problem: Clearly define the issue you’re facing. Make sure everyone involved understands what the problem is.
- Ask “Why?”: Ask why the problem occurred, then use each evidence-based answer to form the next question. Five is a guideline rather than a required number. A 5 Whys analysis template can help the team document the chain of possible causes.
- Verify and address the cause: Check the suspected root cause against available evidence before selecting and testing a corrective action.
Why it helps
- Simplicity: The method is easy to understand and does not require statistical software.
- Focus on causes: It moves the discussion beyond symptoms toward causes that can be investigated.
- Encourages collaboration: The process fosters teamwork and open discussion, helping to bring different perspectives into the analysis.
- Supports corrective action: Verified causes give teams a stronger basis for choosing and testing corrective actions.
6. Fishbone Diagram
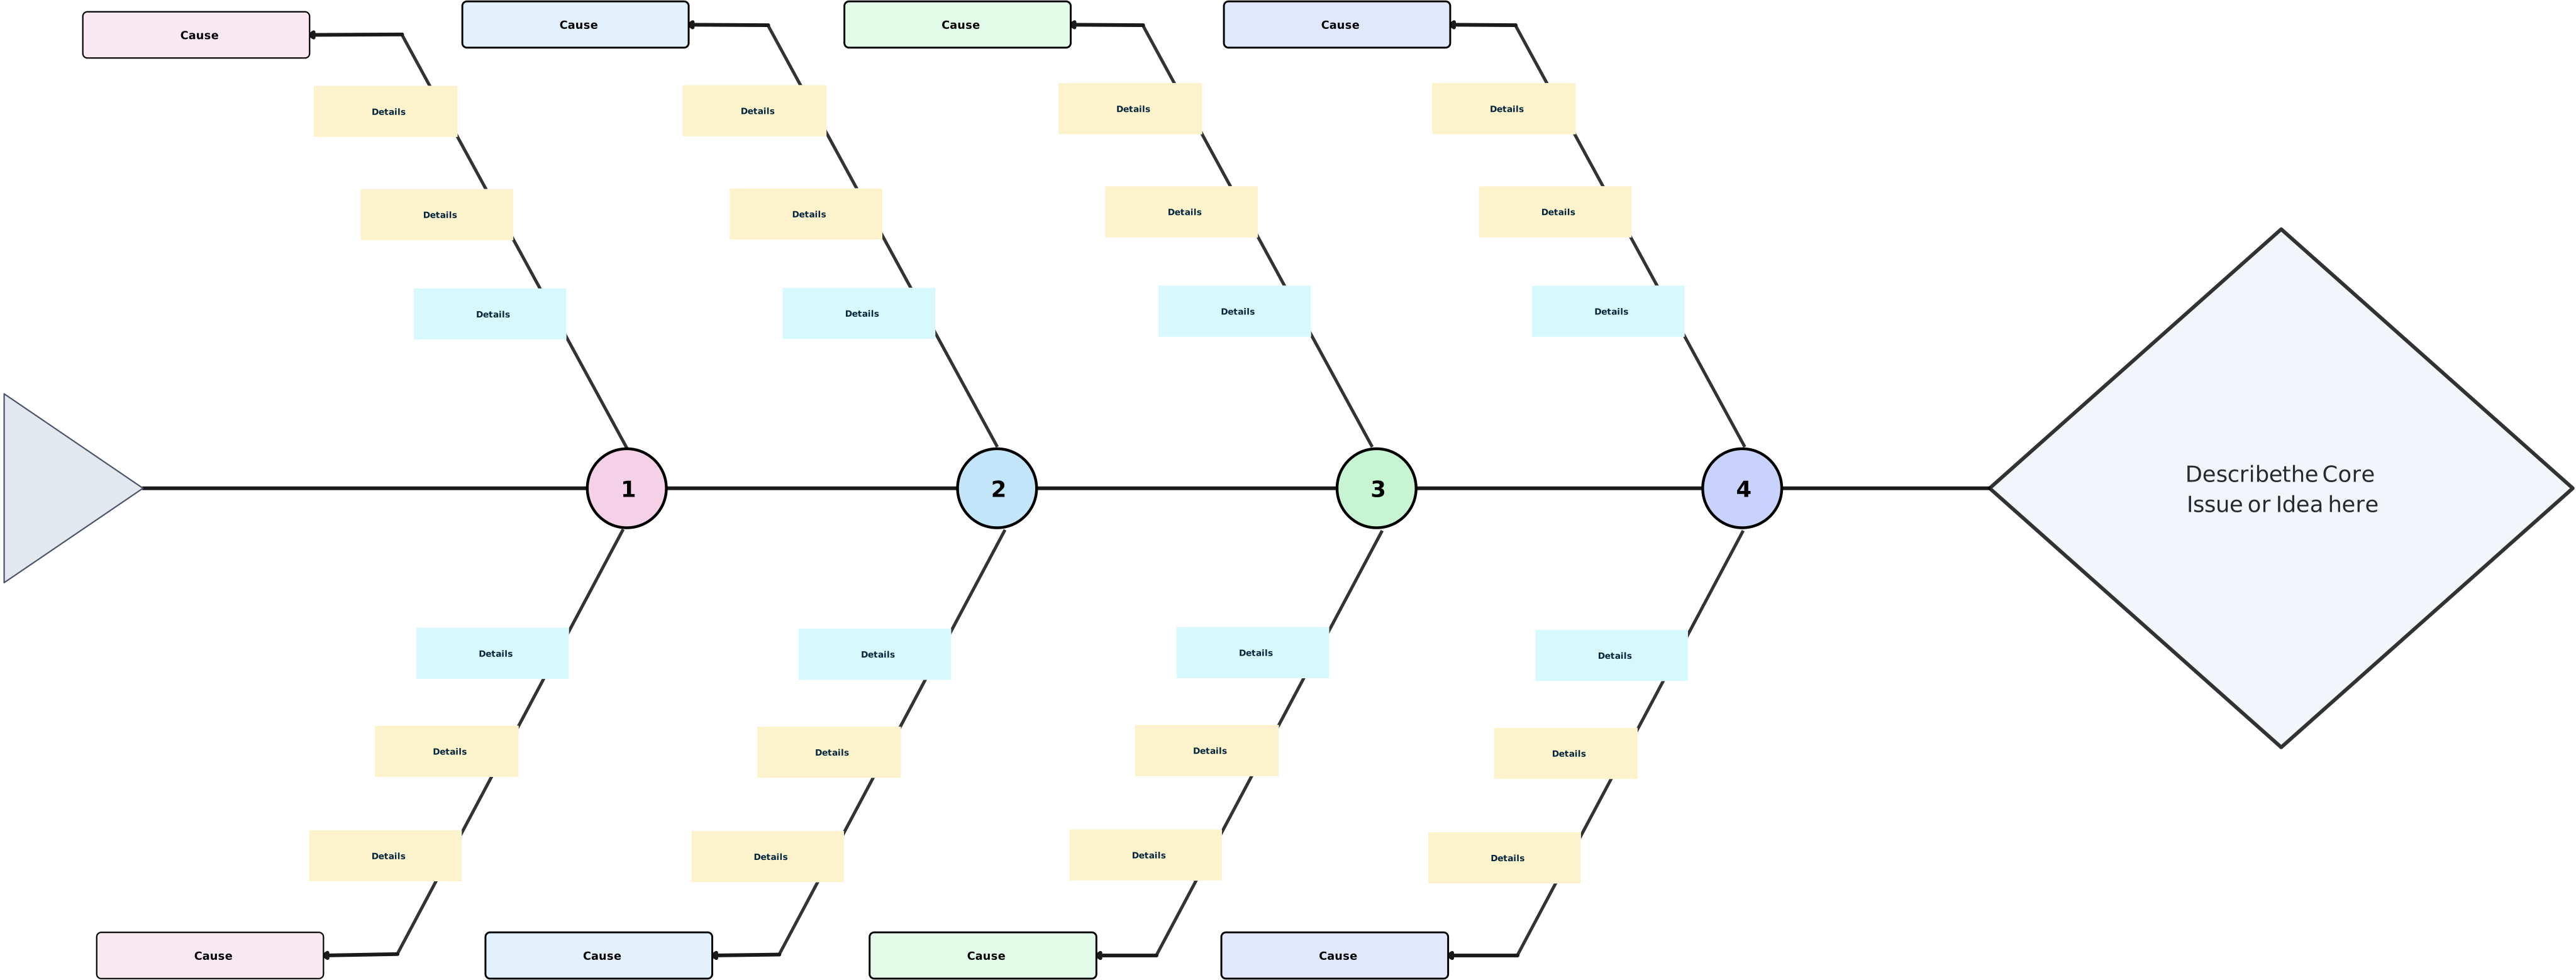
A fishbone diagram, also known as an Ishikawa or cause-and-effect diagram, helps teams identify and organize potential causes of a problem. It resembles a fish skeleton, with the effect or problem at the head and categories of possible causes branching from the spine. The diagram supports structured investigation; it does not prove which cause is responsible.
How to use it
- Define the problem: Write the problem statement at the head of the diagram. This ensures that everyone is focused on the same issue.
- Identify categories: List major categories of potential causes. Common categories include People, Processes, Equipment, Materials, and Environment. Create a fishbone diagram to help organize the brainstorming process.
- Brainstorm causes: For each category, brainstorm specific factors that could contribute to the problem. Encourage team members to share their insights and experiences, then add these causes to the appropriate branches of the diagram.
- Analyze: Review the completed diagram together as a team. Focus on identifying the most likely causes that require further investigation and discussion to determine their impact on the problem.
Why it helps
- Visual organization: The diagram provides a clear visual representation of causes, making it easier to analyze complex issues.
- Comprehensive analysis: It encourages thorough exploration of all potential causes, reducing the likelihood of missing important factors.
- Team collaboration: Involving team members in the brainstorming process fosters teamwork and ensures diverse perspectives are considered.
- Structured approach: The diagram provides a systematic way to identify and prioritize causes, which can lead to more effective solutions.
7. Kaizen
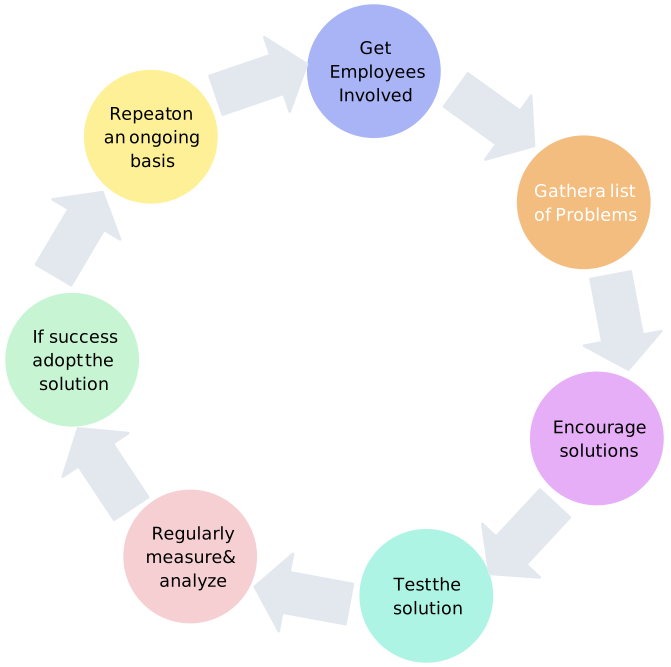
Kaizen methodology centers on continuous improvement through the involvement of people throughout an organization. The term is commonly translated as “change for the better.” Kaizen encourages teams to identify problems, test practical changes, and standardize improvements that are supported by evidence.
How to use it
- Encourage ideas: Create an open environment where employees feel comfortable suggesting small improvements. Encourage feedback and foster a culture where everyone’s input is valued.
- Implement changes: Quickly test and implement the suggested ideas in day-to-day operations. This might involve making small adjustments to workflows, processes, or tools that employees use.
- Review regularly: Continuously assess the impact of these small improvements. Regularly review how these changes contribute to overall efficiency and effectiveness, and look for opportunities to build on them over time.
Why it helps
- Engagement: Involving everyone in the improvement process boosts morale and fosters a sense of ownership among employees.
- Incremental learning: Small changes let teams evaluate results and build on useful improvements over time.
- Problem-solving culture: Encouraging employees to identify issues and suggest improvements fosters a proactive approach to problem-solving.
- Enhanced collaboration: Kaizen encourages teamwork and communication across departments, leading to a more unified and effective organization.
8. Value Stream Mapping
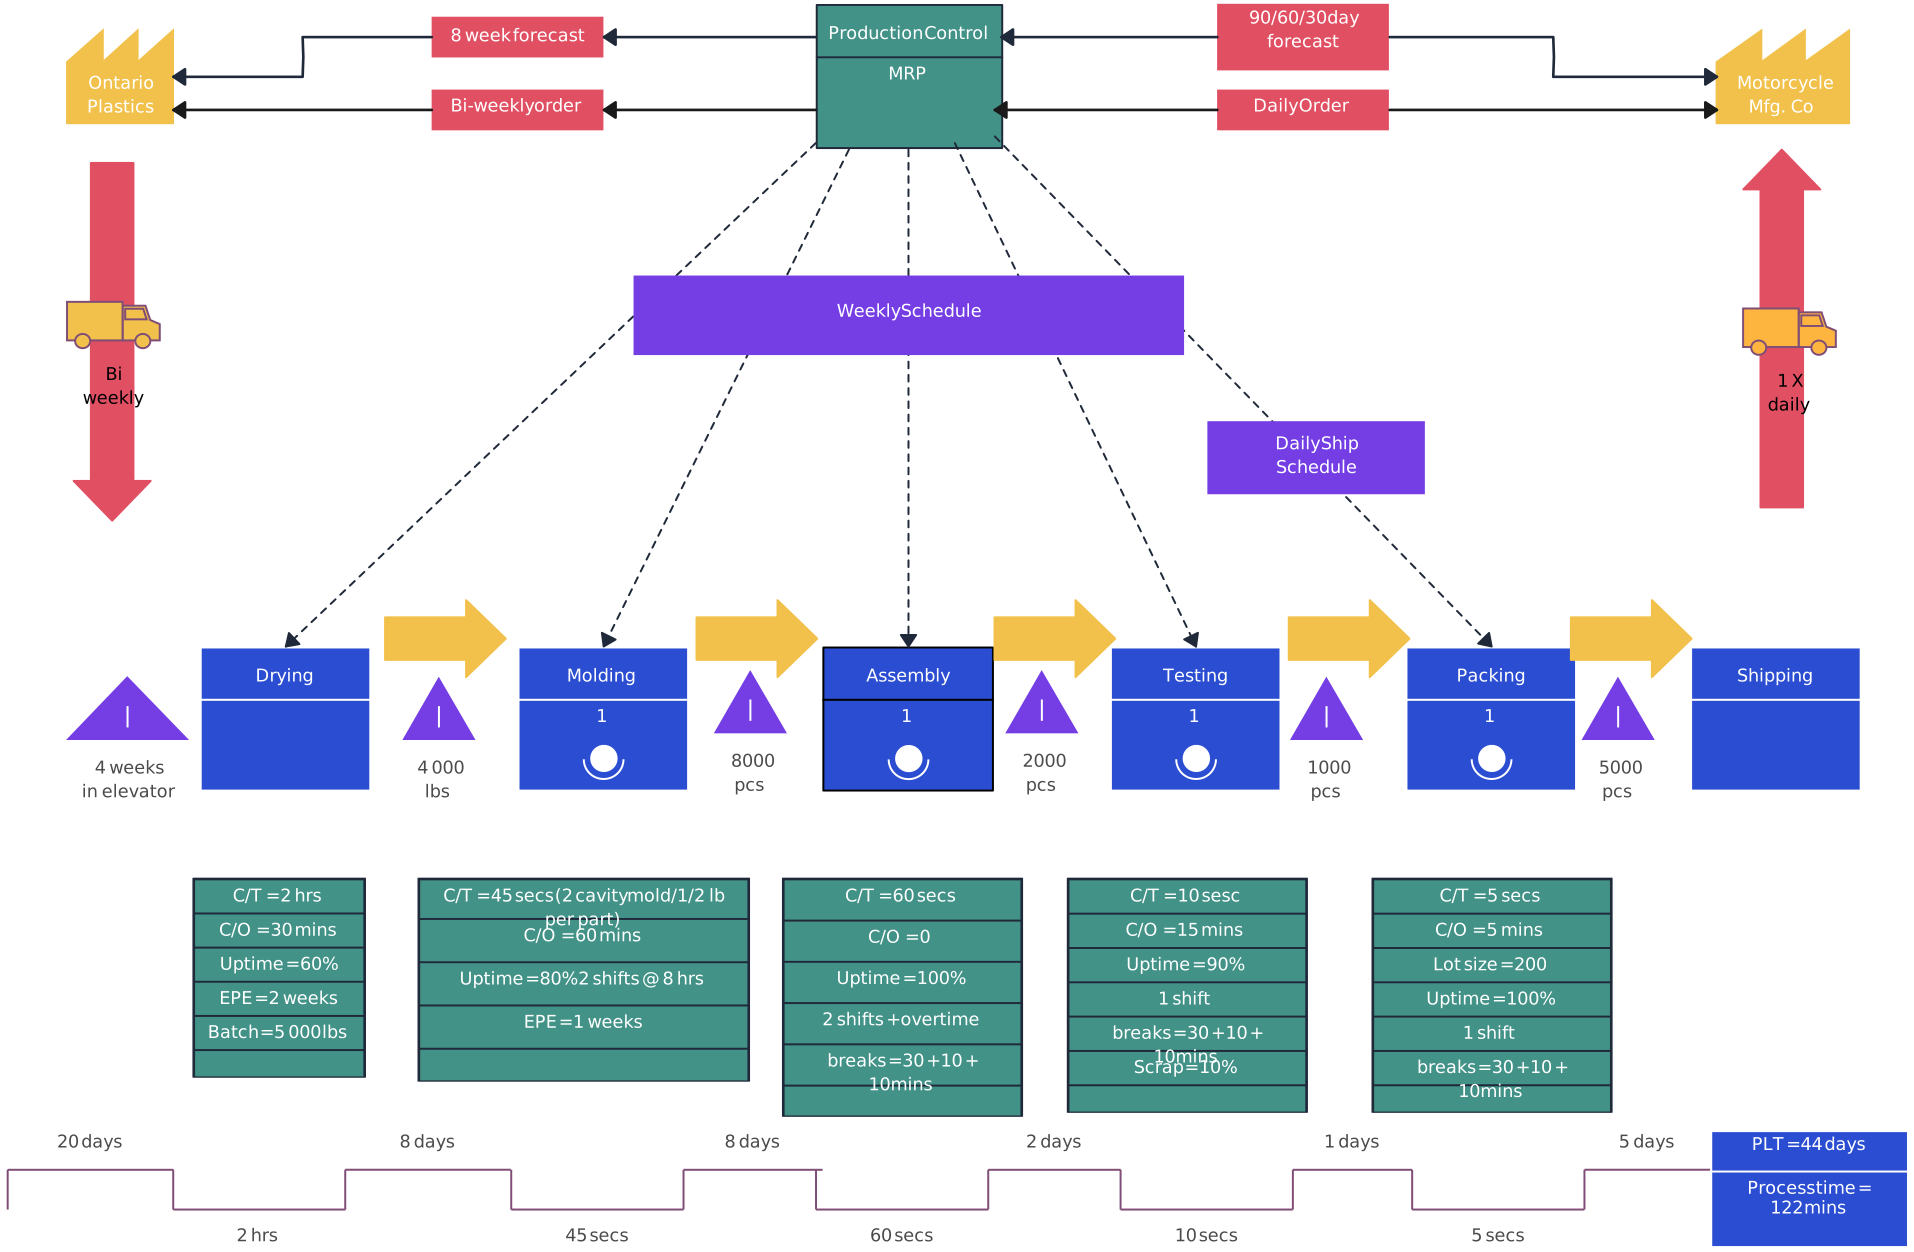
Value stream mapping (VSM) documents the flow of materials and information required to deliver a product or service. Teams use a current-state map to understand actual conditions, identify waste such as delays or excess inventory, and design a future state for testing. This usage aligns with the Lean Enterprise Institute’s value-stream-mapping guidance.
How to use it
- Map the current state: Document each step in your process, from start to finish. Include details such as time taken for each step, the people involved, and the flow of materials and information.
- Identify waste: Analyze the map to look for areas of waste, including delays, bottlenecks, or unnecessary steps. Highlight these issues to focus on areas needing improvement.
- Create a future state map: Develop a new process flow that eliminates waste and improves efficiency. Consider how to streamline steps, reduce wait times, and enhance communication.
- Implement and measure: Test the new process to see how it performs. Gather data and feedback, and make adjustments as needed to ensure the improvements are effective.
Why it helps
- Clear visualization: VSM provides a straightforward visual representation of processes, making it easier to understand and analyze.
- Identifies waste: The tool helps pinpoint inefficiencies, allowing teams to target specific areas for improvement.
- Improves communication: By involving various stakeholders in the mapping process, teams foster better collaboration and understanding across departments.
- Supports a measurable future state: Teams can test whether proposed changes improve flow, lead time, or other selected measures.
9. Process Mapping
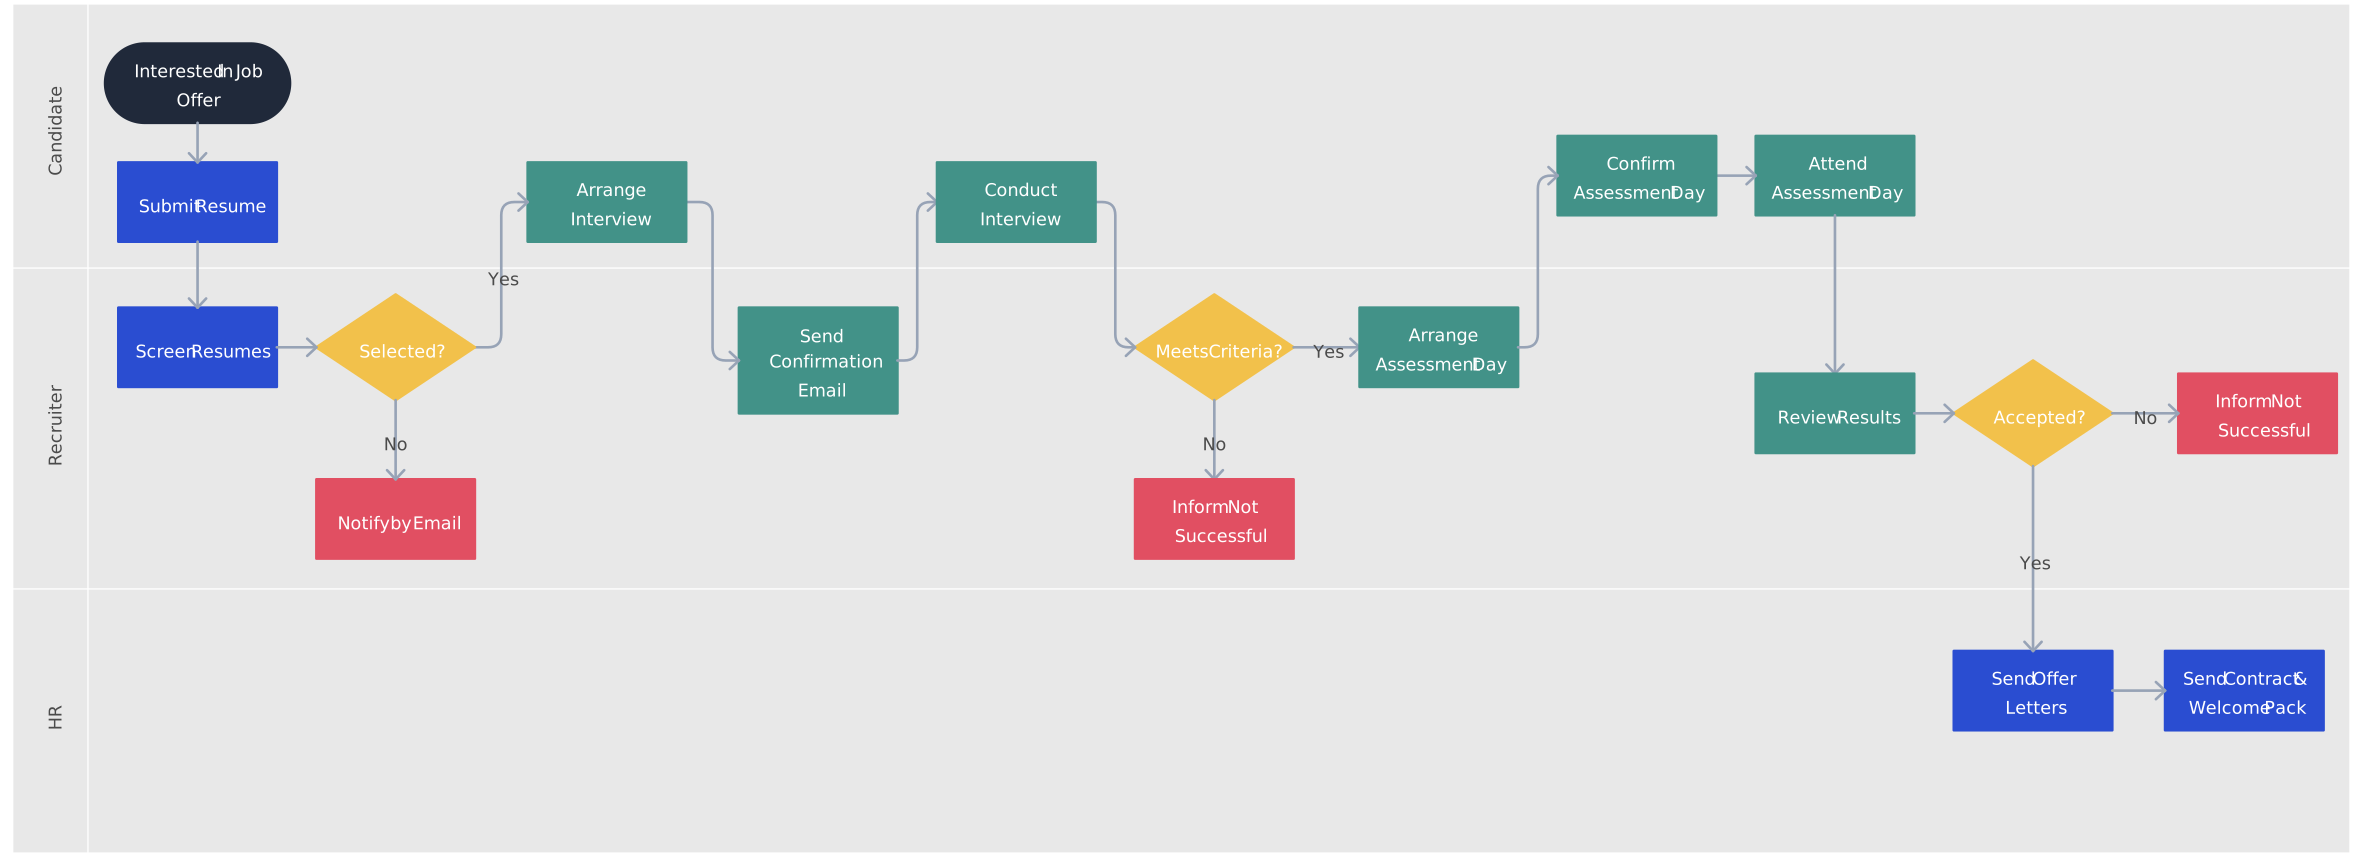
Process mapping visually documents the steps, decisions, roles, and handoffs in a workflow. A current-state map helps teams build a shared understanding of how work happens and identify points that need further investigation, such as delays, rework, unclear ownership, or unnecessary steps.
With Creately’s process mapping software, teams can map current and proposed workflows, clarify owners and cross-functional handoffs, and keep supporting notes and links connected to relevant process steps. Real-time collaboration, comments, and @mentions let stakeholders discuss findings and provide feedback in context. Maintaining the same process workspace as changes are tested and adopted helps the map serve as living process documentation rather than a static snapshot.
How to use it
- List steps: Write down each step in the process in the order they occur. Be detailed and include all actions, inputs, and outputs involved in the workflow.
- Create a flowchart: Use standard symbols to create the process map. For example, use rectangles for tasks, diamonds for decisions, and arrows to show how the steps connect.
- Analyze: Review the process map to identify inefficiencies such as unnecessary steps, delays, or areas of confusion. Think critically about ways to simplify or improve the process, such as eliminating redundancies or streamlining communication.
Why it helps
- Enhanced clarity: Process mapping provides a clear visual representation of workflows, making it easier for team members to understand their roles and responsibilities.
- Identification of inefficiencies: The mapping process helps highlight areas where time, resources, or efforts are being wasted, allowing for targeted improvements.
- Facilitates communication: Sharing process maps with stakeholders fosters better understanding and collaboration among team members and departments.
- Supports training and onboarding: New employees can use process maps to quickly learn and understand workflows, reducing the learning curve and increasing efficiency.
10. SIPOC
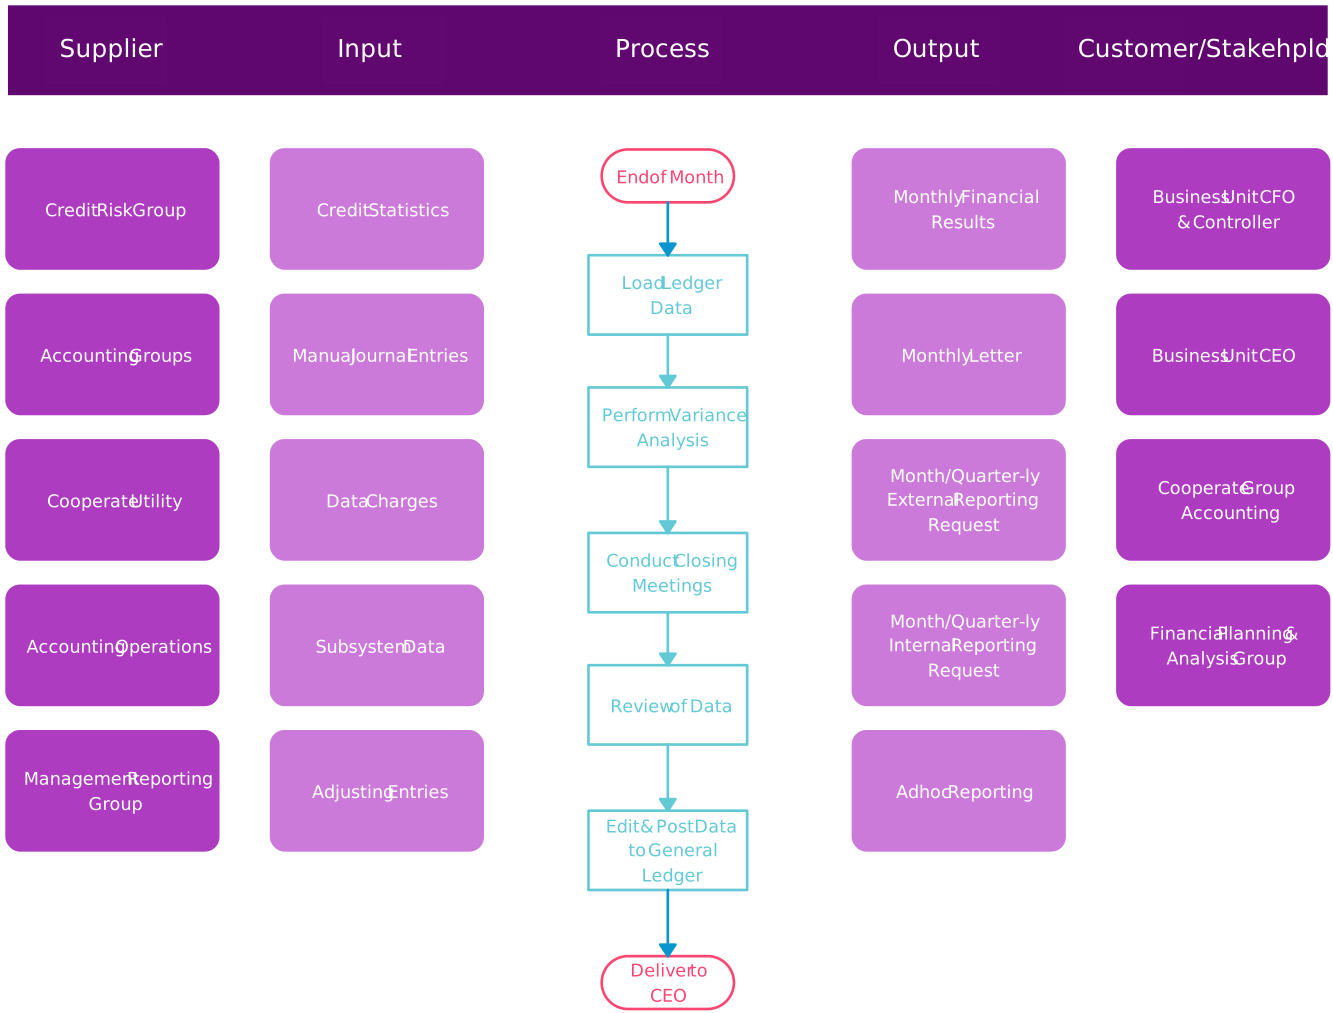
SIPOC stands for Suppliers, Inputs, Process, Outputs, and Customers. This high-level process view helps a team agree on scope and identify the main inputs, outputs, and stakeholders before conducting a more detailed analysis.
How to use it
- Identify suppliers: List the people, departments, or systems that provide inputs to the process. This helps clarify who is involved in the initial stages of the workflow.
- List inputs: Document the resources, materials, or information that are required for the process to function. These inputs are essential for completing each step effectively.
- Describe the process: Summarize the key steps involved in the process. Provide a high-level overview without going into too much detail, focusing on the major actions that take place.
- Identify outputs: Define what the process produces or delivers at the end. This could include finished products, services, or results that are sent to customers.
- List customers: Note who receives the outputs of the process. This can include internal stakeholders, external clients, or any other parties that benefit from the completed work.
Why it helps
- Holistic view: SIPOC provides a broad perspective of a process, allowing teams to see how different elements connect and interact.
- Clarity in roles: Identifying suppliers and customers clarifies roles and responsibilities, ensuring everyone understands their part in the process.
- Effective communication: SIPOC diagrams serve as a valuable communication tool, making it easier to share information with stakeholders and align goals.
- Simplified analysis: By summarizing the essential components of a process, SIPOC allows teams to focus on high-impact areas without getting bogged down in unnecessary details.
11. Bottleneck Analysis
Bottleneck Analysis is a method used to identify and address points in a process where work slows down or gets stuck, hindering overall productivity. A bottleneck occurs when a specific step in the workflow has a lower capacity than the steps before or after it, causing delays and inefficiencies. By pinpointing these critical areas, organizations can take steps to improve flow, increase efficiency, and enhance overall performance. This analysis helps teams understand where resources are being wasted and where adjustments are needed to optimize the entire process.
How to use it
- Map the process: Create a visual flowchart of the entire process, documenting each step involved. This helps you see how work moves through the process and where it might be piling up.
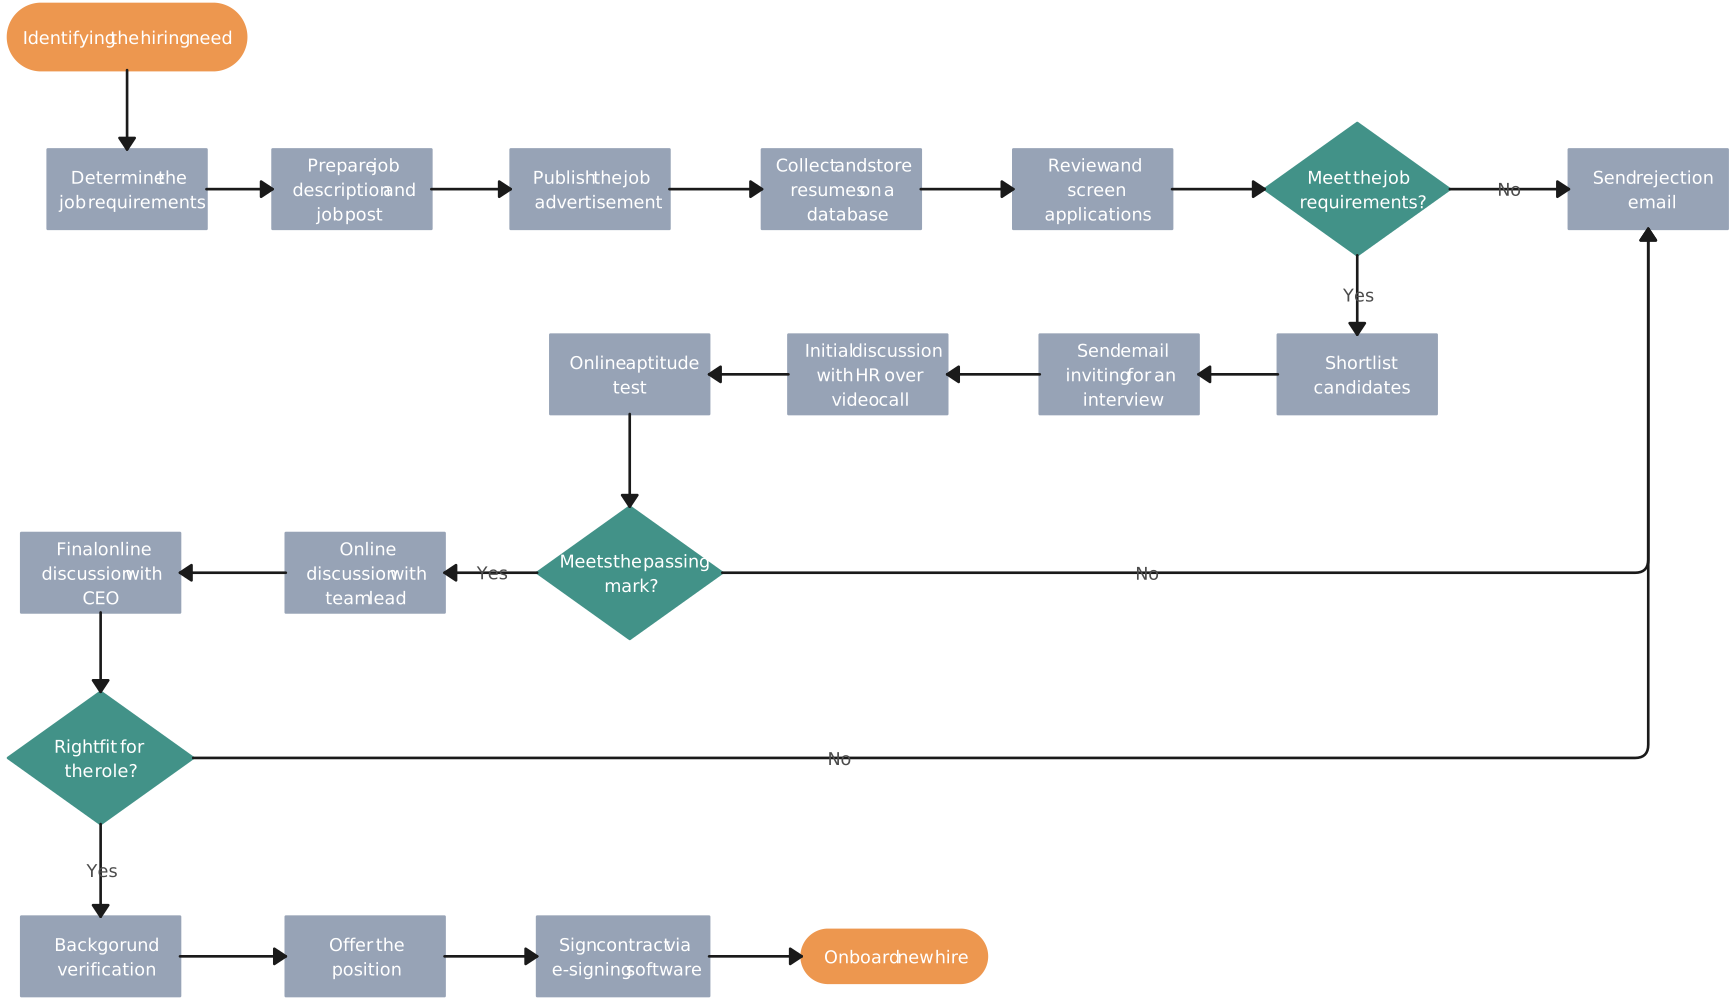
- Identify the bottleneck: Examine the flowchart to look for the step that limits the speed or capacity of the entire process. This is often where delays occur, leading to a backlog of work.
- Address and test the constraint: Focus on improving or redesigning the bottleneck step, then measure whether the change improves end-to-end flow. Options may include changing work policies, reallocating resources, simplifying tasks, or improving tools.
Why it helps
- Increased efficiency: By addressing bottlenecks, organizations can enhance the overall speed and efficiency of their processes. Learn how to avoid bottlenecks in processes.
- Enhanced productivity: Identifying and resolving slow points helps teams maximize their output and use resources more effectively.
- Improved workflow: A smoother flow of work reduces frustration among employees and creates a more positive work environment.
- Better resource allocation: Understanding bottlenecks allows teams to allocate resources more effectively, ensuring that critical tasks receive the attention they need.
12. Six Sigma
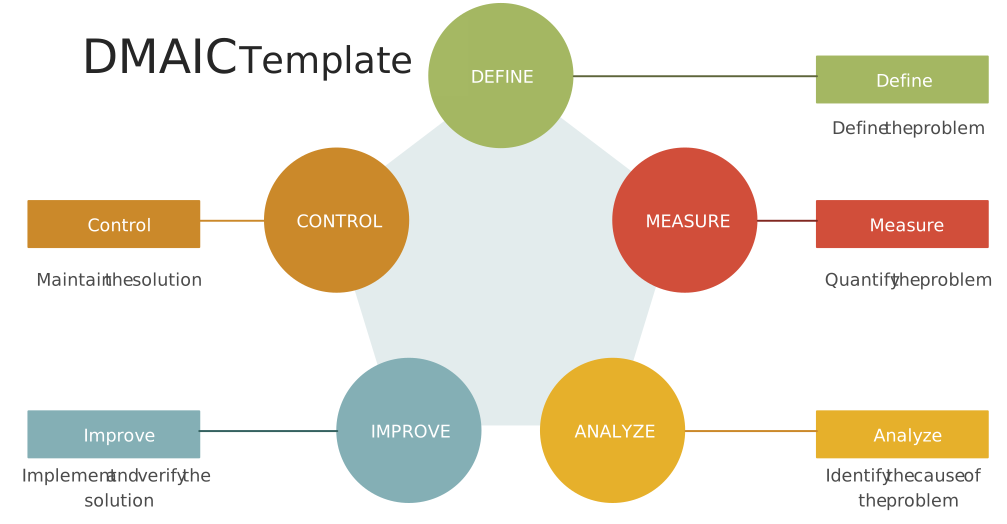
Six Sigma is a data-driven methodology for improving quality by reducing defects and process variation. Developed at Motorola in the 1980s, it uses statistical and problem-solving tools to understand performance and address verified causes. Teams often organize Six Sigma improvement work through DMAIC and related Six Sigma tools.
How to use it
- Define: Clearly identify the problem or area for improvement. Establish the project goals and what success looks like.
- Measure: Collect data to understand the current performance of the process. This includes identifying key metrics that will help gauge progress.
- Analyze: Use the collected data to identify the root cause of the problem. This may involve statistical analysis to understand patterns and variations.
- Improve: Implement solutions designed to eliminate the root cause of the problem. Test and refine these solutions to ensure they effectively address the issues.
- Control: Monitor the process to ensure that improvements are sustained over time. Use control charts and other tools to keep track of performance and make adjustments as necessary.
Why it helps
- Quality focus: Six Sigma helps teams measure defects and variation, then test ways to reduce them.
- Data-driven decision-making: The emphasis on data collection and analysis fosters informed decision-making rather than relying on guesswork.
- Cost analysis: Teams can quantify waste and rework, helping them assess the financial effect of a change.
- Process performance: DMAIC keeps improvement work tied to defined measures and control plans.
- Repeatable problem-solving: The shared method gives participants a consistent way to structure improvement projects.
13. A3 Problem Solving
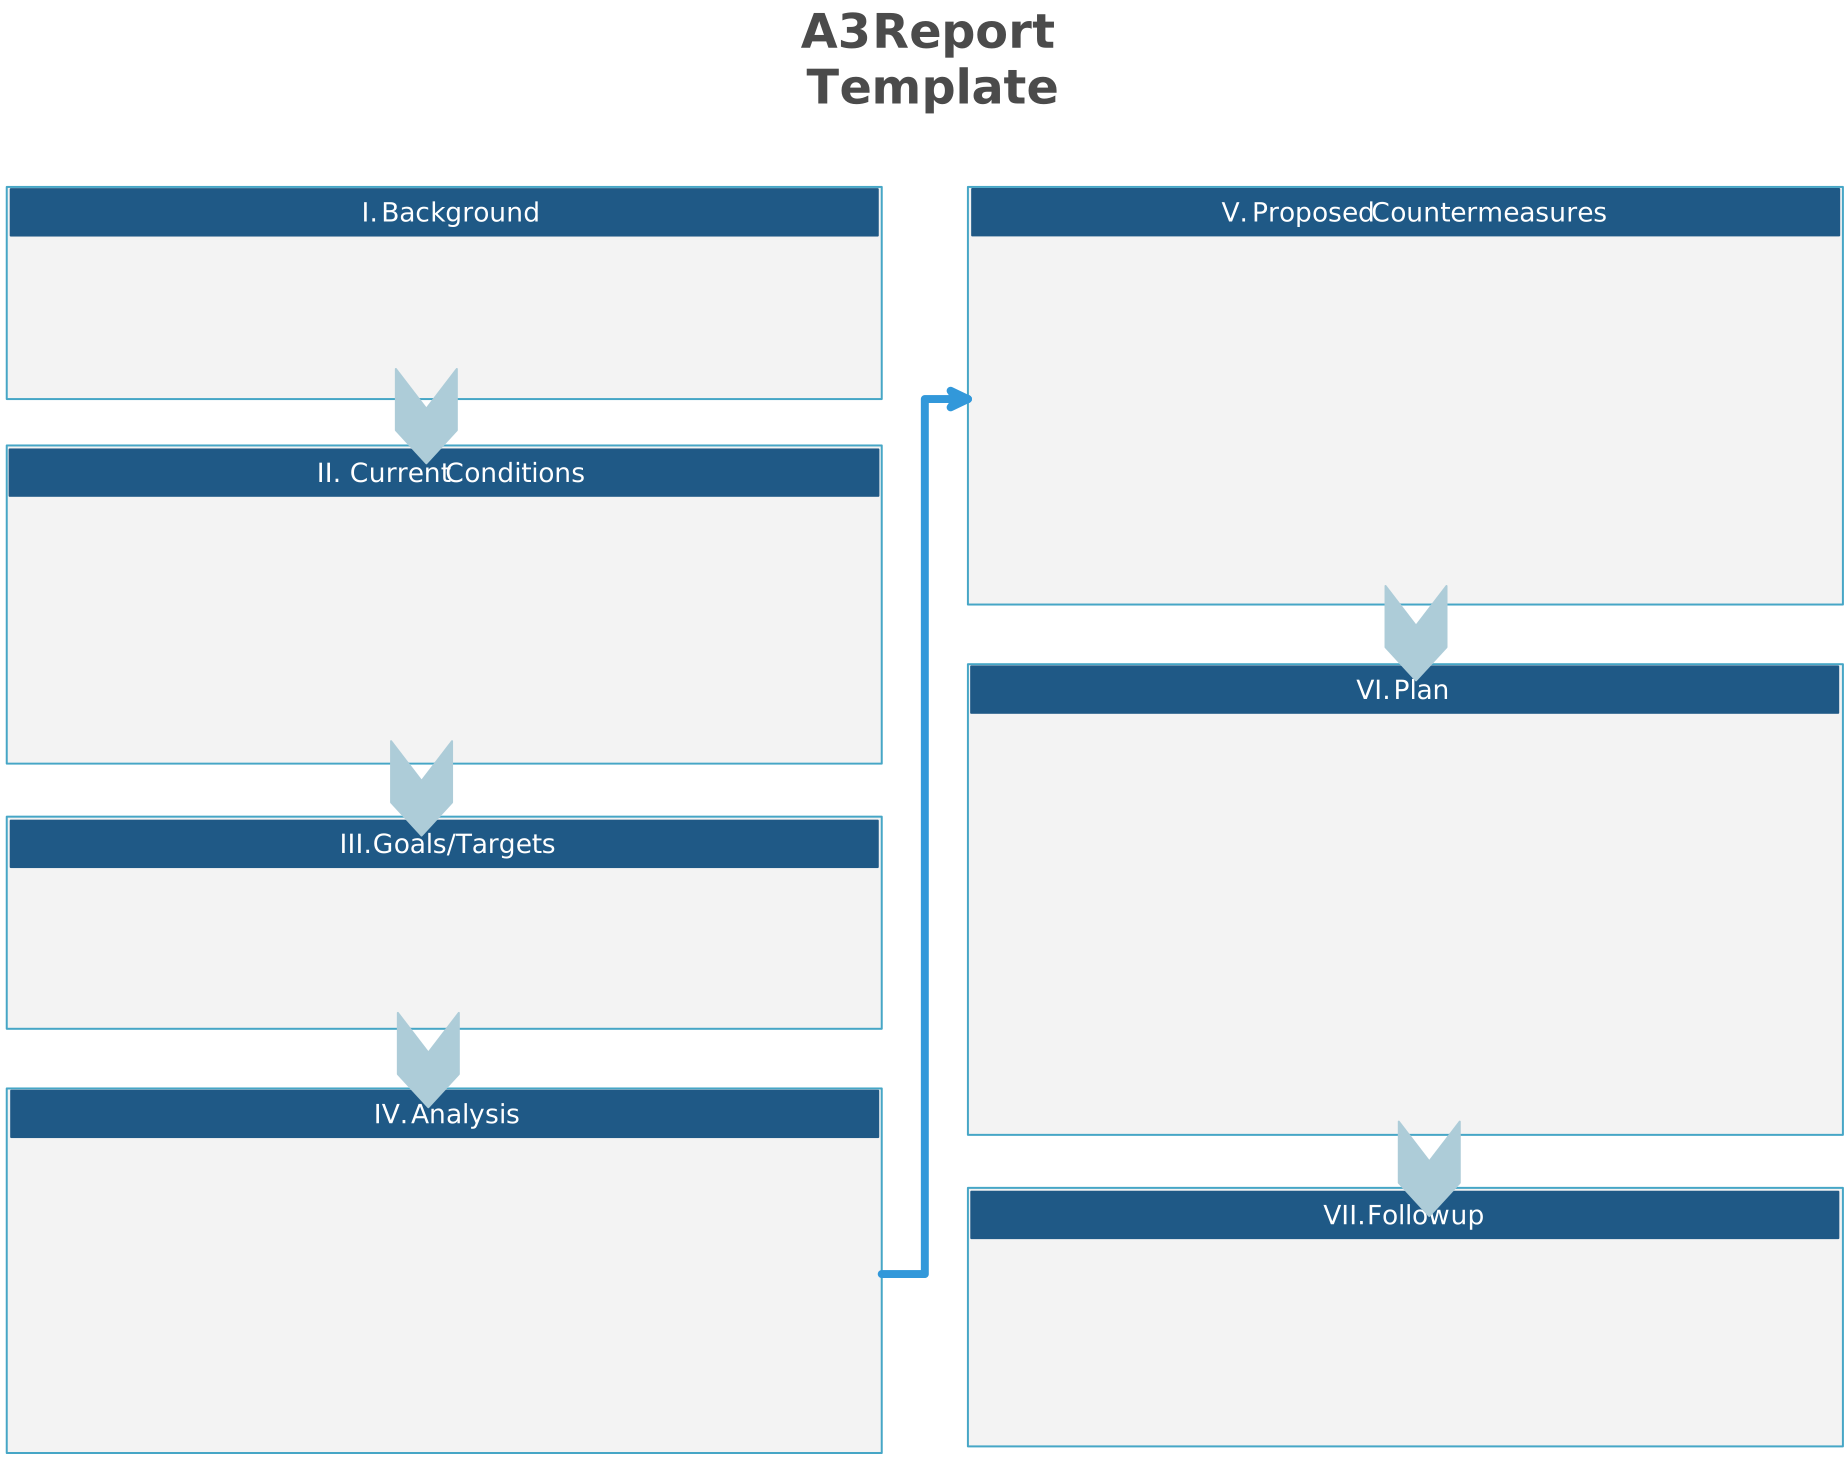
A3 Problem Solving is a structured approach used to identify, analyze, and solve problems in a clear and concise manner. Named after the A3-sized paper (approximately 11 x 17 inches) it’s typically documented on, this tool encourages teams to distill complex issues into a straightforward format. The A3 report includes essential information about the problem, current state, analysis, proposed solutions, and action plans. This method not only helps in problem-solving but also fosters communication and collaboration among team members, making it easier to share insights and progress.
How to use it
- Define the problem: Clearly describe the issue at hand, including its impact on the process, team, or organization. This sets the stage for the rest of the analysis.
- Analyze the current state: Gather relevant data to understand the current situation. Analyze this data to identify the root cause of the problem, focusing on what contributes to the issue.
- Propose solutions: List potential solutions to address the root cause. Include the benefits of each solution to help stakeholders understand their value.
- Implement and follow up: Test the chosen solution on a small scale to evaluate its effectiveness. Monitor progress and make adjustments as necessary to ensure the solution works well in practice.
Why it helps
- Concise documentation: The A3 format encourages clarity and brevity, making it easier to communicate complex issues.
- Structured approach: A3 Problem Solving provides a systematic method for tackling problems, ensuring no critical steps are overlooked.
- Enhanced collaboration: The shared document fosters teamwork, as team members can contribute their insights and expertise throughout the process.
- Focus on root causes: By emphasizing root cause analysis, A3 helps prevent superficial fixes and promotes long-term solutions.
14. Pareto Chart
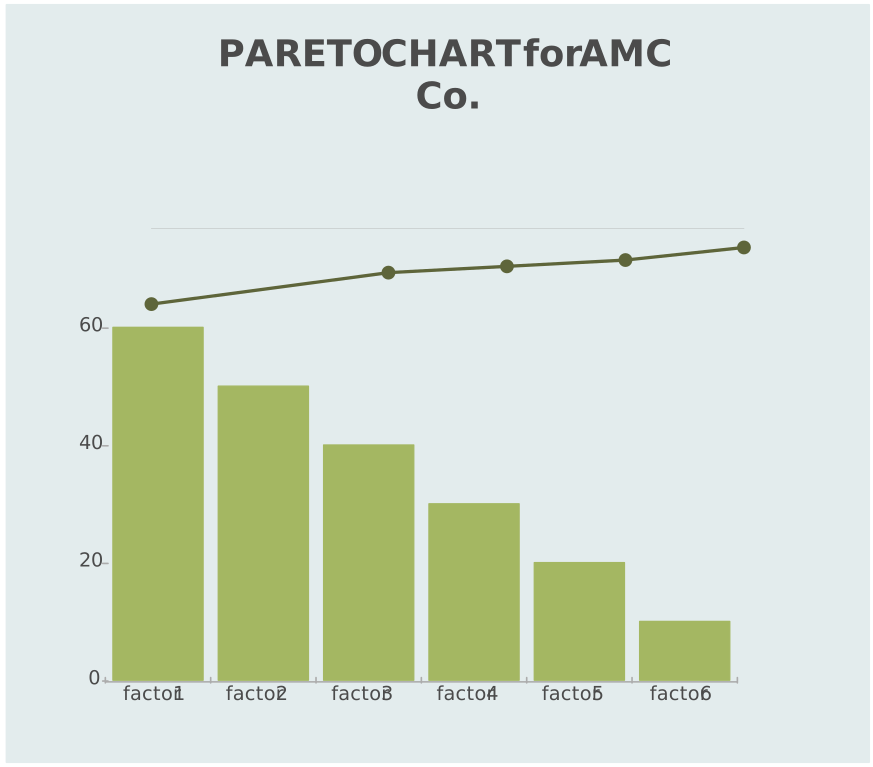
A Pareto chart orders categories from the largest contribution to the smallest, helping teams identify which issues account for most of an observed effect. It is associated with the 80/20 principle, but teams should use their actual data rather than assume every problem follows an exact 80/20 split.
How to use it
- Collect data: Gather information about the causes of the problem you’re facing. This could include data on defects, complaints, or any other relevant metrics that identify issues.
- Create the chart: Plot the causes on the x-axis (horizontal) and their frequency or impact on the y-axis (vertical). Each bar represents a specific cause and its contribution to the overall problem. Arrange the bars in descending order, with the most significant causes on the left.
- Analyze: Review the chart to identify the few causes that account for the majority of the problem. Focus your efforts on addressing these key issues, as resolving them can lead to significant improvements.
Why it helps
- Prioritization of issues: The chart highlights which causes are most impactful, helping teams prioritize their improvement efforts effectively.
- Clear visualization: The graphical representation makes it easy to see the major contributors to a problem, enhancing understanding among team members.
- Data-driven decisions: By relying on actual data, teams can make informed decisions about where to focus their resources.
- Enhanced communication: Pareto Charts serve as a useful communication tool, allowing teams to share insights and findings with stakeholders clearly.
15. Control Chart
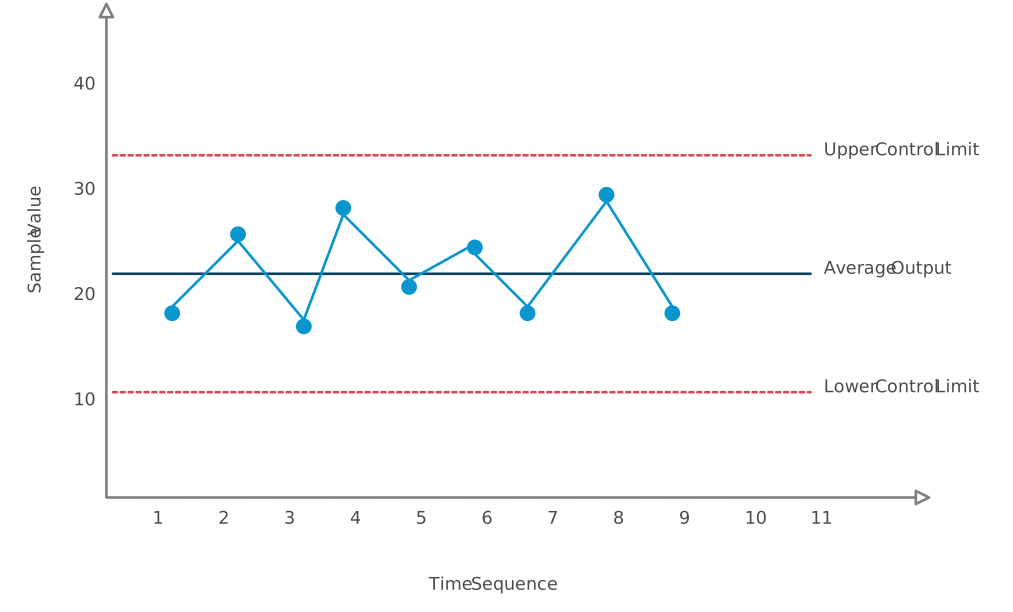
A control chart plots process data over time against statistically calculated upper and lower control limits. These are not customer specifications or “acceptable” limits; they help teams distinguish common-cause variation from signals that the process may have changed. See ASQ’s overview of the seven basic quality tools for the role of control charts, fishbone diagrams, and Pareto charts in quality improvement.
How to use it
- Collect data: Gather data points from the process over a specific period. This data can include measurements, output quantities, or any relevant metrics that reflect the process performance.
- Plot the data: Create a Control Chart by plotting the collected data points over time. Include upper and lower control limits based on historical data, which define the acceptable range for process variation.
- Analyze: Monitor points and patterns using the selected control-chart rules. A point outside a control limit or another non-random signal warrants investigation; a process can be statistically stable and still fail to meet customer requirements.
Why it helps
- Process monitoring: Control Charts provide a continuous overview of process performance, helping teams identify trends or shifts in stability.
- Early detection of issues: By highlighting data points outside of control limits, these charts allow teams to catch potential problems before they escalate.
- Data-driven insights: The visual representation of data helps teams make informed decisions based on actual performance rather than assumptions.
- Improved quality control: Using Control Charts fosters a proactive approach to quality management, ensuring consistent output and reducing defects.
16. Lean
Lean is a methodology aimed at maximizing value for customers while minimizing waste in processes. Originating from the Toyota Production System, Lean focuses on creating more value with fewer resources by eliminating activities that do not add value. By streamlining processes and improving efficiency, organizations can reduce costs and improve customer satisfaction. Lean encourages a culture of continuous improvement, where everyone in the organization is engaged in identifying and solving problems to enhance performance.
How to use it
- Identify value: Understand what your customers truly value in your product or service. This helps you focus on delivering features or aspects that matter most to them.
- Eliminate waste: Remove any steps or activities in your process that do not contribute to value. This includes anything that consumes resources without benefiting the customer, such as excess inventory, waiting times, or unnecessary movements.
- Improve flow: Ensure that work moves smoothly through each step of the process. Look for bottlenecks or delays and work to streamline transitions between tasks to maintain a steady flow.
- Pull system: Implement a pull system where production is based on customer demand. This means only producing what is needed when it’s needed, reducing excess inventory and waste.
- Pursue improvement: Encourage team members to identify and test further ways to reduce waste and increase customer value.
Why it helps
- Increased efficiency: Lean principles help organizations streamline processes, resulting in faster turnaround times and reduced costs.
- Enhanced customer satisfaction: By focusing on delivering value, organizations can better meet customer needs and expectations.
- Reduced waste: Lean practices identify and eliminate wasteful activities, leading to better resource utilization.
- Empowered employees: Lean encourages employee involvement in problem-solving, fostering a sense of ownership and accountability.
17. The 3Ms: Muri, Mura, and Muda
The 3Ms are three related Lean concepts—Muri, Mura, and Muda—that help teams examine overburden, unevenness, and waste in a process. Looking at all three can prevent a team from removing visible waste while overlooking workload or flow problems that contribute to it.
Muri refers to overburden or excessive strain placed on people, machines, or processes. This can lead to burnout, mistakes, and equipment failure.
Mura means unevenness or variability in processes. This can result in fluctuations in workload, inconsistent quality, and inefficiencies.
Muda represents waste—any activity or resource that does not add value to the customer. This can include excessive inventory, unnecessary steps, or waiting times.
How to use it
- Identify Muri: Look for areas in your processes where employees or machines are being pushed beyond their limits. This could manifest as excessive overtime, unrealistic deadlines, or overloaded equipment.
- Address Mura: Assess your workflows for inconsistencies or variability. Determine if there are fluctuations in demand or workload that lead to uneven resource allocation, and strive to create a more balanced process.
- Eliminate Muda: Review your operations to identify wasteful activities that do not add value. Focus on removing or reducing these unnecessary steps, ensuring that every part of the process contributes to delivering value to the customer.
Why it helps
- Enhanced efficiency: By addressing Muri, Mura, and Muda, organizations can streamline their processes, reduce unnecessary strain, and optimize resource usage.
- Quality analysis: Examining unevenness can reveal conditions that contribute to inconsistent output.
- Workload awareness: Identifying overburden highlights demands that may contribute to errors, fatigue, or equipment problems.
- Waste reduction: Identifying non-value-adding work gives teams specific opportunities to evaluate.
18. Poka Yoke
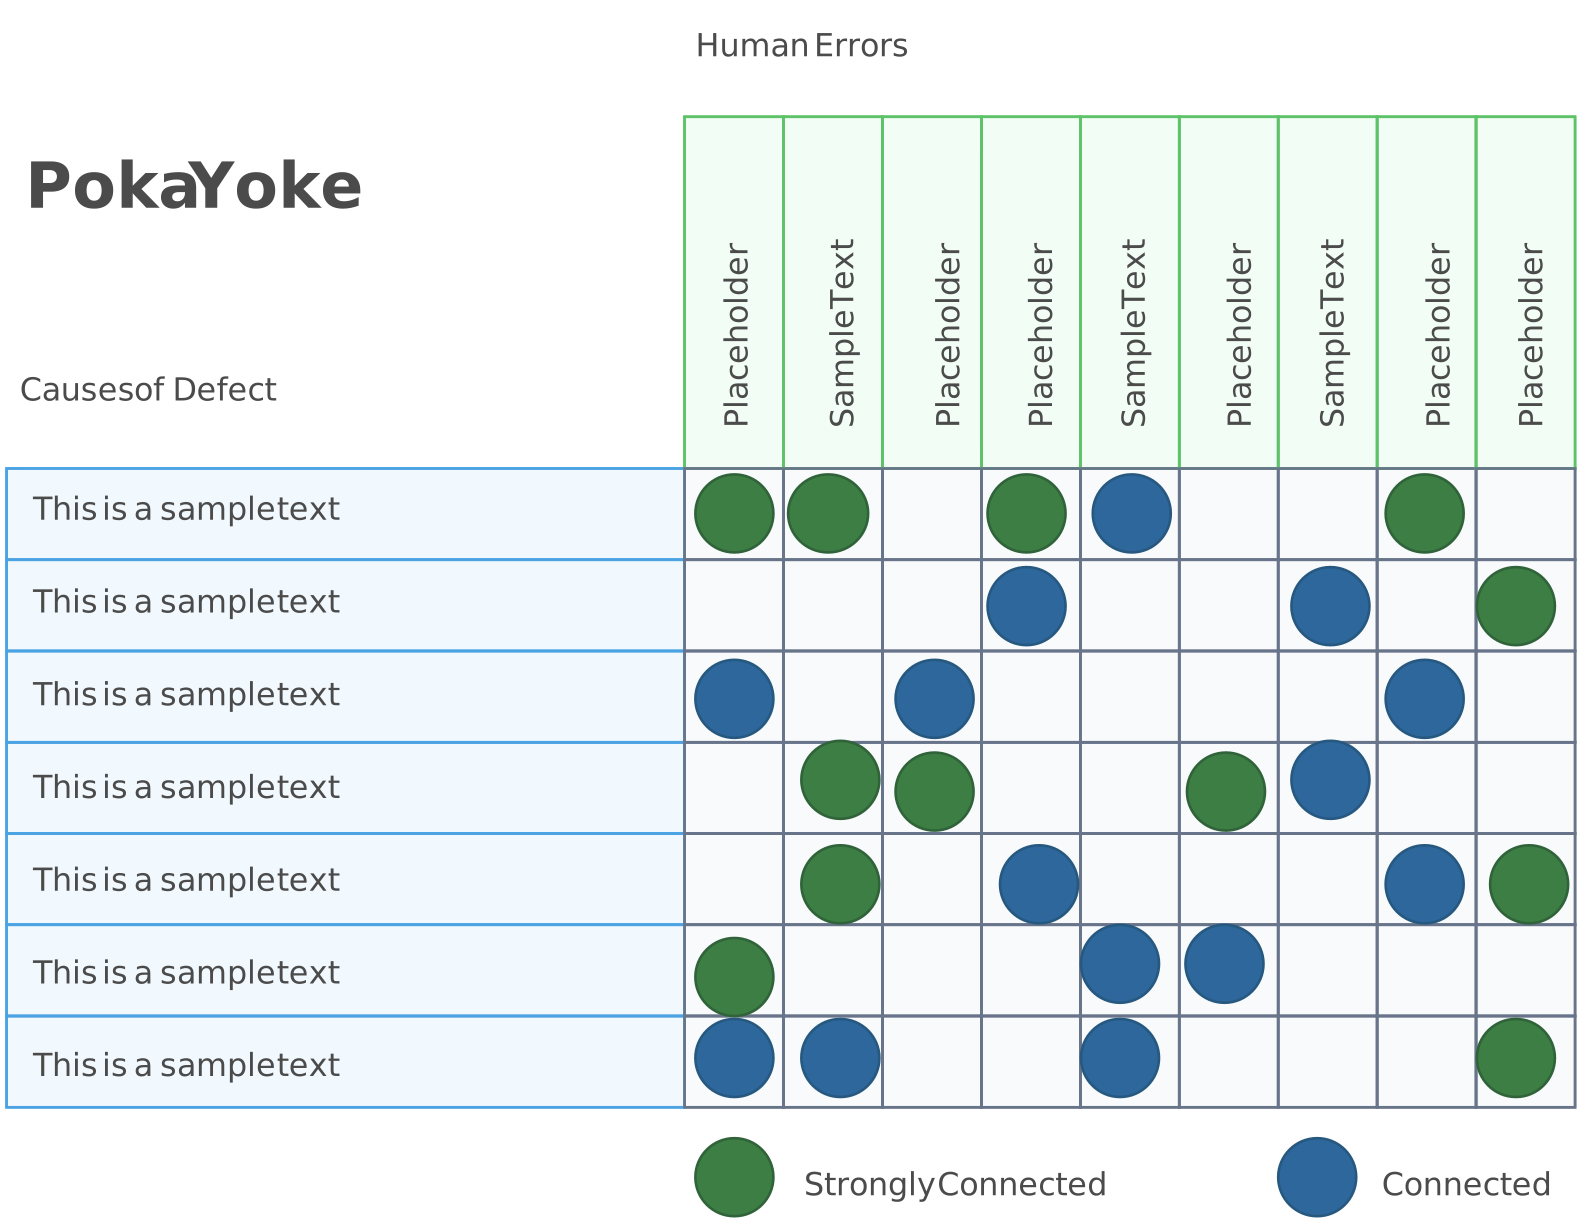
Poka-yoke means mistake-proofing. It refers to mechanisms that prevent an error, make an incorrect action difficult, or make the error immediately visible so it can be corrected before it becomes a defect.
How to use it
- Identify potential errors: Analyze your processes to identify where mistakes are likely to occur. Look for areas that are prone to human error, such as complex tasks, repetitive actions, or critical steps in a workflow.
- Design error-proofing solutions: Develop simple solutions or mechanisms to prevent errors. This can include:
- Physical barriers: Create designs that make it impossible to complete a task incorrectly, such as using jigs or fixtures.
- Visual cues: Implement color coding or labeling to guide users and clarify what should be done at each step.
- Checklists: Use checklists or templates to ensure all necessary steps are completed before moving to the next phase.
- Automation: Integrate technology or software to handle repetitive tasks, reducing the likelihood of human error.
- Implement and test: Introduce your Poka Yoke solutions in the process. Monitor their effectiveness in preventing errors and make adjustments as needed. Engage team members to ensure they understand how to use the error-proofing measures correctly.
- Review and improve: Continuously assess the effectiveness of your Poka Yoke solutions. Gather feedback from users and analyze error rates to identify any remaining vulnerabilities. Make iterative improvements to enhance the robustness of the process further.
Why it helps
- Reduced errors: By preventing mistakes, Poka Yoke techniques lead to fewer defects and higher-quality outputs.
- Increased efficiency: Less time spent correcting errors means more efficient processes and improved productivity.
- Enhanced safety: By identifying potential mistakes and making them impossible, Poka Yoke can help create safer work environments.
- Lower costs: Reducing errors and defects leads to lower costs associated with rework, scrap, and customer complaints.
- Greater employee confidence: Implementing Poka Yoke fosters a culture of quality, where employees feel empowered to contribute to error prevention and process improvement.
Helpful Resources
PDCA cycle examples to inspire your continuous improvement efforts and transform your organization's processes.
Visual tools and templates to successfully determine the root causes of issues via thorough analysis.
Unlock the power of continuous improvement by mastering the Kaizen principles and transforming your organization’s efficiency and culture.
Discover the power of the Kaizen method to achieve continuous improvement.
Benefits of Continuous Improvement Tools
Continuous improvement tools can provide the following benefits when teams select the right method, use reliable evidence, and follow through on what they learn.
1. Improved efficiency
Continuous improvement tools help you spot and eliminate wasteful activities, such as unnecessary steps, delays, or duplicated efforts. By streamlining processes, these tools make it easier to get work done faster and with fewer resources. This means you can do more with less time and effort, boosting overall productivity.
2. Higher quality
By using tools like Six Sigma or Root Cause Analysis, businesses can reduce errors and defects in their products or services. Continuous improvement tools help teams find the root cause of problems, so they can fix issues for good rather than just applying short-term fixes. This leads to better quality outcomes and fewer mistakes.
3. Cost savings
Reducing waste, rework, and avoidable errors can lower operating costs. The financial effect depends on the process, implementation effort, and whether the improvement is sustained.
4. Team participation and shared understanding
Methods such as Kaizen and Gemba Walks bring frontline knowledge into improvement work. Participation alone does not guarantee engagement, but listening to employees and acting transparently on their input can strengthen shared understanding and ownership.
5. Better problem-solving
Continuous improvement tools provide structured ways to examine problems. Tools such as the fishbone diagram and 5 Whys help teams organize possible causes and decide what evidence to collect before testing a corrective action.
6. Better customer outcomes
Changes that improve reliability, quality, or delivery time may improve the customer experience. Teams should measure customer outcomes rather than assume an operational change automatically increases satisfaction.
7. Adaptability and experimentation
Continuous improvement tools such as Kanban and Lean make workflow conditions visible and encourage teams to test manageable changes. This supports adaptation by giving teams a repeatable way to respond to new evidence or operating conditions.
8. Sustained improvement
Incremental changes can build on one another when successful practices are standardized and reviewed. Long-term results depend on maintaining the process and adapting it when conditions change.
9. Data-driven decisions
Many continuous improvement tools rely on data, such as Control Charts or Pareto Charts, to measure performance and track progress. This means decisions are based on facts and data, not just intuition. With clear data insights, businesses can make more informed decisions and adjust strategies based on what’s really working.
Driving Success Through Continuous Improvement Tools
Continuous improvement tools give teams practical ways to understand workflows, investigate causes, test ideas, and evaluate results. PDCA, Kanban, 5S, process mapping, and the other methods in this guide solve different problems, so selection should begin with a clear objective and suitable evidence.
Start with one measurable problem. Document the current state, choose the tool that fits the question, assign ownership, and agree on when stakeholders will review the evidence. If a change works, update the process documentation and continue monitoring it; if it does not, use what the team learned to plan the next test.